Published: November 12th, 2024
Walt Disney is anticipated to report a quarterly profit of $1.09 per share in its next report, representing a 32.9% increase over the same period last year. According to analysts, revenues are expected to reach $22.59 billion, up 6.4% from the previous year.
It is critical to consider any modifications in revenue projections before a company's profit announcement. These revisions are essential for forecasting potential investor reactions to the stock. According to numerous empirical studies, there is a strong correlation between the immediate cost movements of shares and trends in earnings projections.
Average monthly earnings per paid member – ESPN+' is expected to hit $6.04, according to analysts. The company disclosed $5.34 for the same quarter last year, which is less than the current estimate.
According to analysts, the median monthly earnings per paid customer for Hulu – SVOD Only are expected to hit $11.96. This estimate contrasts with the $12.11 value from a year ago.
Analysts estimate the number of paid subscribers – Disney+ – domestic (U.S. and Canada) to be 55.53 million. The business revealed 46.5 million in the equivalent quarter last year, which is more than the current estimate.
Let's see the further outlook of this stock from the DIS technical analysis:

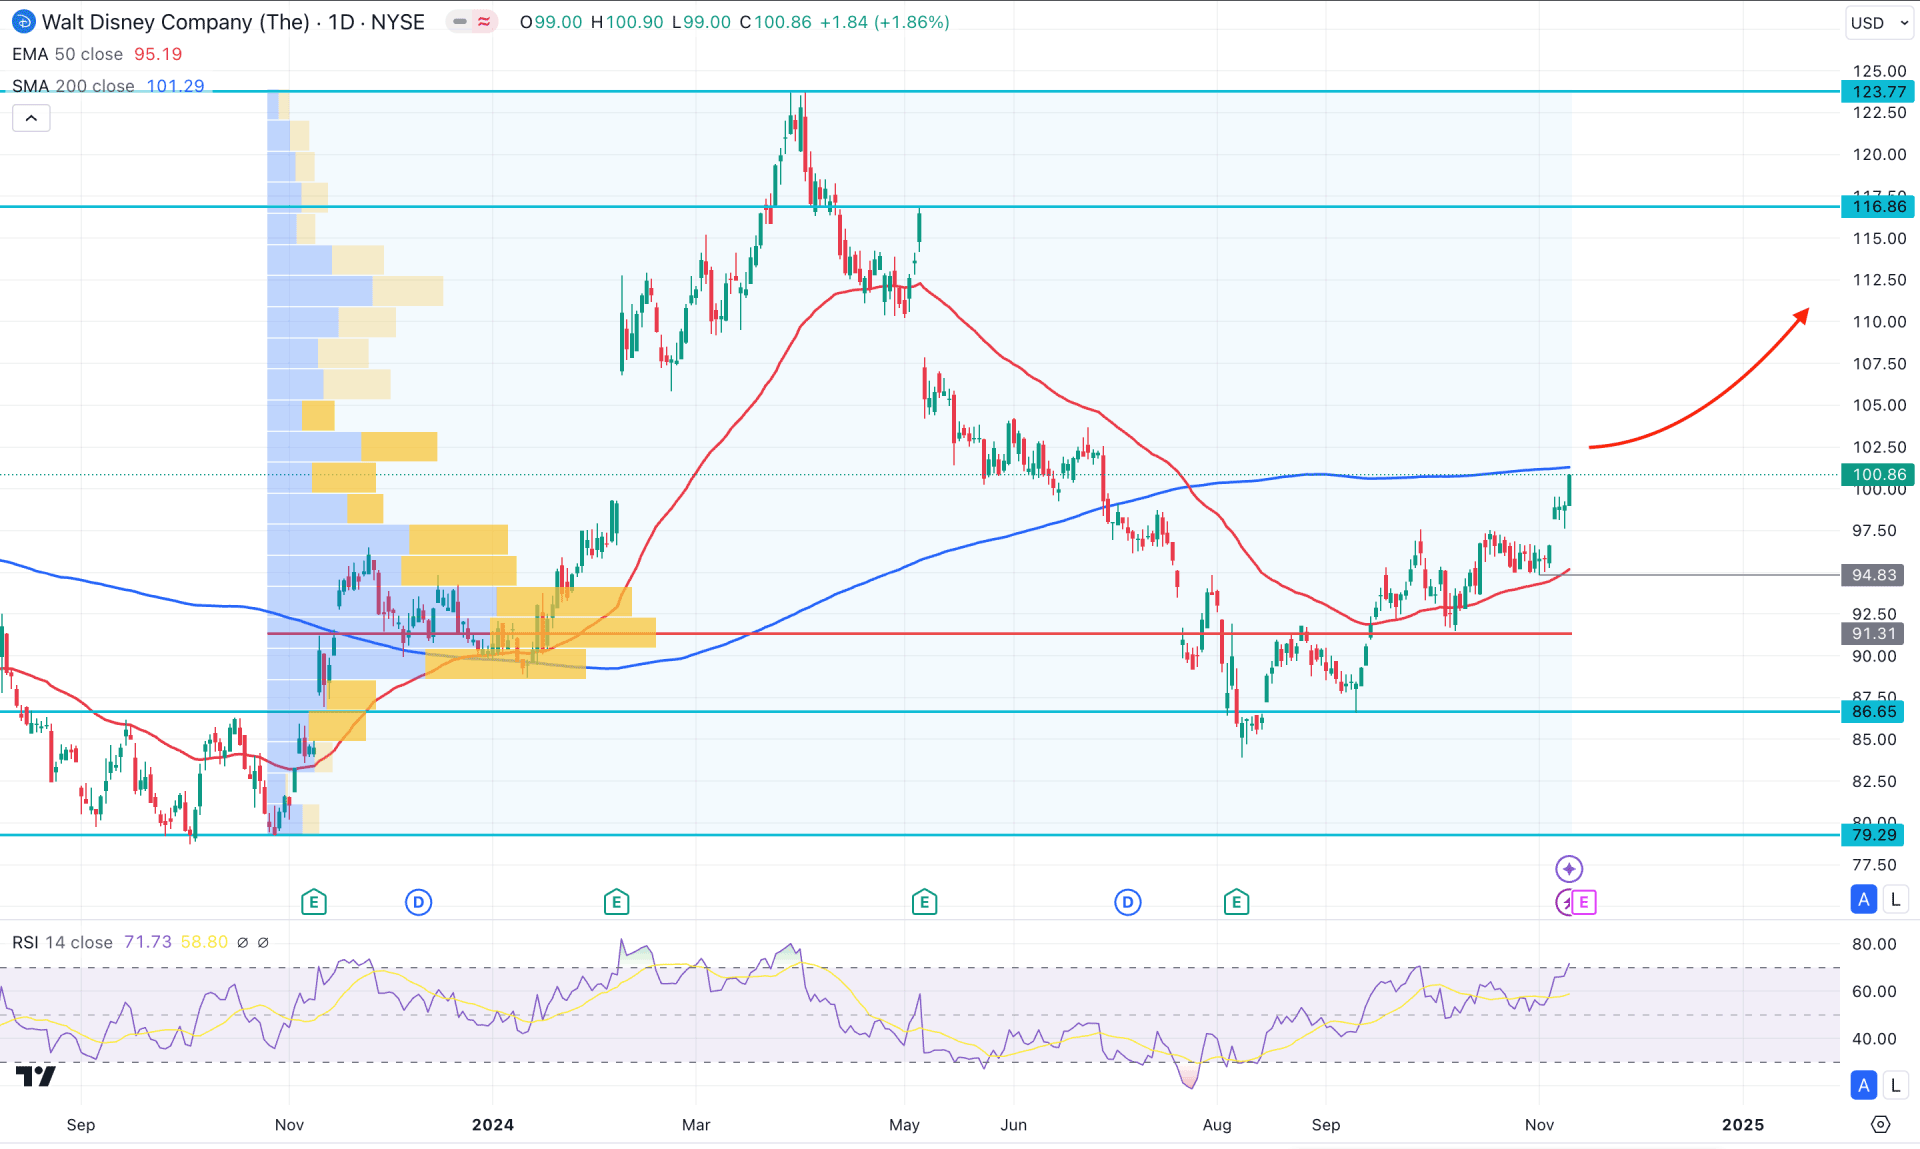
In the daily chart of DIS, the broader market momentum is corrective, while the most recent price showed a bullish recovery from the inverse Head and Shoulders breakout.
Looking at the higher timeframe, a bullish continuation is seen after 5 consecutive bearish months. A bullish rebound with a valid engulfing pattern is seen in September, followed by an inside bar. As the existing momentum is bullish, any minor downside correction in the lower timeframe could offer a decent trading opportunity.
In the volume structure, the buying pressure is potent as the most active level since October 2023 is below the current price. As the ongoing market pressure is above the high volume line, we may expect an upward continuation from institutional investors' presence.
In the main price chart, a bullish V-shape recovery is seen from the 50-day Exponential Moving Average, suggesting a potential buying pressure. However, the long-term market trend is not confirmed as the 200-day SMA is still above the current price and working as an immediate resistance.
In the secondary window, the Relative Strength Index (RSI) maintained the upward pressure by holding the position above the 50.00 neutral line. As the most recent line is above the 70.00 area, we may consider the market pressure as strongly bullish.
Based on the daily market outlook of DIS, the upcoming earnings report could be a crucial event to look at. Primarily, a bullish momentum is expected as the 50-day EMA is holding the price as a near-term support. On the bullish side, we may expect the price to reach the 116.86 and even 130.00 level, after overcoming the 200-day SMA line.
The secondary bullish approach might come after having a sell-side liquidity sweep from the 94.83 to 88.00 zone. However, breaking below the 86.65 support level might invalidate the bullish possibility and lower the price below the 79.29 static line.

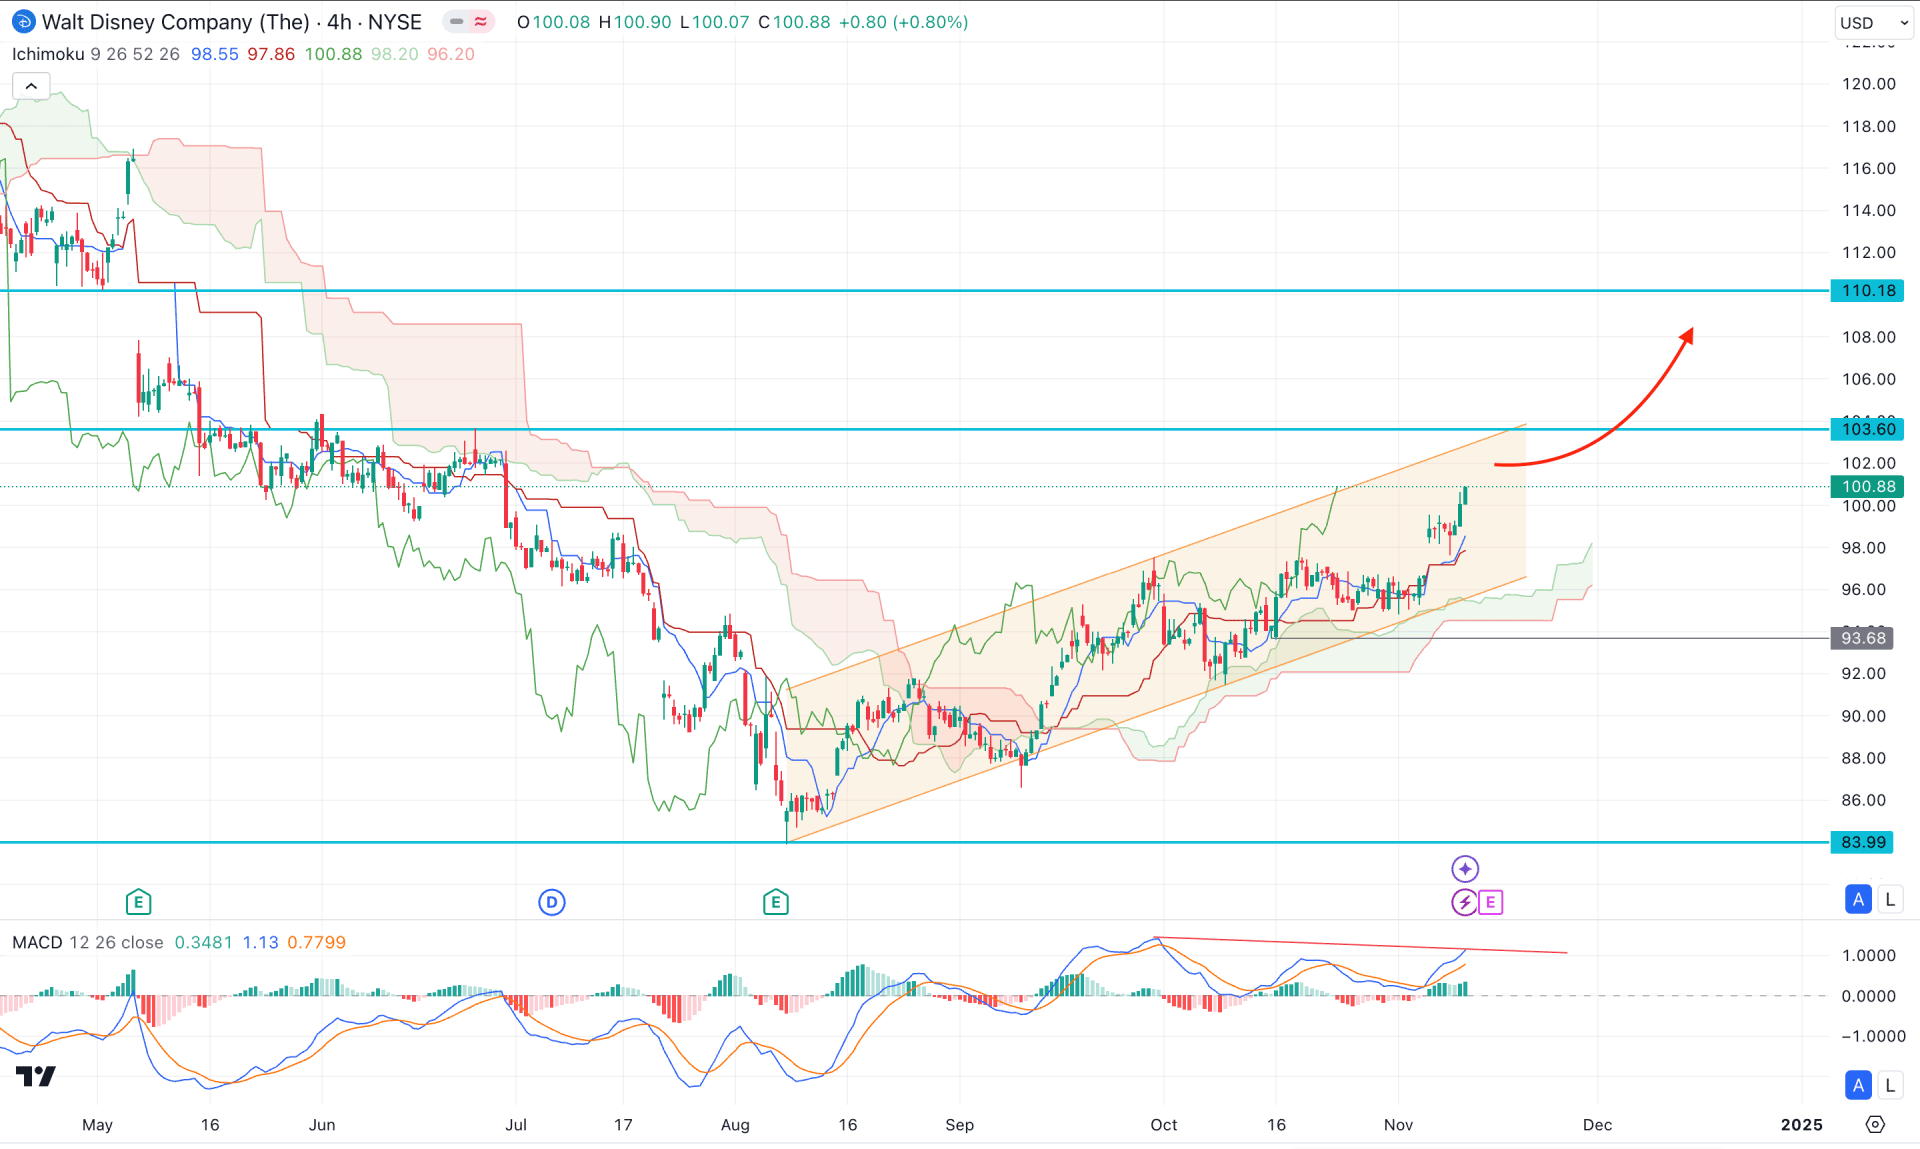
In the H4 timeframe, the ongoing market pressure is bullish as the current price hovers above the Ichimoku Cloud Zone. Moreover, Both Senkou Lines are aiming higher in the Futures Cloud, which suggests a confluence bullish factor for this stock.
On the other hand, the MACD Histogram maintained the green position, supporting the bullish momentum. However, the signal line failed to follow the price swing and created a potential divergence.
Based on the H4 market outlook, a bullish channel extension is highly possible, where the near-term resistance level is at the 103.60 level. On the bullish side, a valid bullish reversal from the 97.00 to 93.00 zone could open a long opportunity, aiming for the 108.00 area.
On the other hand, an immediate selling pressure below the 93.68 low might lower the price towards the 83.99 support level.

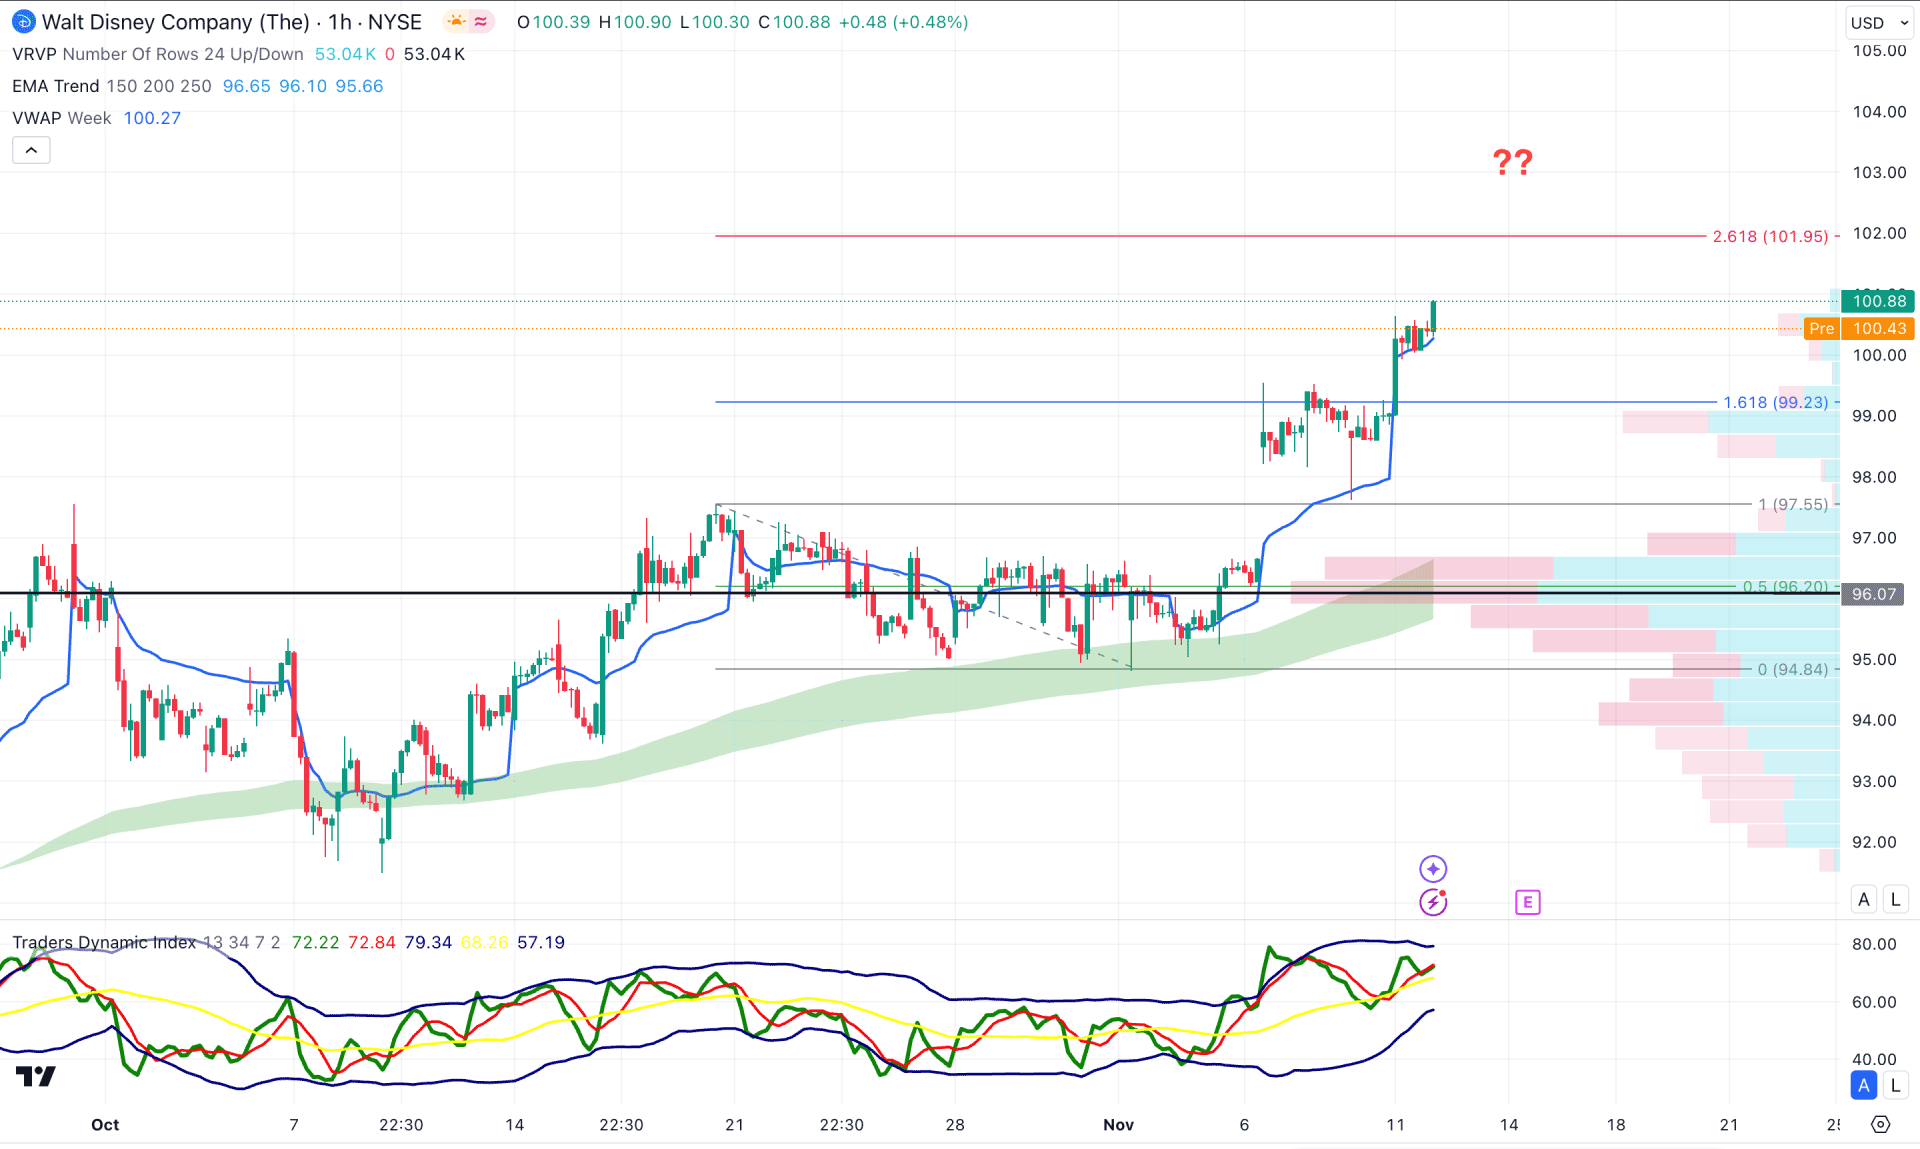
In the hourly time frame, the DIS is trading within a bullish pressure, supported by the rising Moving Average wave. Moreover, the visible range high volume line is below the current price and within the existing range. It is a sign of buyers' presence in the market from where more upside pressure might come.
In the indicator window, the Traders Dynamic Index (TDI) showed an upward pressure as the current level is hovering above the 50.00 neutral point.
Based on the current market outlook, a bullish continuation is possible, where the 261.8% Fibonacci Extension level from the existing swing is at the 101.95 level. However, a downside pressure from the EMA could be possible to provide another long opportunity in this stock.
On the bearish side, the first attempt might come after having a failure to overcome the 101.00 level. However, a bearish break below the 96.07 support line might lower the price towards the 90.00 area.
Based on the current market outlook, DIS is more likely to extend the buying pressure, where a valid bullish signal might come from the intraday price action. As the current momentum is overbought on the intraday chart, a sufficient downside correction is pending.