
Published: November 28th, 2023
Although it is the 100th year of business, Disney (DIS) faced challenges in 2023, leading to a decline in its stock.
However, the recent quarterly reports came as a bullish factor for this stock, lifting it from its nine-year low and initiating a positive momentum. Despite the recent selling pressure, convincing reasons exist to consider investing in this stock, particularly with the upcoming festive season likely to contribute to a prosperous December. The stock struggled with its streaming business. However, other factors, such as the potential multi-billion dollar deal with Reliance Industries, could significantly bolster streaming revenue.
The current anticipation for this company is to achieve profitability in the streaming segment by the end of the next year, with the possibility of adding 7 million core subscribers with an anticipated revenue of $5 billion. Besides, Disney's theme parks have demonstrated resilience and continue to be a reliable source of revenue.
In the latest quarter, Disney reported $21.24 billion in revenue with an EPS of 82 cents per share. The upcoming holiday season could catalyze the business, potentially increasing attendance at Disneyland and Disney World.
Considering the investment in cruise lines and theme parks over the next decade, Disney appeared to be a possibility for future growth. However, the upcoming price direction from the technical analysis could offer a better view of this stock.
Let’s see the future price direction of this stock from the DIS technical analysis:
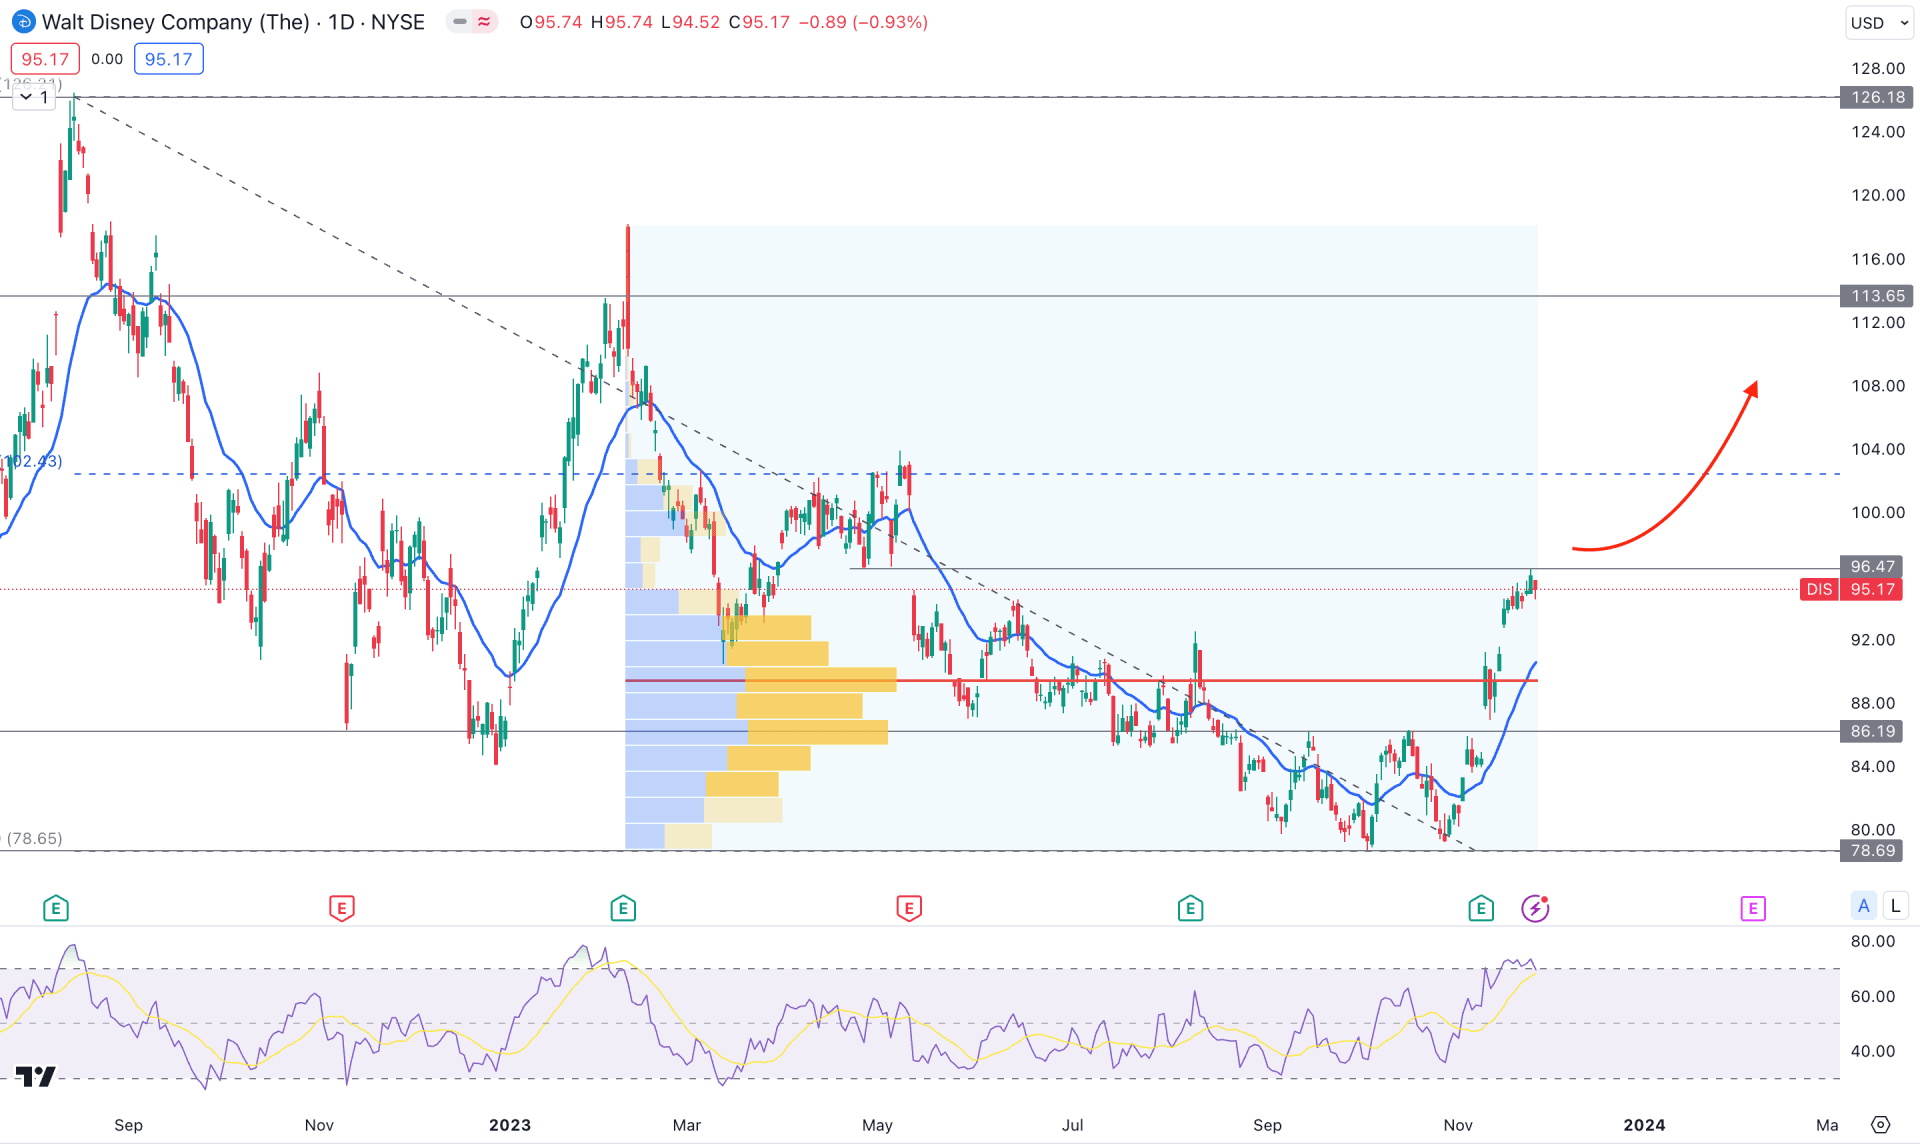
In the daily Disney (DIS) chart, a bullish reversal is active as the recent price formed a rectangle breakout with a volume injection. Moreover, the upcoming holiday session could work as a bullish confluence factor, extending the gain in the coming days.
In the higher timeframe, the monthly candlestick for November came bullish after two corrective months. If the November close can hold above the 94.00 level, we may consider it as a strong reversal signal. Moreover, the weekly price came as a descending channel breakout with several candles above the dynamic 20-week EMA. As the current price is 21% higher than the 78.69 bottom, investors might expect a bearish correction before another impulsive buying pressure.
In the volume structure, the most active level since August 2023 is at the 89.37 level, which is below the current price. Moreover, the dynamic 20 EMA shows an upward slope at the high volume area, which could work as an additional bullish factor for this stock.
In the indicator window, the 14-day RSI shows an overbought condition as the current reading is above the 70.00 line.
Based on the daily outlook of DIS, the first buying opportunity might come after a bullish break above the 100.00 psychological level. However, a downside correction is possible, which could provide another long opportunity from the 86.19 to 78.69 zone. In both cases, investors should find a valid bullish rejection candlestick before aiming for the 126.13 high.
On the bearish side, a struggle to break the 100.00 level could be the first sign of selling pressure. Moreover, a bearish daily candle below the dynamic 20 EMA could extend the loss towards the 78.00 area.
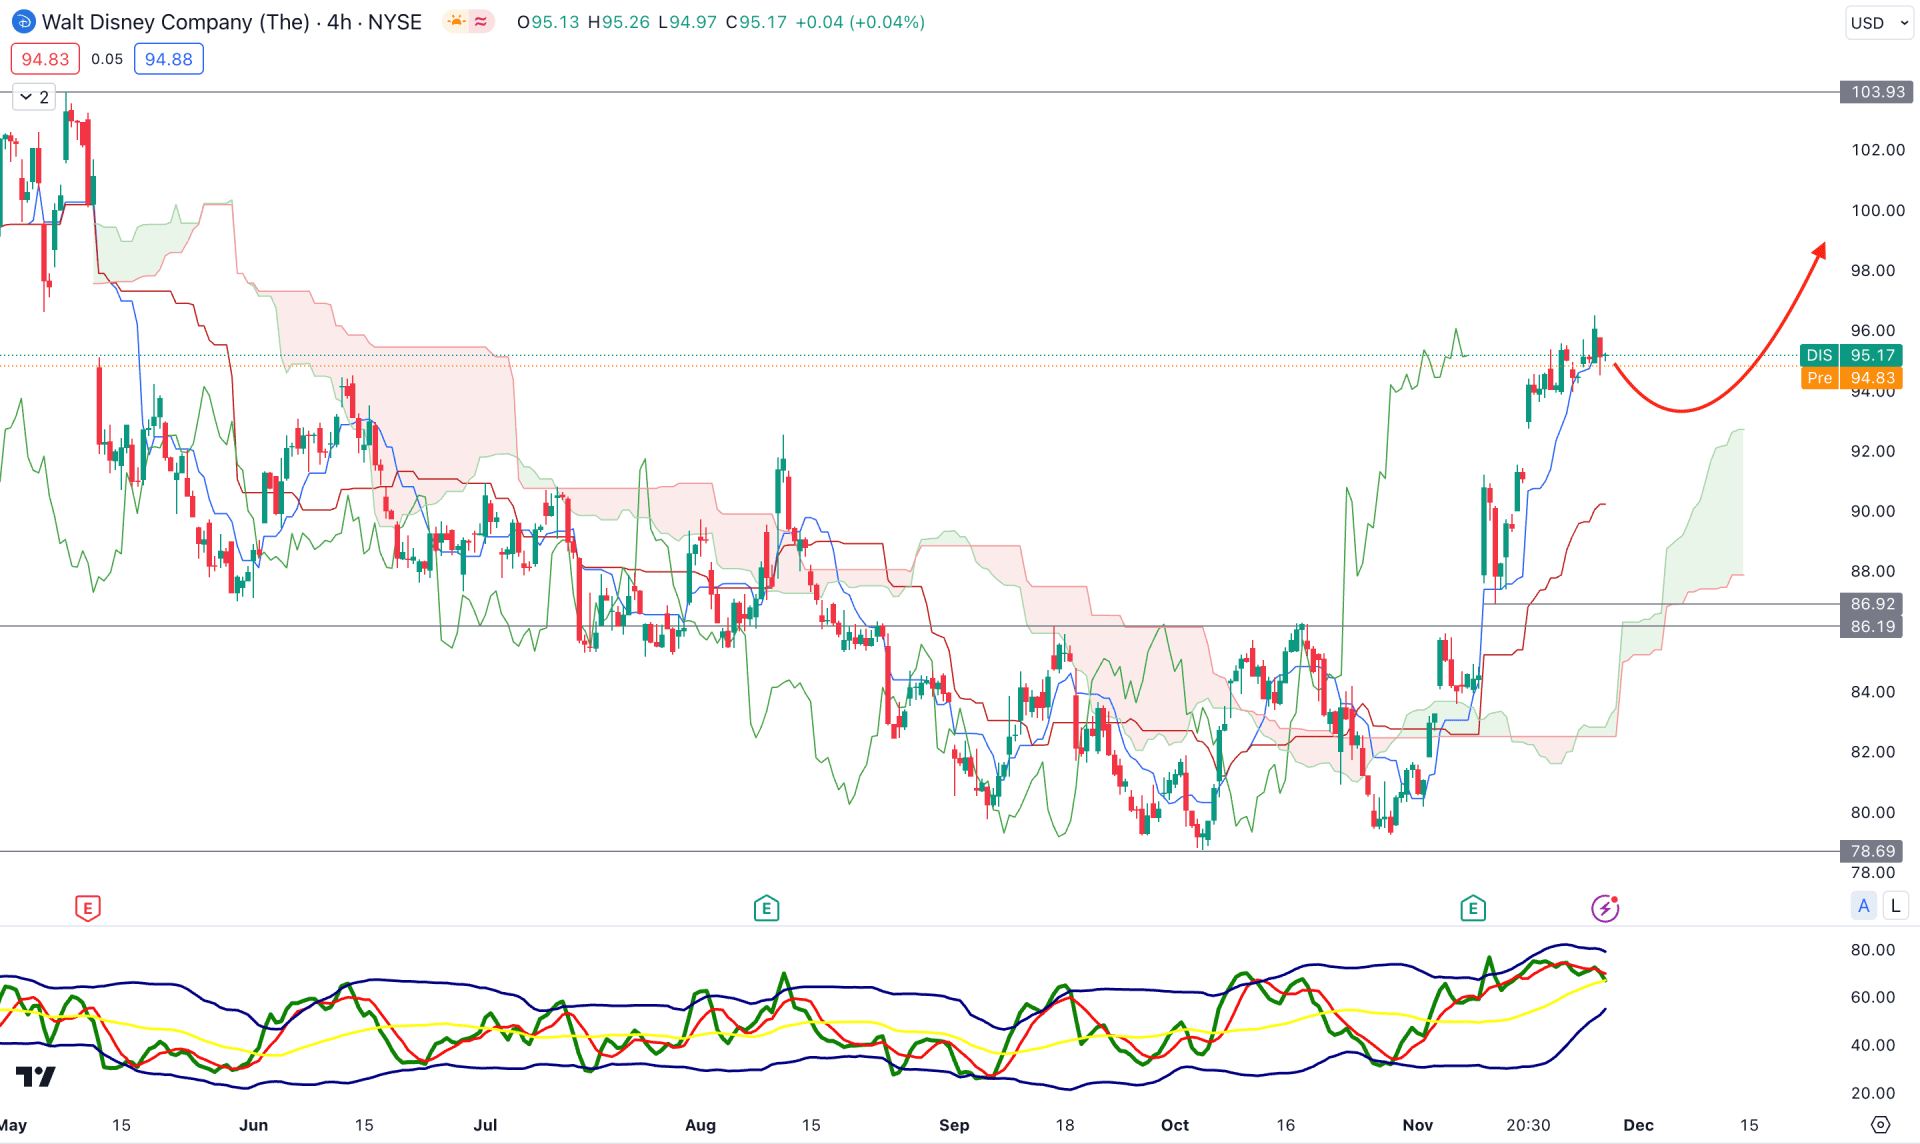
In the H4 timeframe, the broader market direction is bullish, supported by a bullish rectangle pattern breakout. As a result, impulsive buying pressure is visible above the Kumo Cloud, which is a primary signal of an upcoming trend continuation.
In the future cloud, the Senkou Span A is above the Senkou Span B, which supports the ongoing bullish pattern. Moreover, the Traders Dynamic Index (TDI) shows a corrective pressure but remains above the neutral 50.00 line.
Based on the H4 structure, the overall market direction is bullish, but the overextension from the rectangle breakout indicates a minor downside correction. Therefore, an additional bullish rejection from the dynamic Kijun Sen support could be a long opportunity, targeting the 103.93 level.
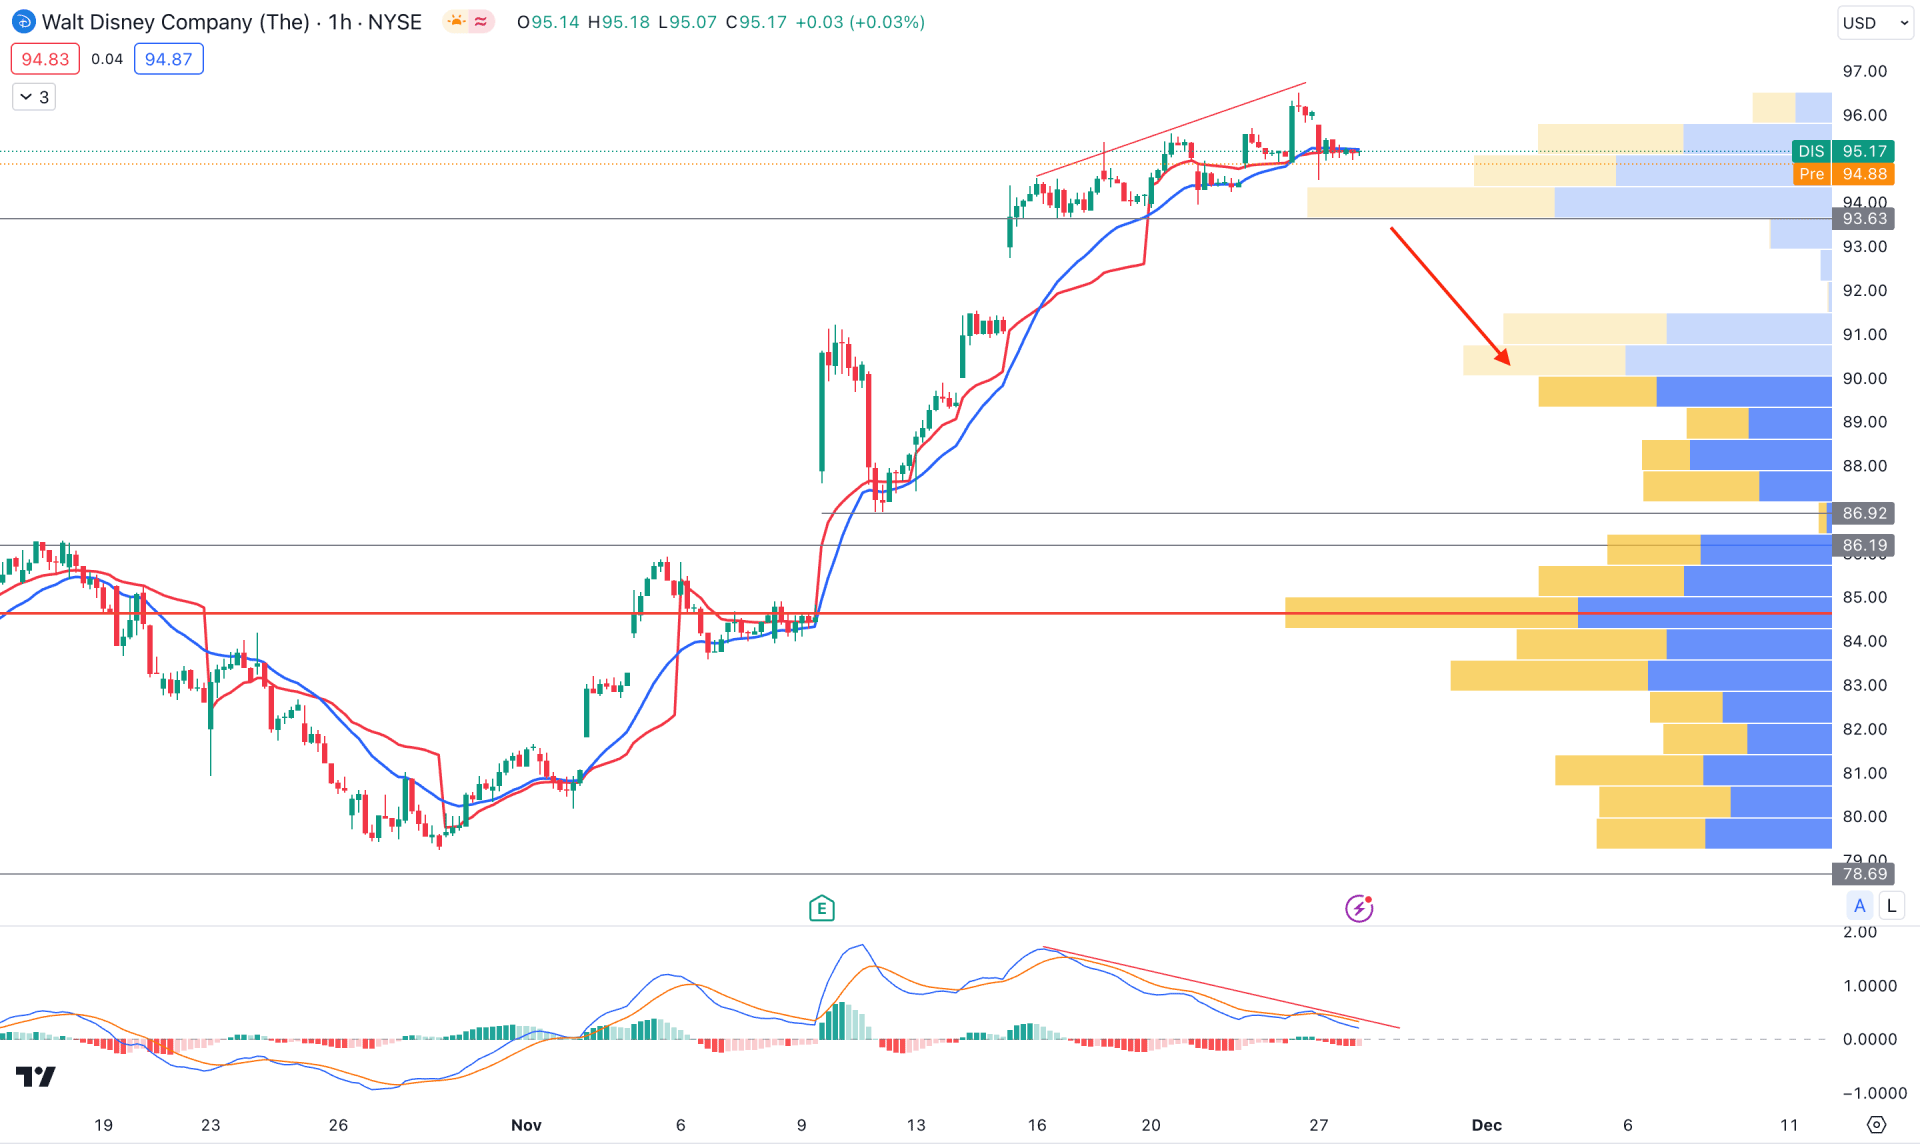
In the H1 timeframe, a closer view of the bullish trend is visible where the current price formed a divergence with the MACD Signal line. Moreover, the dynamic 20 EMA and weekly VWAP came closer to the near-term low, indicating buyers' market failure.
Based on the hourly Disney Stock (DIS) price prediction, a bearish hourly close below the 93.63 level static level could be a bearish opportunity. Therefore, the ongoing bullish outlook from the fundamental perspective could attract bulls to open a long position in this stock.
Based on the current price projection of Disney Stock (DIS), a bullish trend continuation is potent, where a recovery above the 100.00 level could indicate more buying pressure in this stock. On the other hand, the ongoing buying pressure might result in a reversal after forming sufficient selling pressure from the near-term resistance level.


