Published: January 4th, 2023
On March 8, 2021, Disney stocks per share reached a record high of 203.02 as hope for streaming was solid with a solid growth forecast from Wall Street, although Disney+ was in a loss.
However, inflation started, interest rates began to increase, and consumer spending declined as recession fears came into the fold. The Disney+ perception rotated to pessimism from optimism. The consequences of the higher operating expenses and declining profits are reflected in the dropping prices of Disney stocks.
The business structure of Disney relies on cycles. When the economy is growing, investors will hold their positions on these stocks for more losses and let them play out a growth opportunity.
If the economic situation keeps simultaneously collapsing with flowing losses, it's a one-two punch and an indication for Wall Street to dump the stock. For the fiscal year 2022, Disney’s park started to recover from the pandemic slowdown, and recession timing couldn’t be much worse.
As the current stock price of DIS is trading significantly lower than the 2021 peak, many investors believe that it would rebound in 2023.
Should you invest in Disney stock (DIS)? Let's see the future price outlook from the DIS technical analysis:
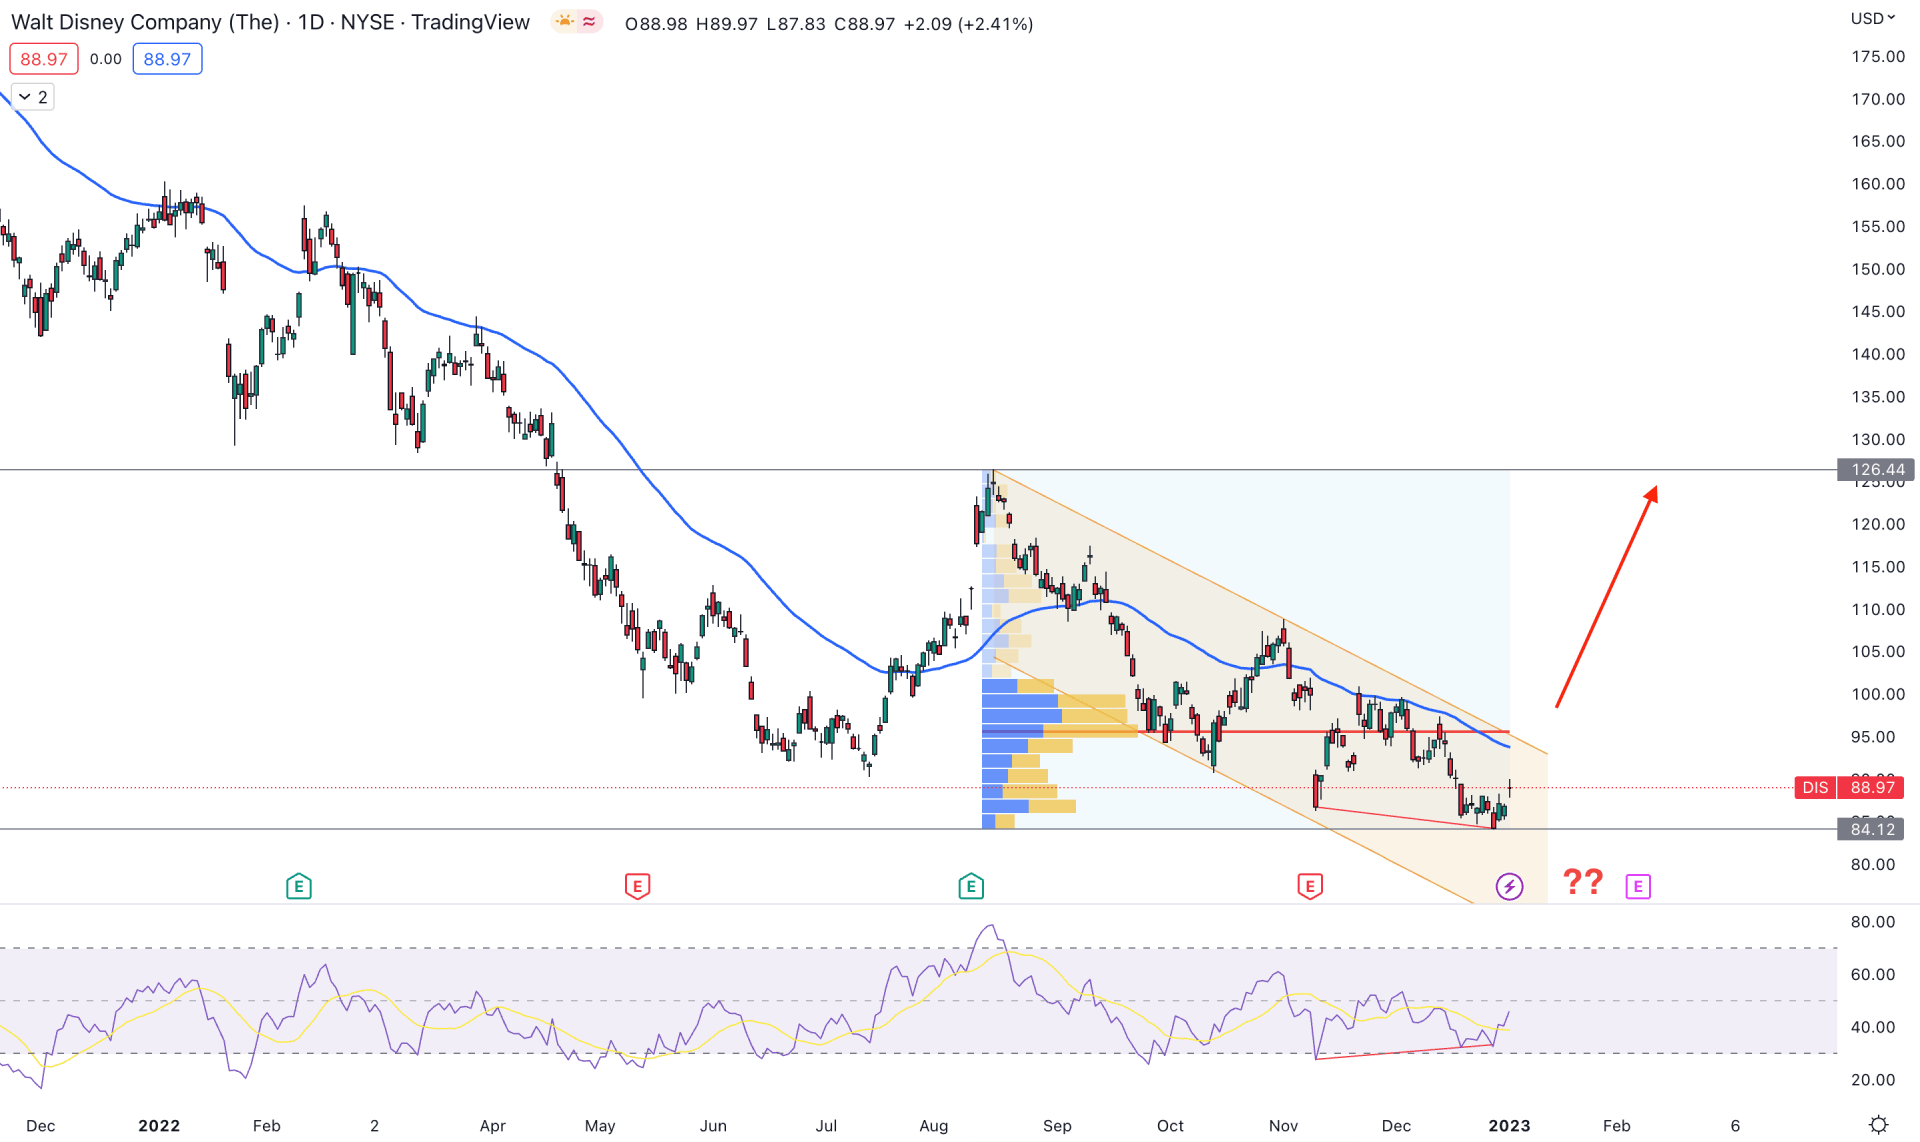
In the Disney stock (DIS) daily chart, the overall direction is bearish. It is true that the company passed a negative year where the stock closed 43% from the yearly opening. However, the business structure of Disney is cyclical, where the current dip could attract long-term bulls into the market.
The swing high of 126.44 level would be the top of the range from where the recent selling pressure came. However, on the downside, there is no bottom formed with a bullish Quasimodo. Therefore, the overall outlook for this stock is still bearish until the price goes above the 97.76 swing high.
The price action since August 2022 high is corrective within a descending channel, where the dynamic 20-day EMA is the immediate resistance. Therefore, a bullish breakout above the channel resistance is needed with the confluence support from 20 DMA.
A potential divergence is seen from the Relative Strength Index (RSI), where the new lower low of the price chart is ignored by that indicator. Moreover, the RSI showed a rebound from the oversold 30% area, which is the primary sign of buyers' presence in the market.
Based on the current daily price outlook of Disney stock, the bearish possibility is valid as long as the current price trades below the 95.58 high volume level. In that case, more downside pressure may come below the 80.00 area.
On the upside, a strong buying momentum with a channel breakout is needed before forming a daily candle above the dynamic 20 DMA. It would be a great opportunity for bulls, where the ultimate target is to test the 130.00 area.
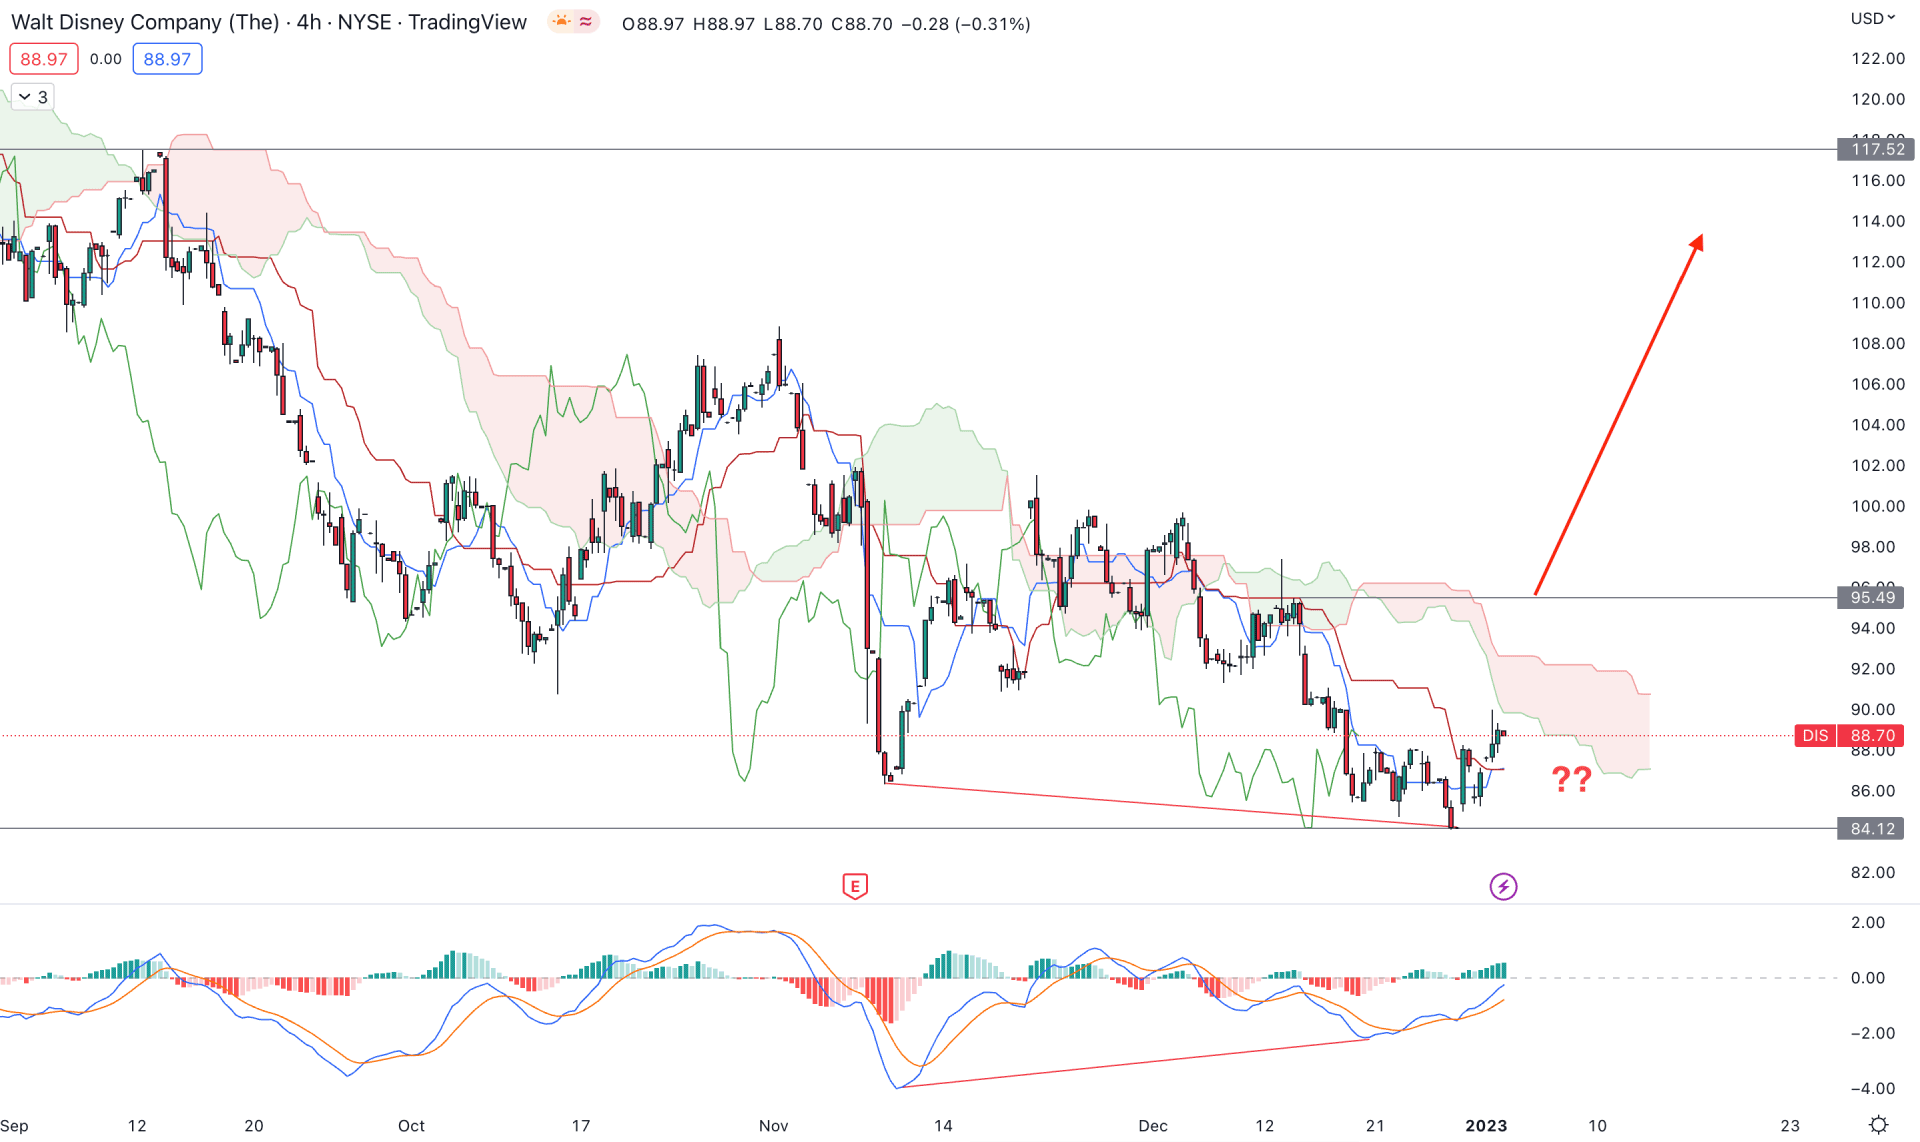
In the H4 timeframe, the weakness of sellers is visible in the DIS chart. The new swing low of 84.12 level is not supported by the MACD. Moreover, the price shifted above the dynamic Tenkan Sen and Kijun Sen with an H4 candle close.
In the future cloud, the broader outlook is still bearish as the Senkou Span B is above A. However, the corrective price action is justified by the Lagging Span, which is within the price.
Based on the H4 outlook, a potential bullish opportunity is available if there is a new H4 candle above the 95.49 swing high. On the other hand, the broader outlook is still bearish and any bearish rejection from the dynamic Kijun Sen could lower the price in the coming hours.
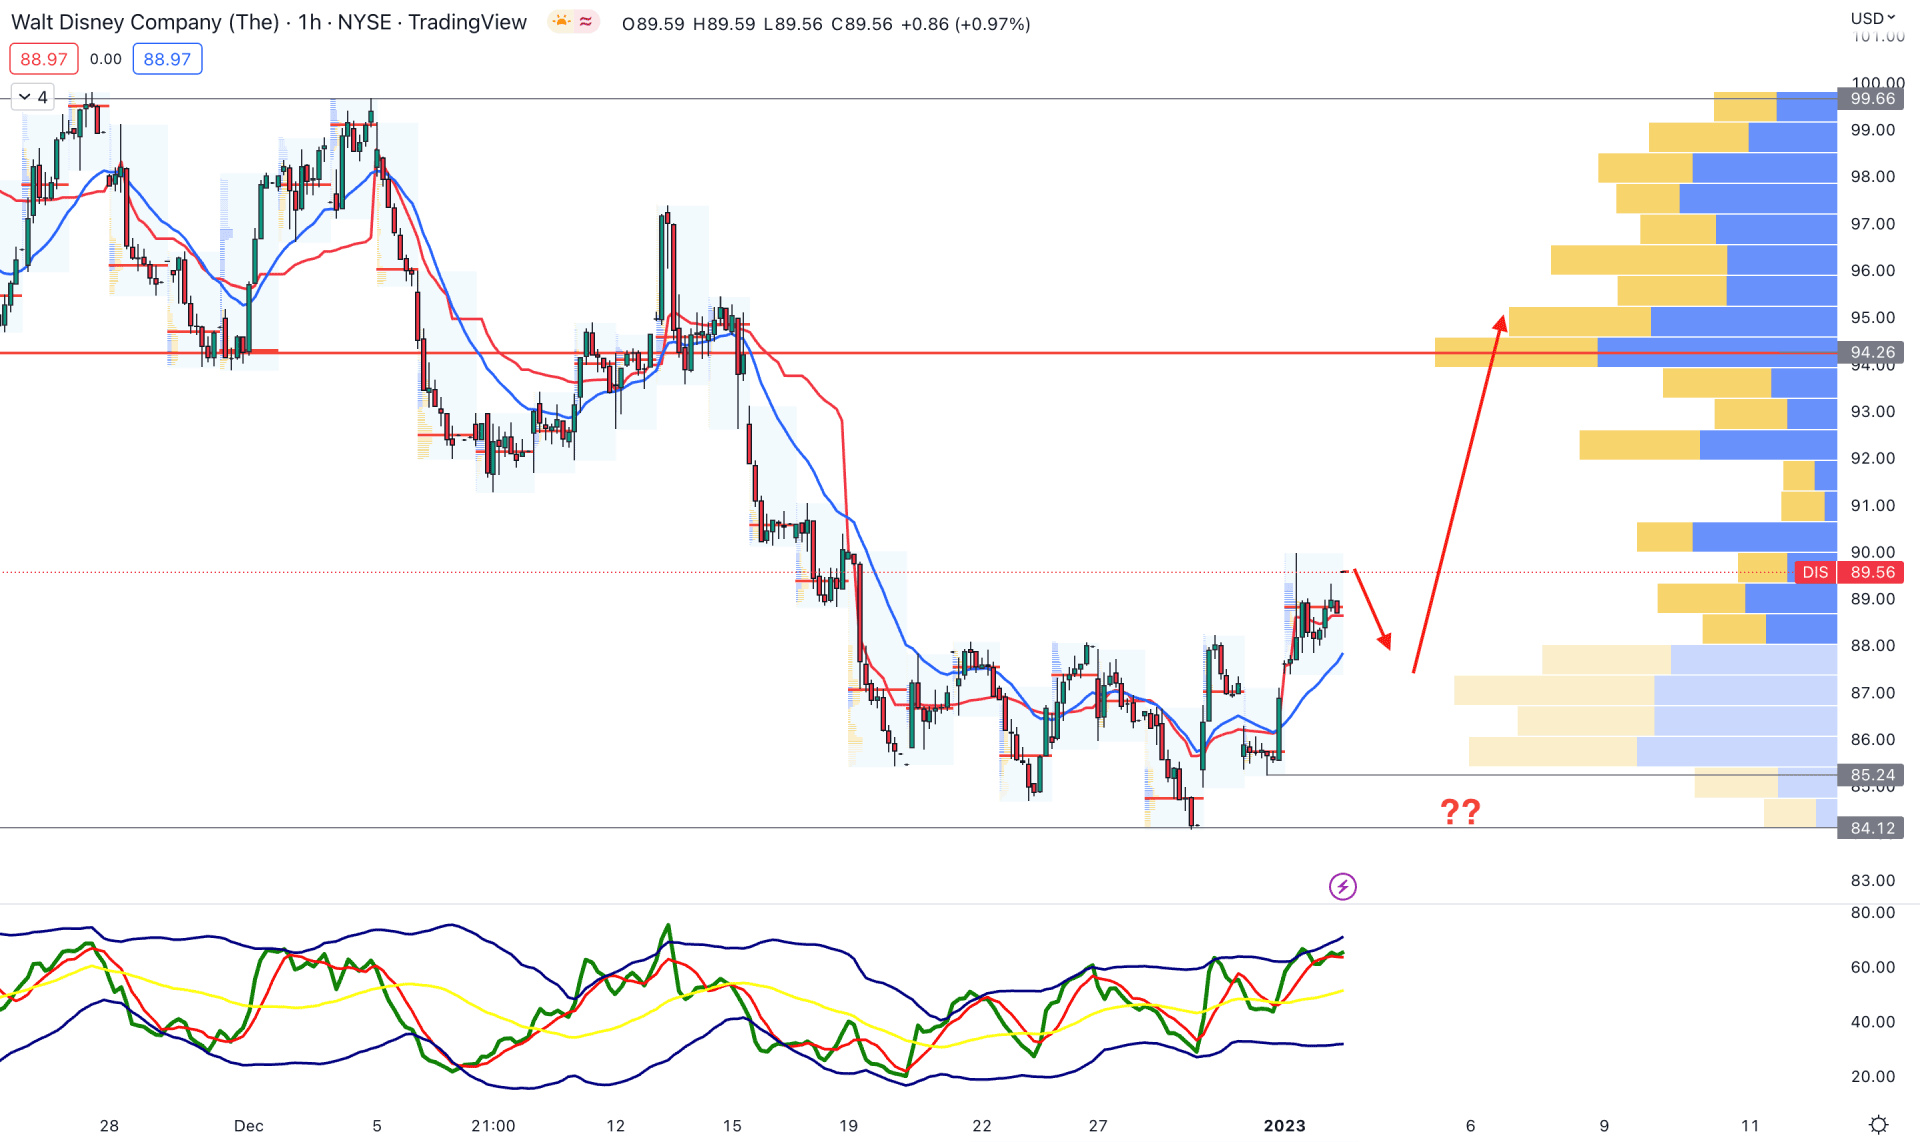
In the hourly chart, the recent price action showed a decent bullish momentum from the 84.12 bottom. The price made a new higher high and lower high, which is a sign that bulls have joined the market. However, the bullish possibility is solid only when we ignore the volume.
The visible range high volume level is above the price at 94.26 level. Therefore, the proper validation of the buying momentum needs a stable price above the high volume level. The 20 EMA and weekly VWAP are already below the price, while the TDI level on the indicator window reached the overbought zone.
Based on the H1 outlook, a stable price above the 94.50 level would open a conservative buying possibility in this instrument. However, any selling pressure with an H1 close below the 85.24 level could resume the current trend toward the 70.00 area.
As of the above discussion, Disney stock is not a buy yet but a proper channel breakout with a stable price above the 20 DMA could open a conservative buying opportunity. Investors should closely monitor the intraday price action to confirm the sellers’ failure before opening a long position.


