
Published: June 8th, 2023
In Q1 2023, DISH Network reported earnings of $0.35 per share, which is a decrease of 48.5% year-over-year. Revenues were down by 8.6% year-over-year to $3.96 billion, missing the consensus estimate of $4.03 billion.
The decline in earnings and revenues was driven by a number of factors, including:
Despite these challenges, DISH Network has some positive trends. For example, the company's ARPU (average revenue per user) for pay-TV increased by 3.3% year-over-year in Q1 2023. This suggests that DISH Network can still generate revenue from its existing subscribers, even as it loses subscribers.
Overall, DISH Network's Q1 2023 earnings report was mixed. The company's earnings and revenues declined, but it was able to offset some of these losses with an increase in ARPU. It will be interesting to see how DISH Network performs in the coming quarters.
Let’s see the upcoming price direction of this stock from the DISH technical analysis:
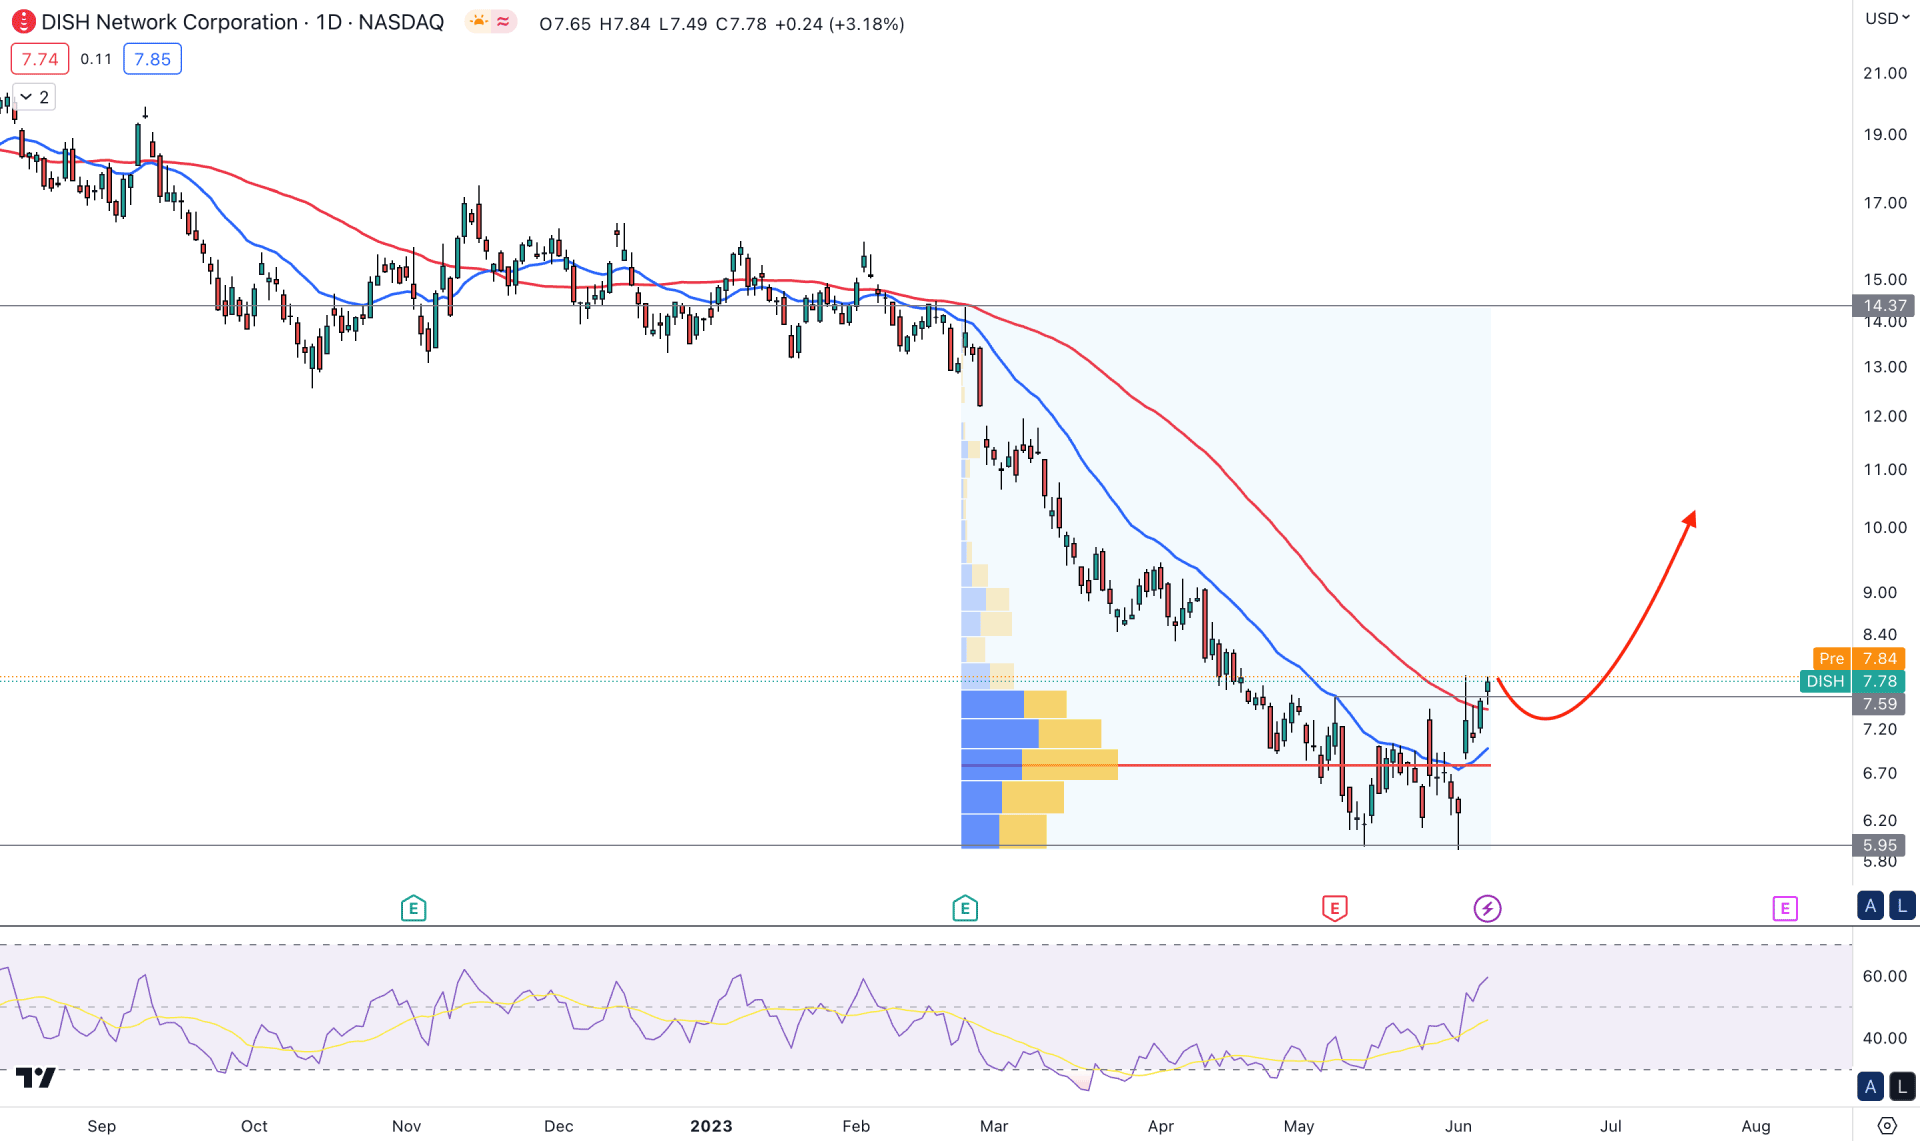
The DISH weekly chart shows that the latest price made consecutive bullish candles but failed to breach the 7.88 weekly resistance.
However, the current market outlook in the daily chart is promising for bulls, which may end up with a solid trend reversal in the coming days.
As per the daily market outlook, the recent price moved above the 50-day Simple Moving Average level with a D1 close, while the 20-day EMA is below the current price. It is an early sign of a bullish trend reversal, but investors should wait for further clues before opening a position.
The highest trading volume level since the 23 February high is at 6.80, which is working as static support with the dynamic 20-day EMA. As the current price is stable above the high volume level, we may expect the upcoming price direction to be bullish.
After a solid breakout, a retest is likely to happen, but for DISH, there might be an exception. Although the current price trades at the weekly resistance, the 14-day RSI is just above the 50.00 line. As the RSI has more room upside, we may expect that bulls have more room upside without a correction.
Based on this outlook, the bullish pressure in the DISH daily price is solid, but investors should wait for a bearish correction before opening a long position. The downside pressure may come towards the 6.78 high volume level, but breaking this zone could eliminate the structure.
On the bearish side, a daily price below the 6.70 level might make a new swing low in this instrument, towards the 5.00 area.
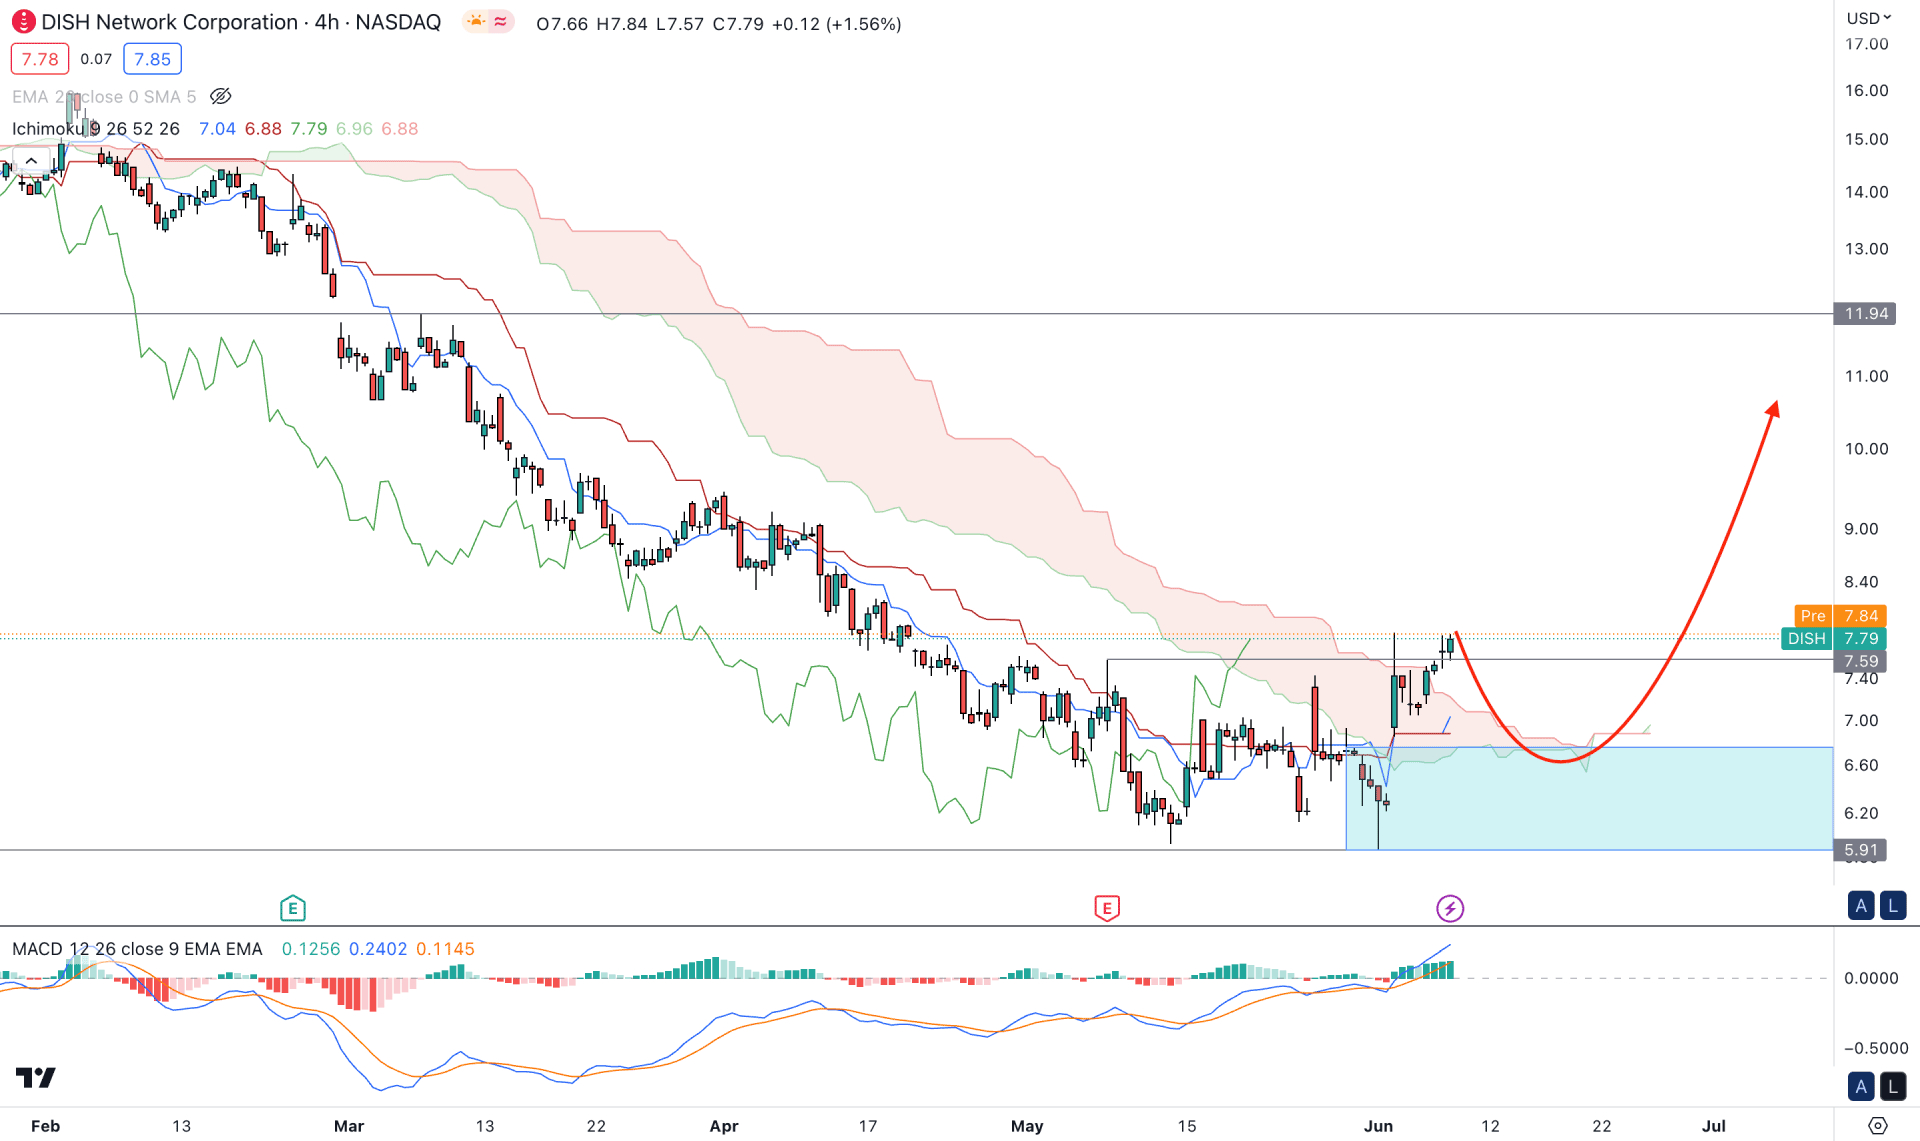
The early buying sign is shown in the Ichimoku Cloud, where the current price is trading above the cloud support. Moreover, the future cloud is not solid enough to consider a trend change.
The recent upside pressure left an inefficiency at the 6.76 to 5.91 area, from where any bullish rejection could signal a strong buy trade.
In the indicator window, the current MACD Histogram is bullish, while MACD lines are steadily upside.
Based on this structure, a new swing high formation above the 8.00 level would increase the possibility of a bullish trend continuation, targeting the 12.00 level.
On the downside, sell-side pressure may come, but breaking below the 5.91 level might alter the current market outlook at any time.
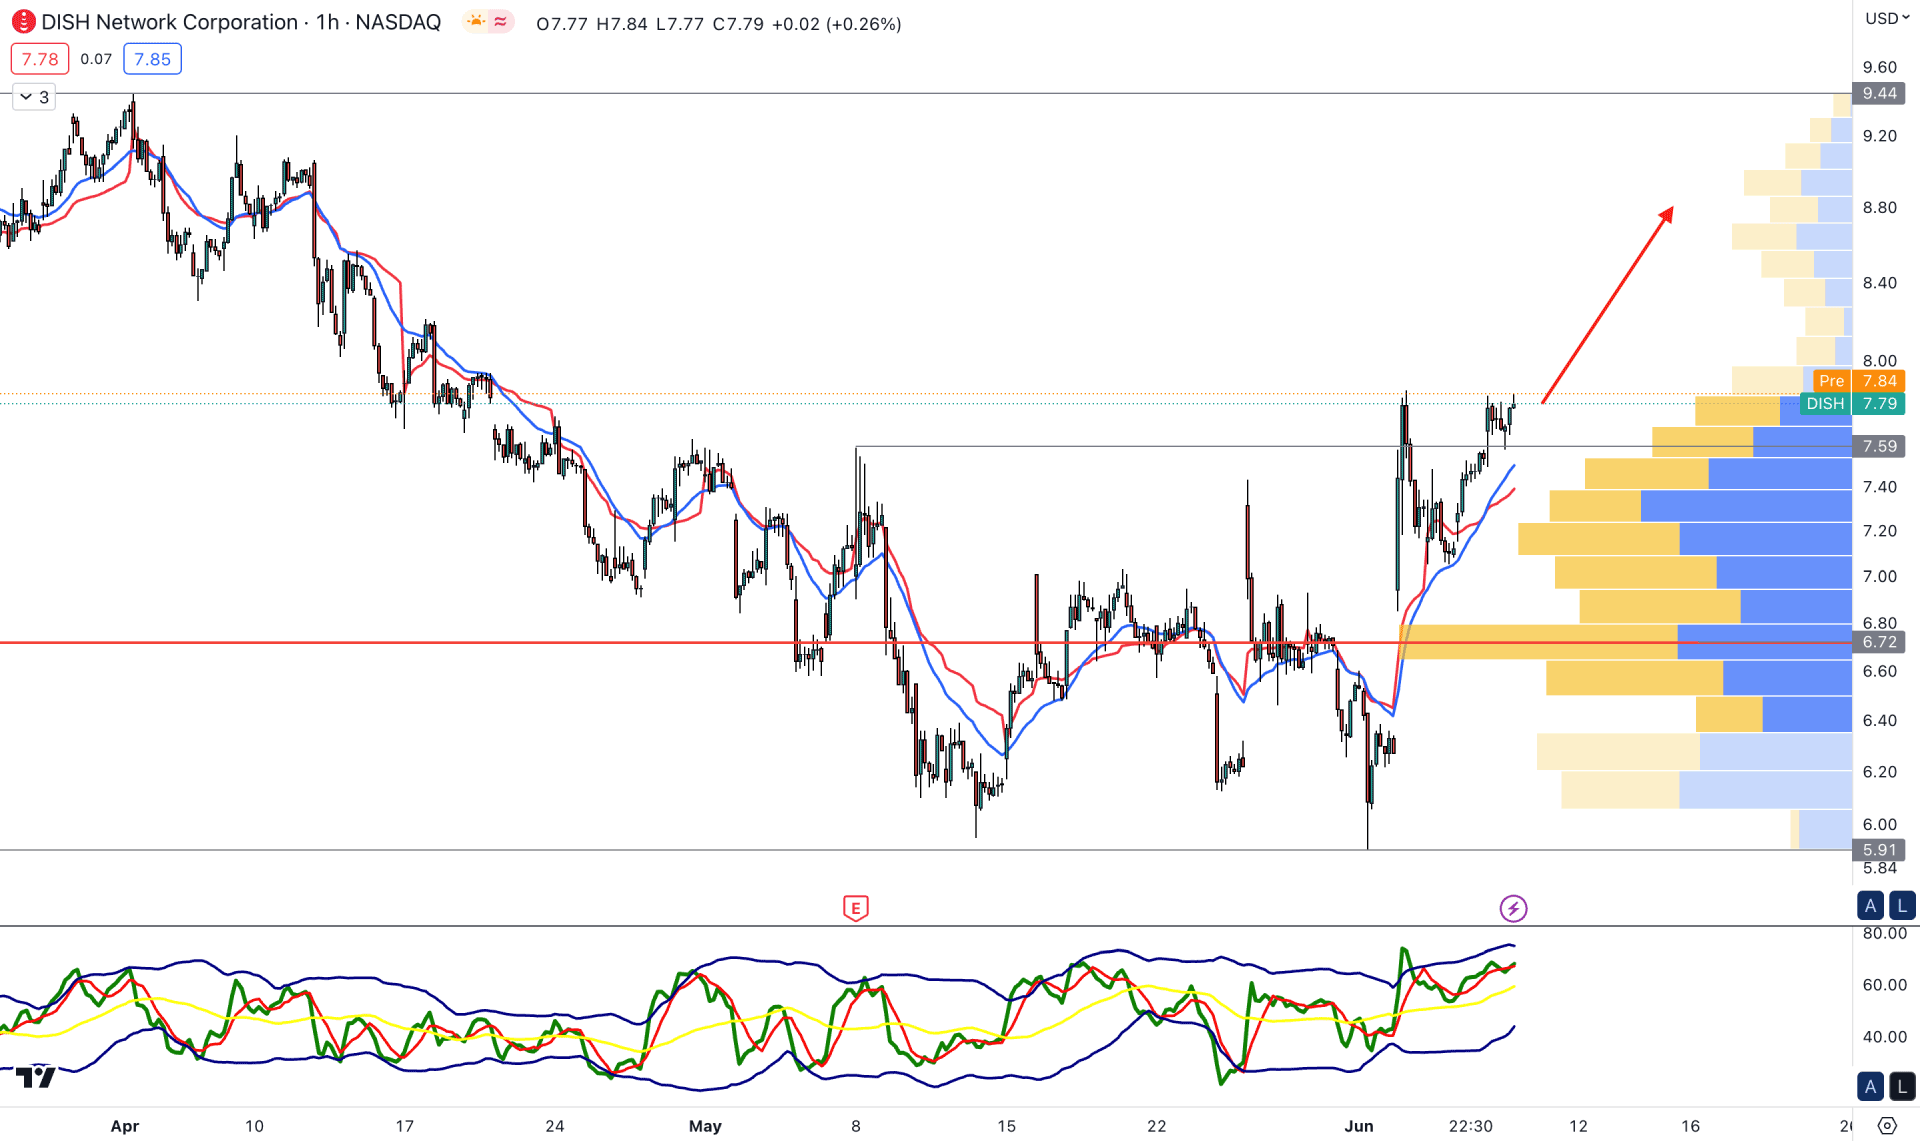
In the hourly chart, the broader market outlook is bullish, where the current price is above the visible range high volume level.
The dynamic 20 EMA and VWAP levels are below the current price, but the Traders Dynamic Index (TDI) shows an extreme buying position in the market.
In this context, the upside momentum is valid, but some minor downside corrections may happen. The ideal approach for this instrument is to look for long trades as long as it trades above the 6.72 high volume level.
A deeper correction may happen towards the 6.00 area, but breaking below the 5.90 level might alter the scenario.
Based on the current multi-timeframe analysis, DISH stock might provide a decent long opportunity from the lower price, but the early attempt might result in a false break. Therefore, investors should closely monitor lower timeframe price action to find any early buying opportunity.


