
Published: January 12th, 2023
Several hedge funds have recently changed opinions regarding how much DISH they own. US Bancorp DE bought 22.6% more shares of DISH Network during the first quarter of last year. After buying 584 more shares in the last quarter, US Bancorp DE now holds 3,166 shares of company stock worth $100,000.
Allspring Global Investments Holdings LLC bought 3.8% more DISH Network shares during the second quarter of 2022. After buying an extra 601 shares in the last quarter, Allspring Global Investments Holdings LLC now owns 16,347 shares of the company's stock, which are worth $293,000.
Under the DISH TV brand, it offers video services and programming packages, such as local broadcast networks, national and regional cable networks, regional and specialty sports channels, premium movie channels, Latino and international programming packages, and national and local broadcast networks.
As the business structure of this company is related to the consumers' needs, any sign of an eased inflation could initiate a bull run for this instrument.
Let’s see the future price direction of this instrument from DISH Network (DISH) technical analysis:
The 2022 performance of DISH is not satisfactory where the stock closed the year with a 59% loss and investors are not happy. However, the main price driver for the year was the consecutive rate hikes by the Fed to fight the higher inflation. Since December 2022 some lights have been seen and now there are several indications that the Fed could limit the rate hike in 2023.
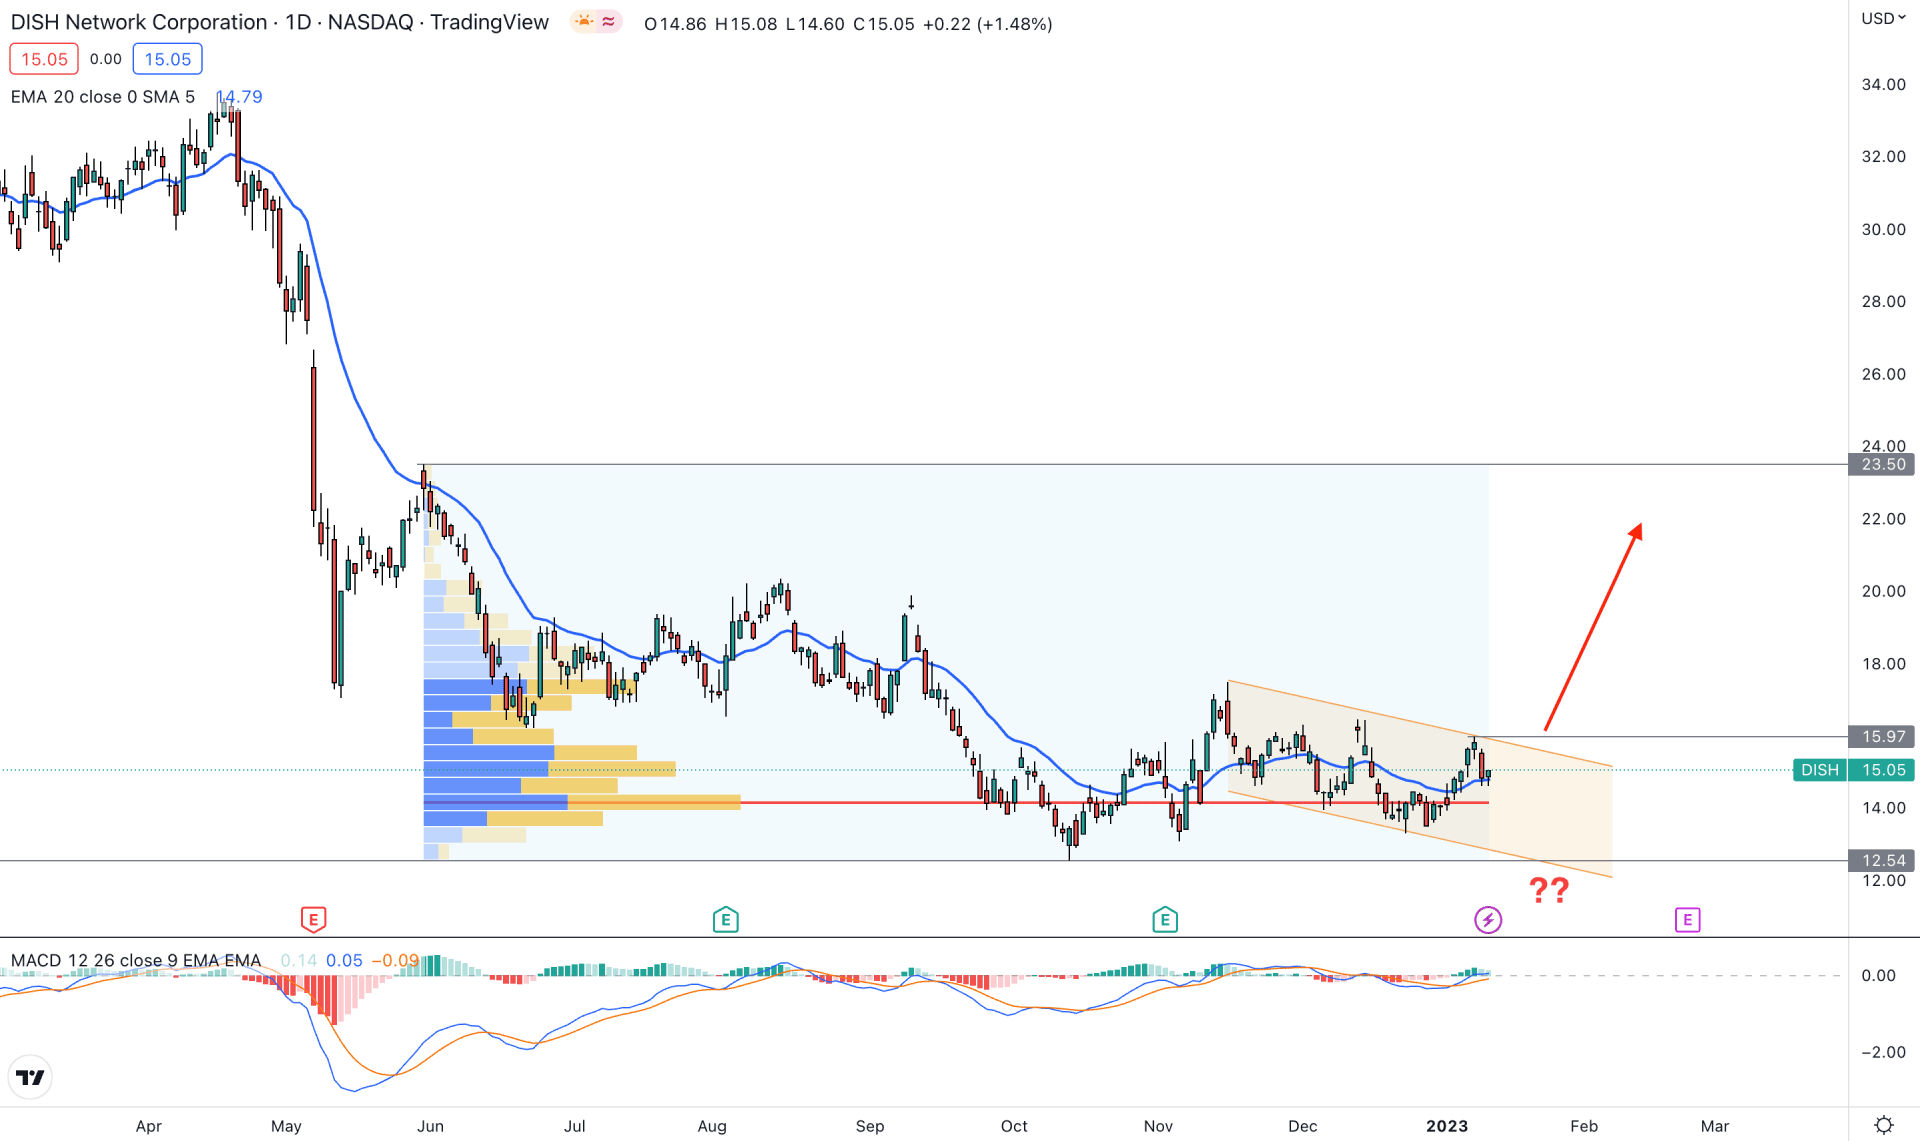
Buying a stock needs a deep understanding of the tradable range, which comes with a strong liquidity grab. In DISH daily price, we can consider the 33.74 level as the top and the 12.54 level as the bottom of the tradable range. As the current price already showed a buy-side liquidity grab and trading at the discounted level, any buying opportunity from a technical breakout could offer an investment opportunity.
The price showed a bullish impulsive pressure from the 12.54 swing low and made a higher high at the 17.48 level. Later on, a corrective price action appeared, which is still present in the market.
In the main chart, the dynamic 20-day exponential moving average is below the current price whereas the MACD histogram is above the neutral line. It is a sign that bulls are in control even if the price is trading within a descending channel.
The buying possibility in this instrument is valid if bulls made a break out above the channel resistance. A daily close above the 16.00 level could offer a conservative buying approach where the primary target level would be the 23.50 resistance level.
The bullish possibility is potent only if there is a breakout. The alternative approach is to wait for the price to come below the 12.54 level to consider the bearish possibility as potent toward the 10.00 area.
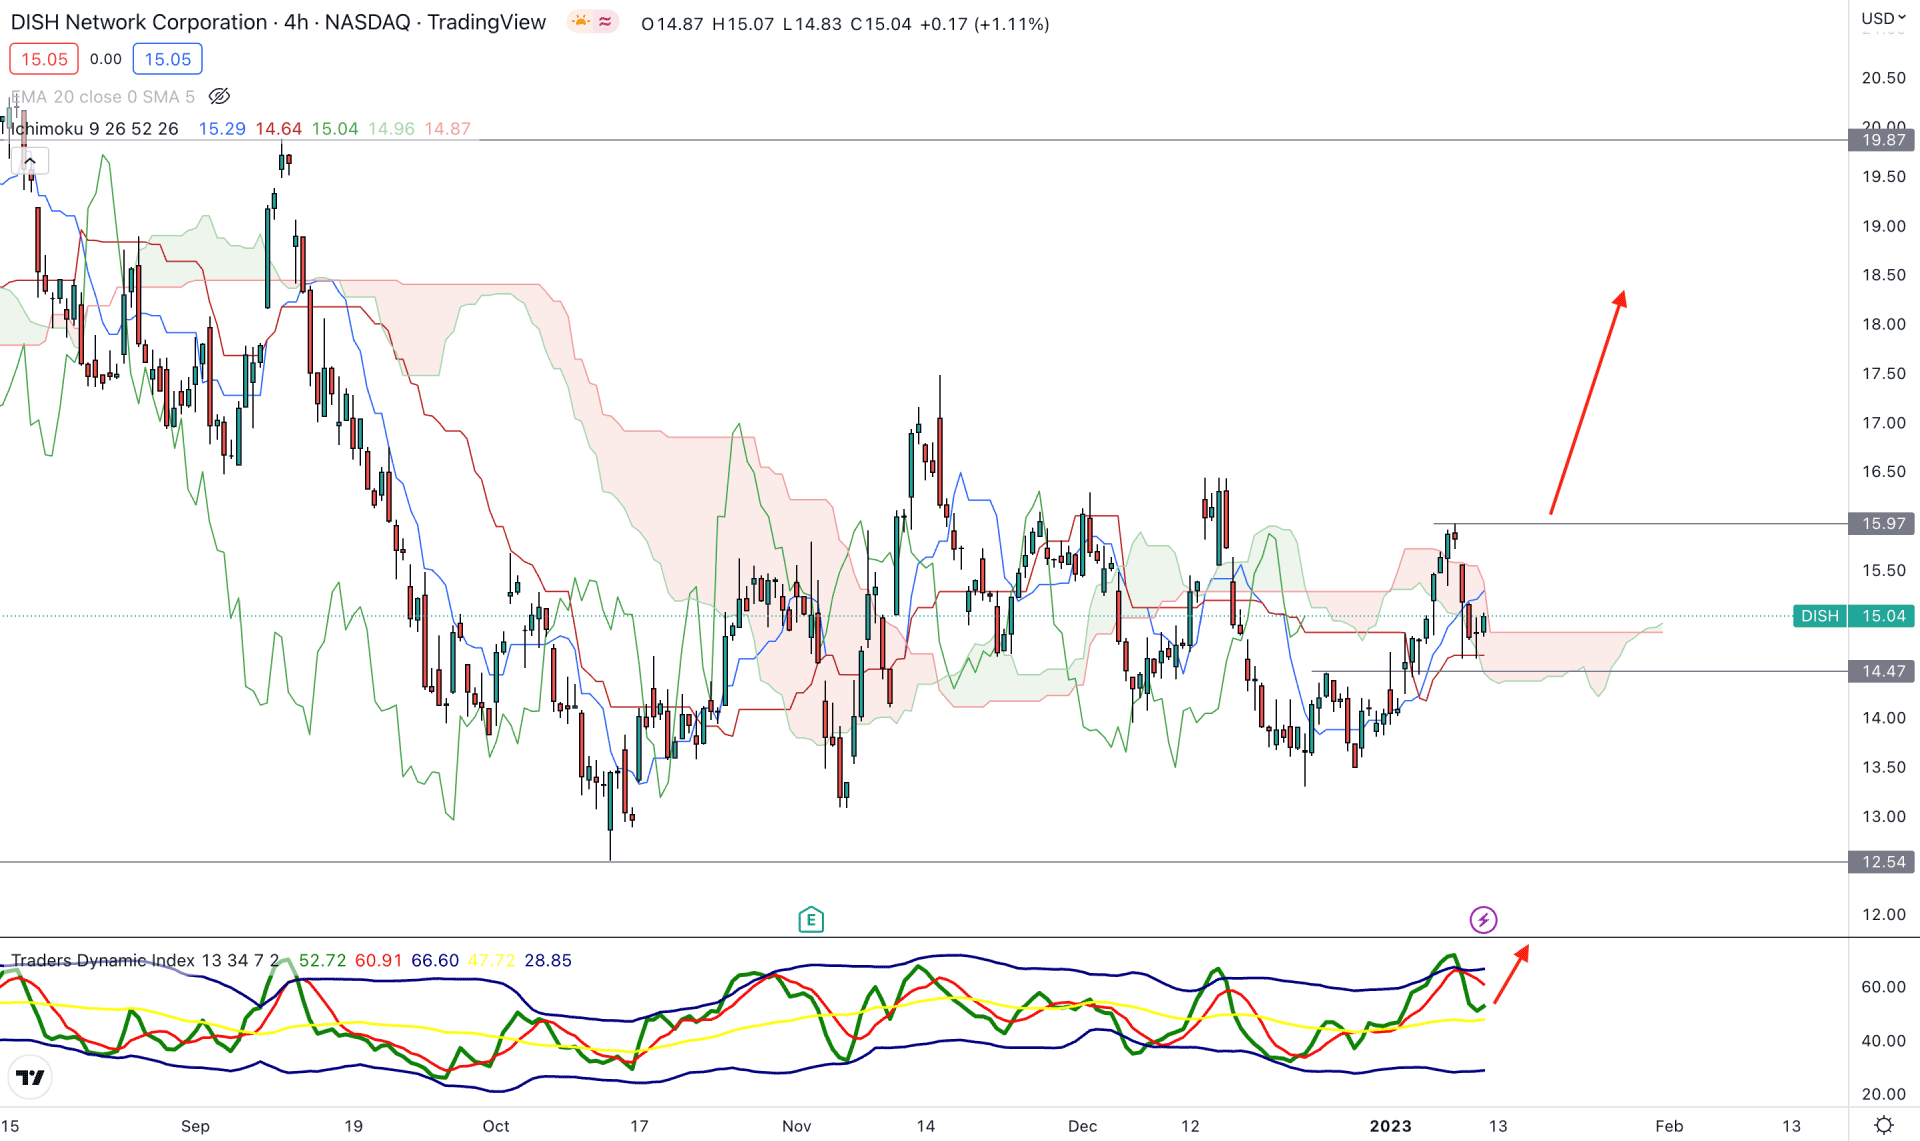
In the H4 timeframe, the future Ichimoku CLoud shows a potential bullish opportunity as there is a bullish crossover among Senkou Span A and B. It is a sign that bulls are building orders and the price can increase at any time.
In the indicator window, the Traders Dynamic Index made a higher high even if the price made a higher low at the 15.97 level. Moreover, the price has spiked three times from Cloud support since 14 November 2022.
As per the current context, the 15.97 to 14.47 area needs to be monitored, where a bullish break from this zone could offer a high probable buy signal.
The alternative approach is to wait for the price to come below the 13.50 level before considering the buying possibility as invalid.
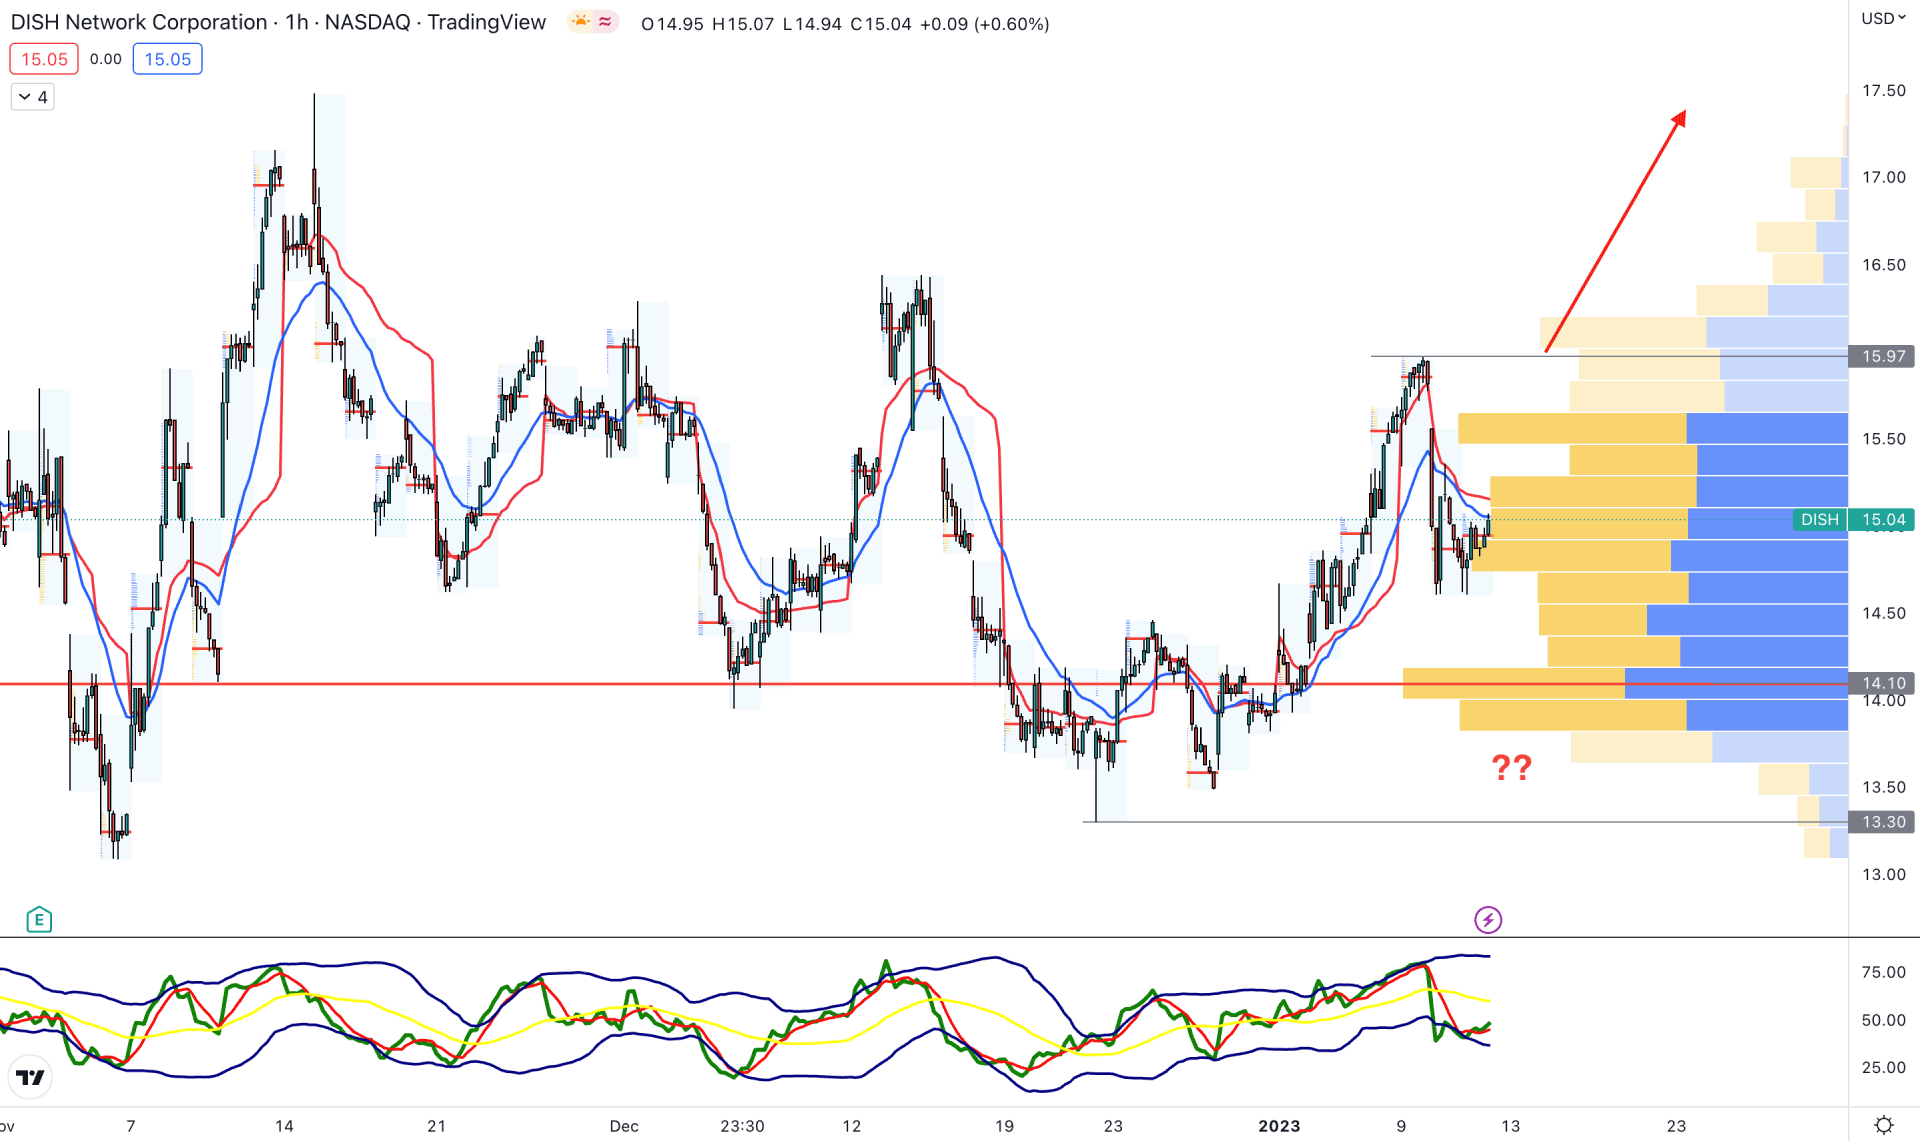
In the hourly chart, the price is trading within a bearish correction where the visible range high volume level is working as strong support.
The dynamic 20 EMA and weekly VWAP are above the price, working as a resistance, which is a sign of corrective price action.
In this situation, a bullish recovery above the dynamic 20 EMA area with an H1 candle above the 16.00 level could validate the bullish signal, targeting the 17.50 level. Another buying opportunity is valid from the 14.10 high volume area but breaking below the 13.30 level could make the current setup invalid.
Based on the current price outlook, DISH investors should wait for a valid breakout from the channel resistance before opening any long position. On the other hand, any bearish rejection from the channel resistance could extend the correction in the coming days.


