
Published: August 22nd, 2023
Diamond Offshore Drilling (DO) is making notable advancements on the stock market, increasing its stock price by more than 50 percent in 2023.
During the second quarter of 2023, Diamond Offshore reported a significant 37% increase in revenue, which amounted to $281.56 million, which indicates an impressive figure. In addition, the company's earnings per share soared from a loss of 22 cents to an impressive $2.29.
Diamond Offshore anticipates a substantial 13% increase in revenue for the entire fiscal year, within the range of $950 million to $960 million. This increase is primarily attributable to rising energy prices.
Due to the current robust crude oil prices, oil-based equities have demonstrated remarkable resilience despite a market correction. Diamond Offshore Drilling is reaping the benefits of rising profits, a growing backlog, and robust energy industry demand. The company is optimally positioned for growth in the coming months, as evidenced by its optimistic financial outlook and strong stock performance.
Let’s see the upcoming price direction of Diamond Offshore Drilling stock from the DO technical analysis:
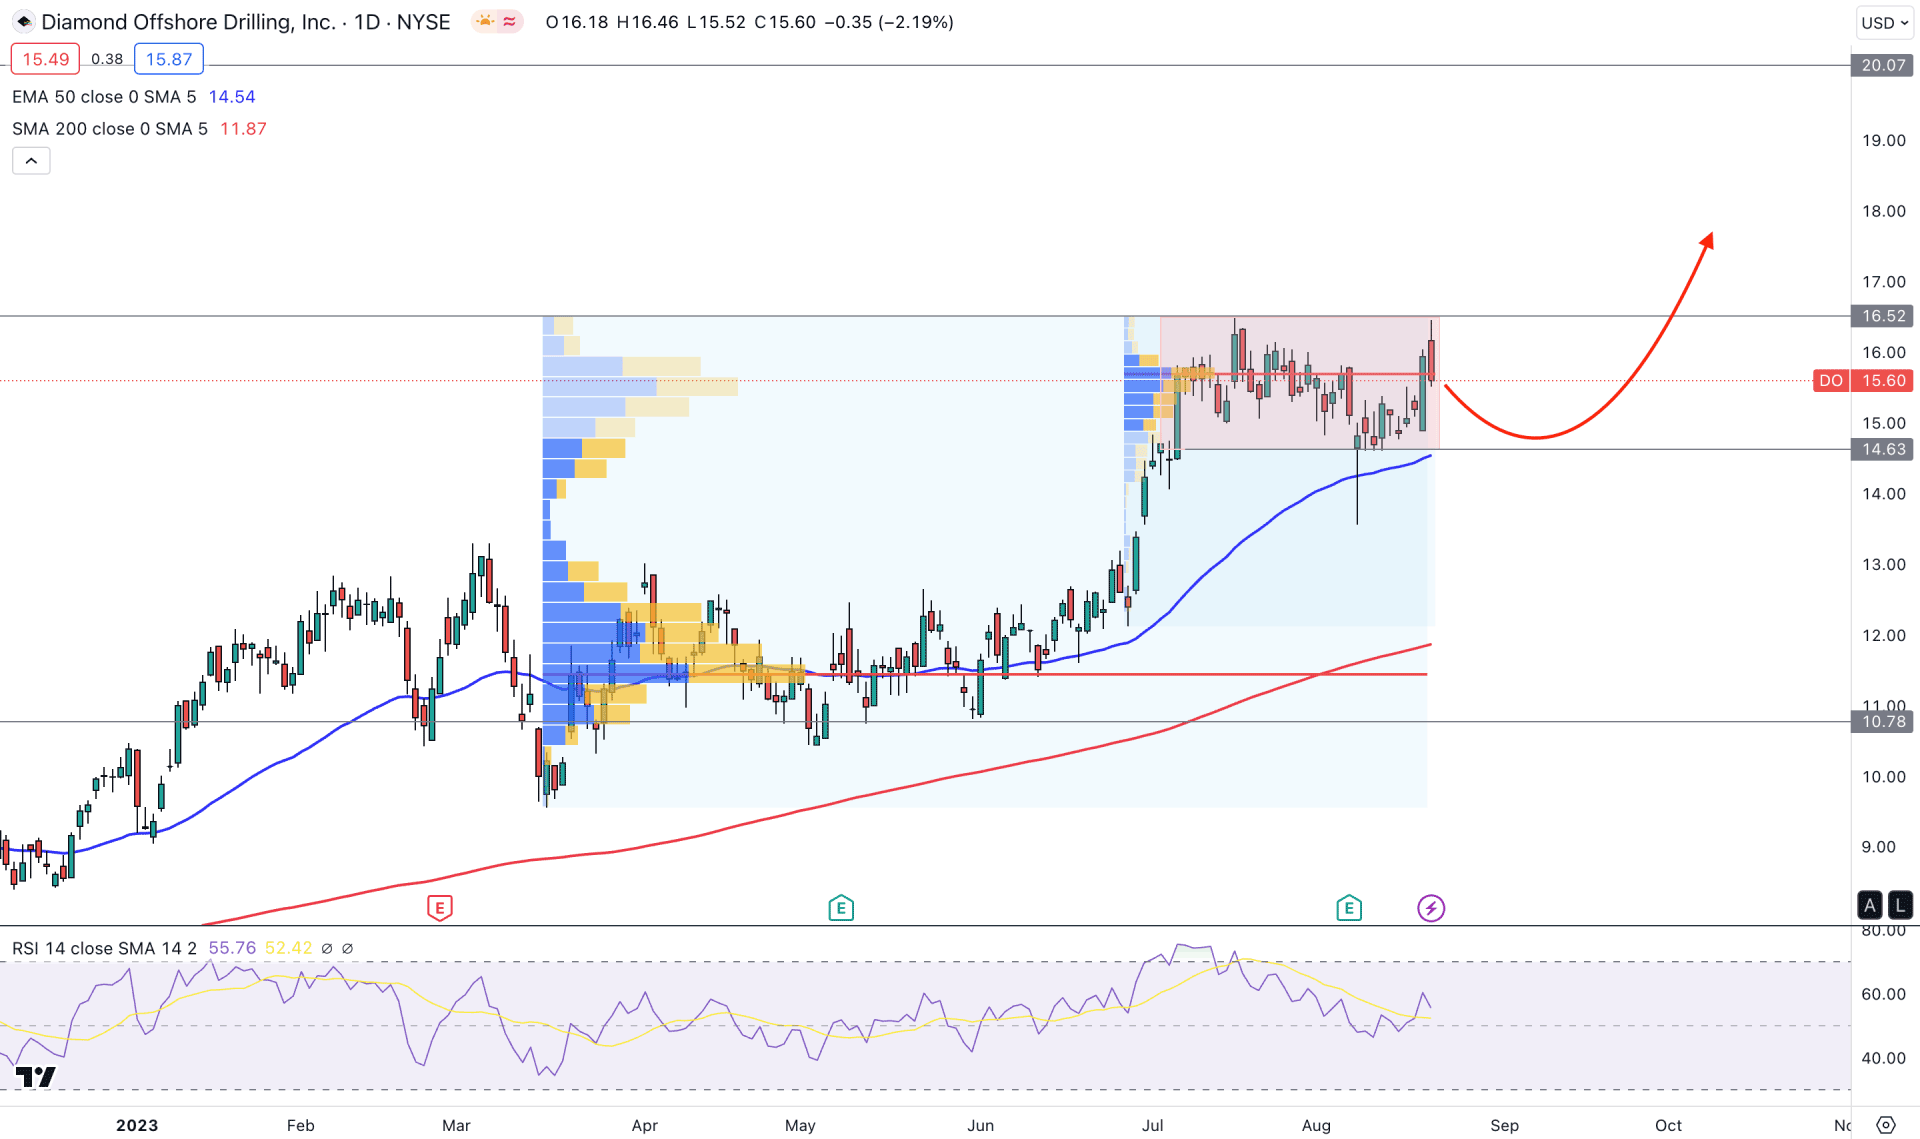
The overall momentum in the daily price of DO is bullish as the price is steadily pushing up, supported by the 200-day Moving Average. As a result, the primary aim of this instrument is to look for long trades only until there is a significant downward pressure below the 200-day SMA.
In the higher timeframe price action, the overall structure is bullish, whereas the current weekly candle is trading as a bullish inside bar formation, supported by bullish exhaustion. The recent monthly candles are still bullish, suggesting an upward continuation opportunity.
Looking at the volume structure, there are two significant areas to look at. As per the high volume level indicator, the most active level since 28 July is at 15.69, just above the current price. Moreover, another high volume level since March is spotted at 11.42, which is 26% below the current price. As these volumes support buying pressure, any bullish price action in the daily chart could resume the trend.
In the daily price, the current market trades sideways within a rectangle pattern, where the dynamic 50-day EMA is immediate support. Also, there is a bullish rejection from the 20 EMA, which indicates a sell-side liquidity sweep. The current 14-period RSI also supports the buying pressure, where the current level is above the 50.00 level.
Based on the daily price outlook, the overall market momentum in the DO price is bullish. The current 50 EMA carry already indicates a pre-breakout structure from the rectangle pattern. Therefore, the conservative buying approach would be to wait for the rectangle breakout, before aiming for the 20.00 psychological level.
On the other hand, the buying approach would be invalid if the price comes below the 12.00 psychological level, which may lower the price in the coming days.
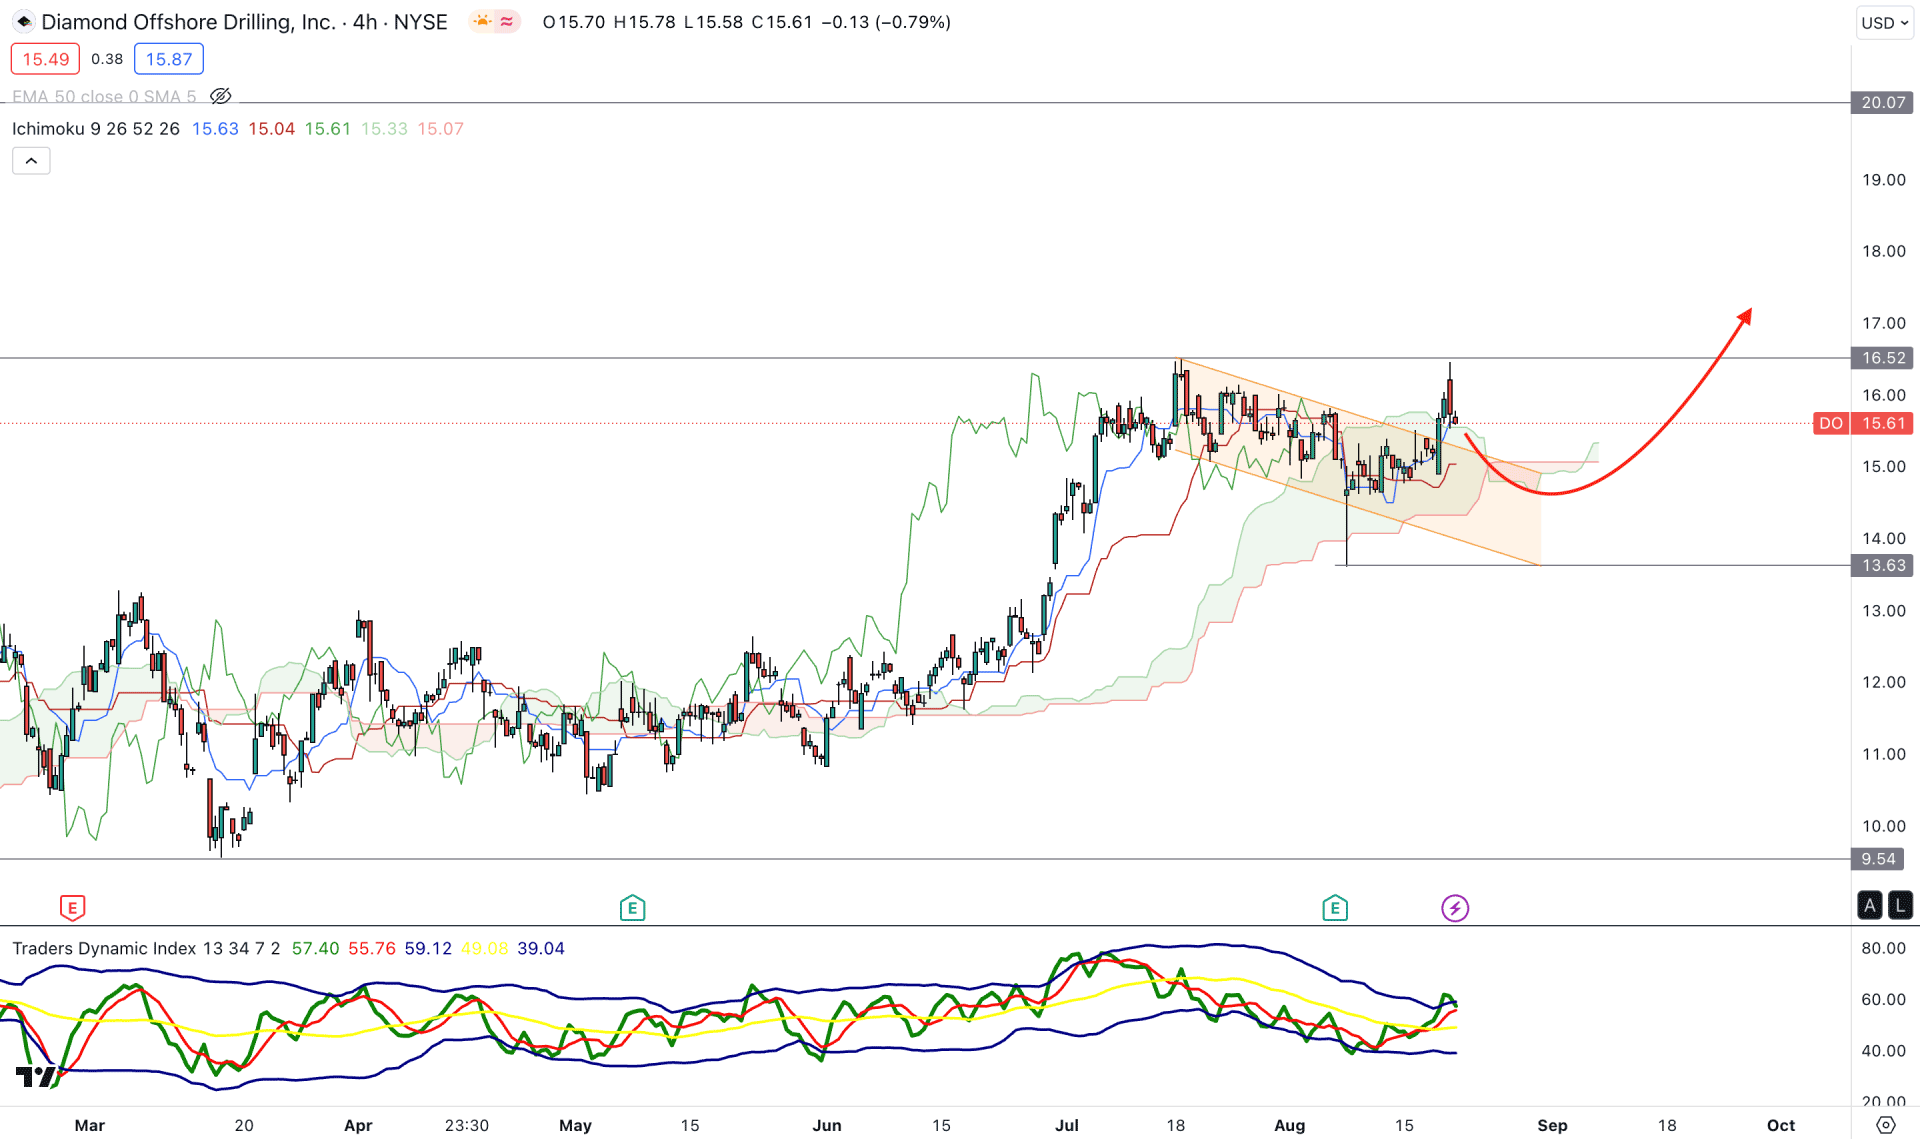
In the intraday chart, the current price is trading above the Ichimoku Kumo Cloud support, while the future cloud is bullish. In that case, any buying pressure from the intraday dynamic support could be a potential long opportunity in this instrument.
In the indicator window, the current Traders Dynamic Index (TDI) shows extreme buying pressure as it reaches the overbought zone. It is a sign that bulls have peaked and a downside correction is pending. Moreover, the recent price shows a bullish break from the descending channel, which needs a retest before showing further price direction.
Based on the H4 price action, any bullish rejection from the dynamic Kijun Sen or 15.00 to 13.00 zone would be a valid long opportunity, targeting the 20.00 level. However, breaking below the 13.00 level with a bearish H4 candle could lower the price toward the 9.54 support level.
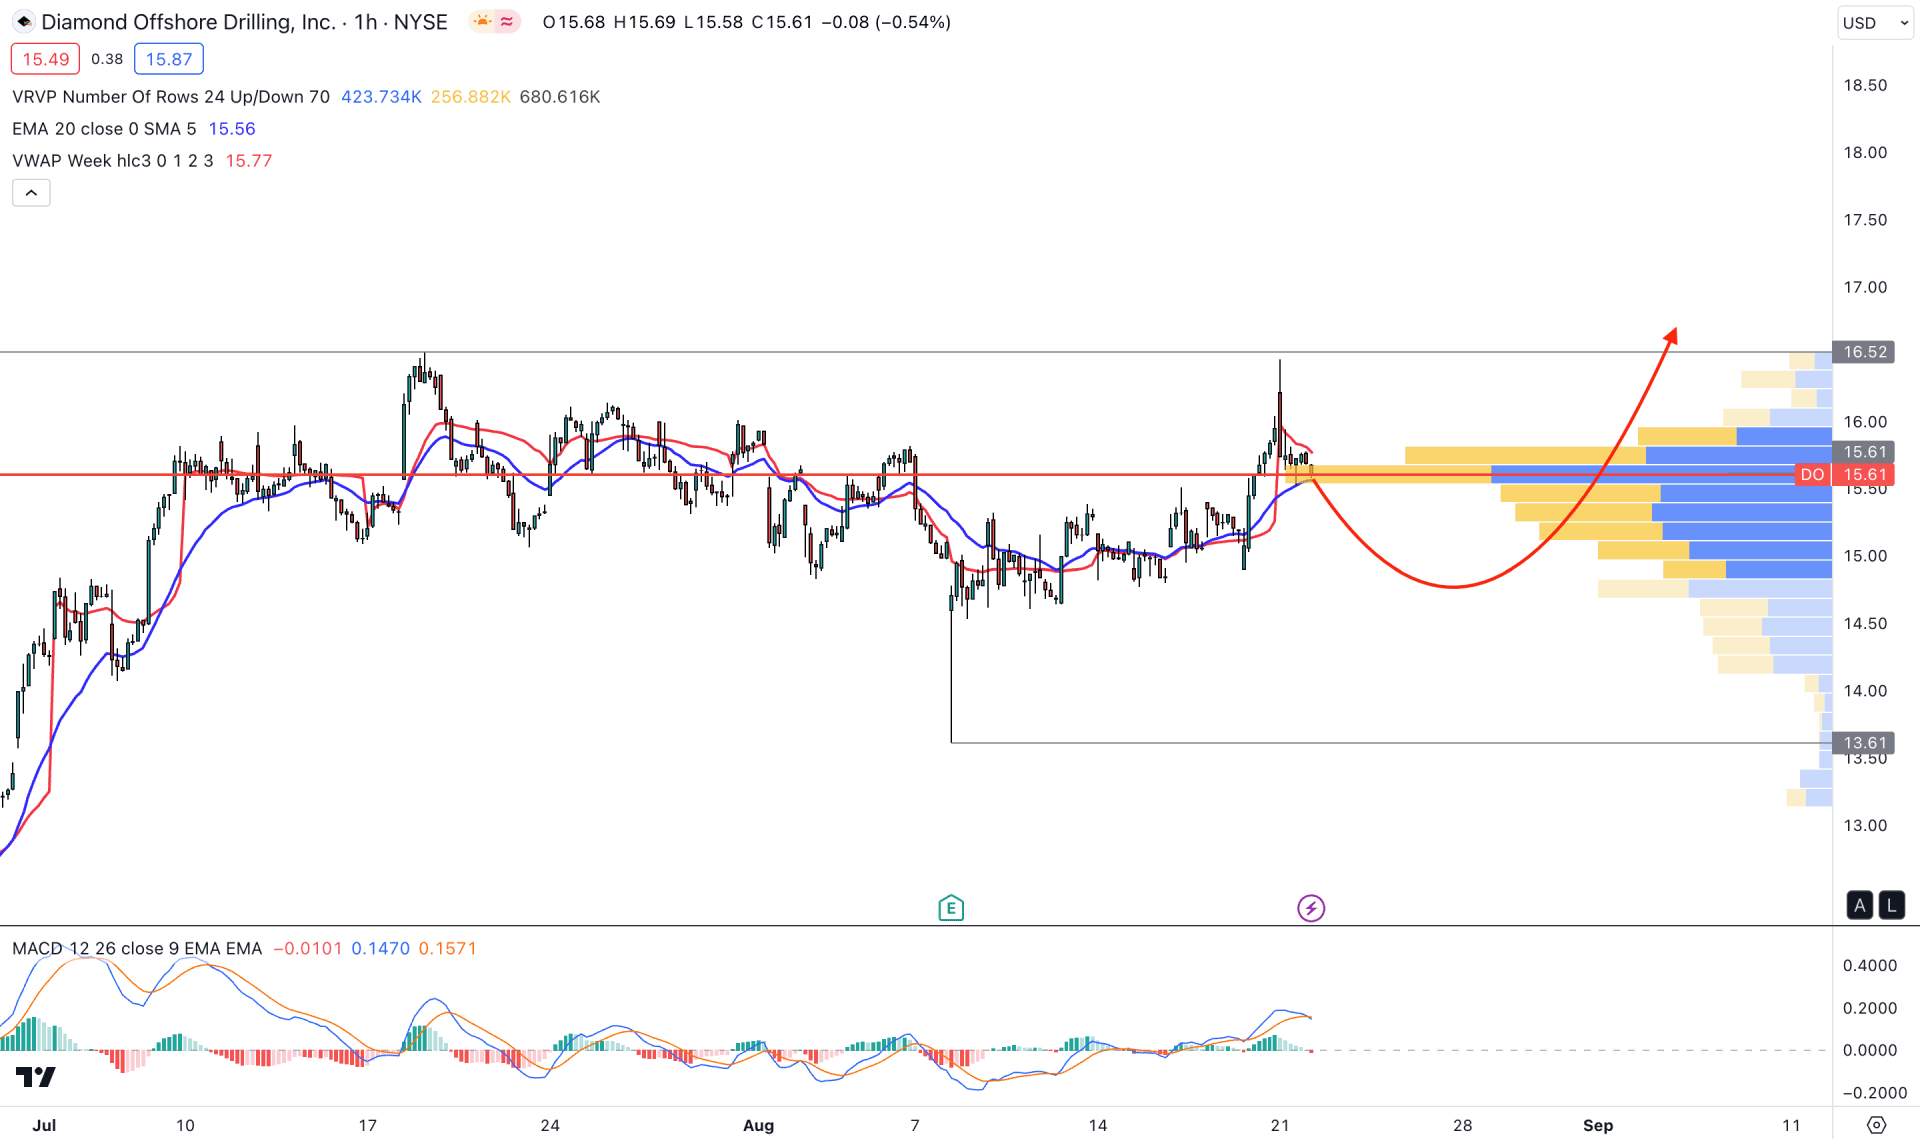
In the hourly chart, DO stock is trading sideways, where the current visible range high volume level is closer to the current price. In that case, investors might expect a stable trend after forming a proper breakout toward the trend.
The current MACD Line shows a bearish crossover in the indicator window, while the Histogram is below the neutral line. It is a sign of intraday selling pressure in the market, which may work as a bearish signal for the coming session.
Based on the H1 chart, downside pressure is pending in the DO stock. Therefore, a bearish H1 candle below the high volume level could lower the price toward the 14.00 area. On the other hand, a bullish recovery with a candle close above 16.50 is needed before aiming for the 20.00 level.
Based on the current market structure, DO stock is trading sideways, and a strong range breakout is needed before opening a long position. In that case, a proper bullish signal in the H4 chart with a bullish rejection from reliable support could offer an early long opportunity.


