Published: May 6th, 2025
A cutting-edge open-source framework for setting up and running autonomous decentralised organisations (DAOs) is called DeXe Protocol.
The protocol seeks to address common DAO issues such as plutocracy, lack of engagement, and centralised treasury management by using sophisticated voting procedures and expert delegation methods.
The DeXe DAO administers the DeXe Protocol, and the governance token is the DEXE token. This token is essential to the on-chain governance procedures since it enables token owners to participate in decision-making and influence the DAO's policies and direction. A large audience interested in participating in the management of the DeXe Protocol can access the DEXE token because it is listed on many cryptocurrency exchanges.
Along with concentrating on DAO governance, DeXe has partnered with other organisations in the blockchain and DeFi industry to broaden its reach and improve its ecosystem. One such collaboration, with Swissborg, advances the DeXe Protocol's wider use and applicability.
Let's see if this coin has a future growth possibility based on the multi-timeframe analysis:
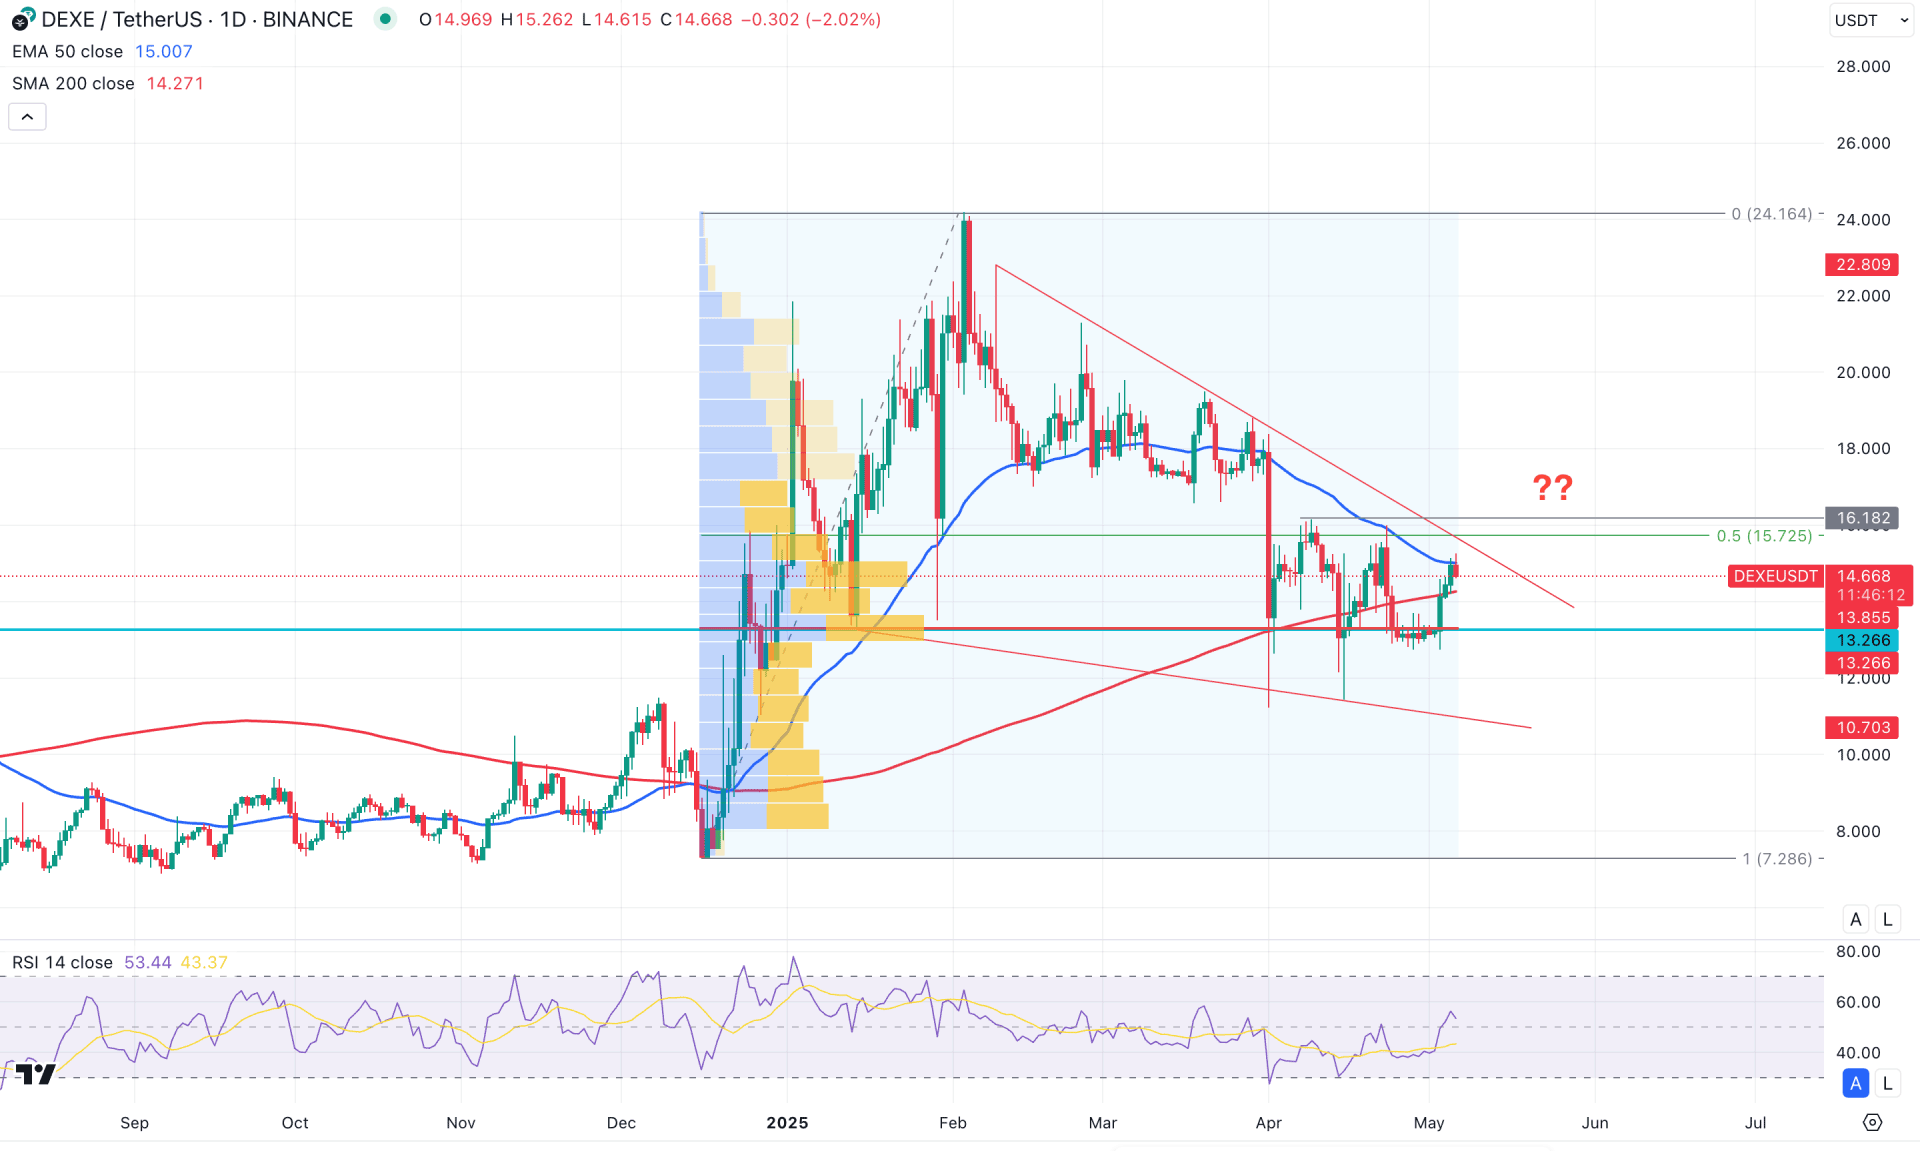
On the daily chart of DEXE/USDT, a massive bullish trend is visible, supported by a minor correction from which another bull run is expected. However, the price is still trading below crucial dynamic lines, from where a valid confirmation is yet to be seen.
Looking at the higher timeframe, a bullish trend continuation requires more confirmation, as the current price is still trading within the bearish body of April 2025. Although some volatility is visible on the weekly chart, a valid breakout is still pending from the sideways momentum.
In terms of volume structure, institutional buyers are active in the market, as the most active level since December 2024 lies below the current price. As long as this high-volume line acts as a rectangle support, any bullish signal could perform well this year.
On the other hand, the 200-day SMA is nearing the current price, while the 50-day EMA does not show a clear trend. In this case, the sideways momentum must be resolved before a stable trend can emerge.
From a broader perspective, the outlook remains sideways, with a falling wedge pattern yet to be validated. Meanwhile, the price remains below the 50% Fibonacci retracement level from the swing high between December and February, signalling a discounted price.
In the secondary indicator window, the Relative Strength Index (RSI) has rebounded and moved above the 50.00 level, which signals a buyer's presence in the market.
Based on this outlook, a clear trend must form before anticipating a bullish continuation. A daily candle close above the key resistance level at 16.18 could validate a breakout from the falling wedge. If that happens, a proper correction following the breakout could drive bullish momentum beyond the psychological 24.00 level.
However, the price is still facing resistance from the 50-day exponential moving average. A rejection from this level, followed by a drop below the 13.26 high-volume line, could present a challenge for the bulls. In that case, the price is likely to retest the previous support zone before attempting a bullish rebound.
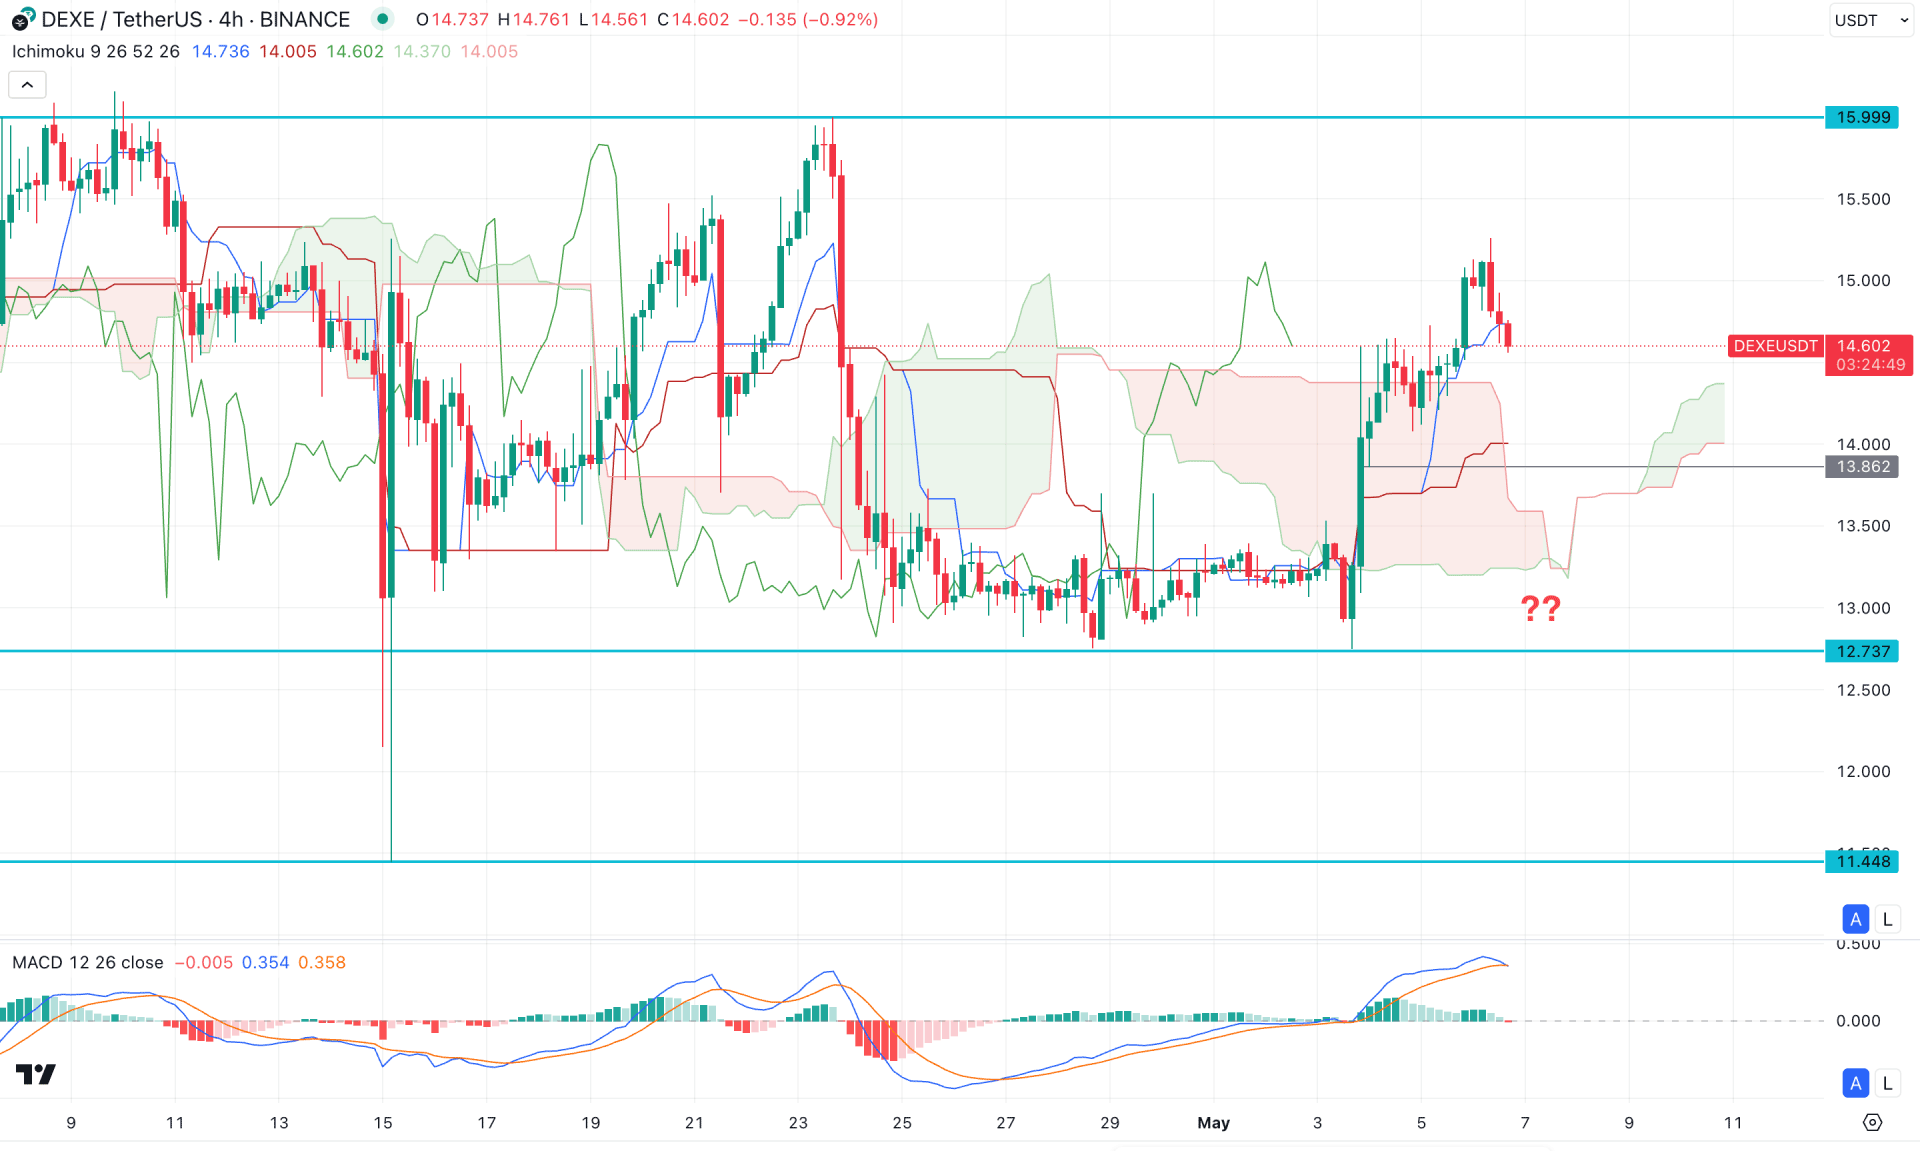
In the four-hour timeframe, sideways momentum is clearly visible, as the current price is trading within a rectangle pattern. Investors might expect a range extension since the price is facing resistance at the 15.99 rectangle high.
On the other hand, the Ichimoku cloud is below the current price and is acting as a crucial support. Moreover, the forward cloud levels are aiming higher, with both lines signalling a possible bullish continuation momentum.
Meanwhile, the MACD histogram has reached the neutral zone, indicating a loss of buying pressure, while the signal line appears to have found a ceiling.
Based on this outlook, the price is likely to correct lower and test the Kijun support before forming a bullish reversal. A demand imbalance is present below the 13.86 level, creating a potential bullish reversal zone between 13.86 and 12.73.
However, an extended selling pressure, along with consolidation below the 13.00 psychological level, could validate the bearish rectangle breakout, extending the selling momentum below the 11.44 key support level.
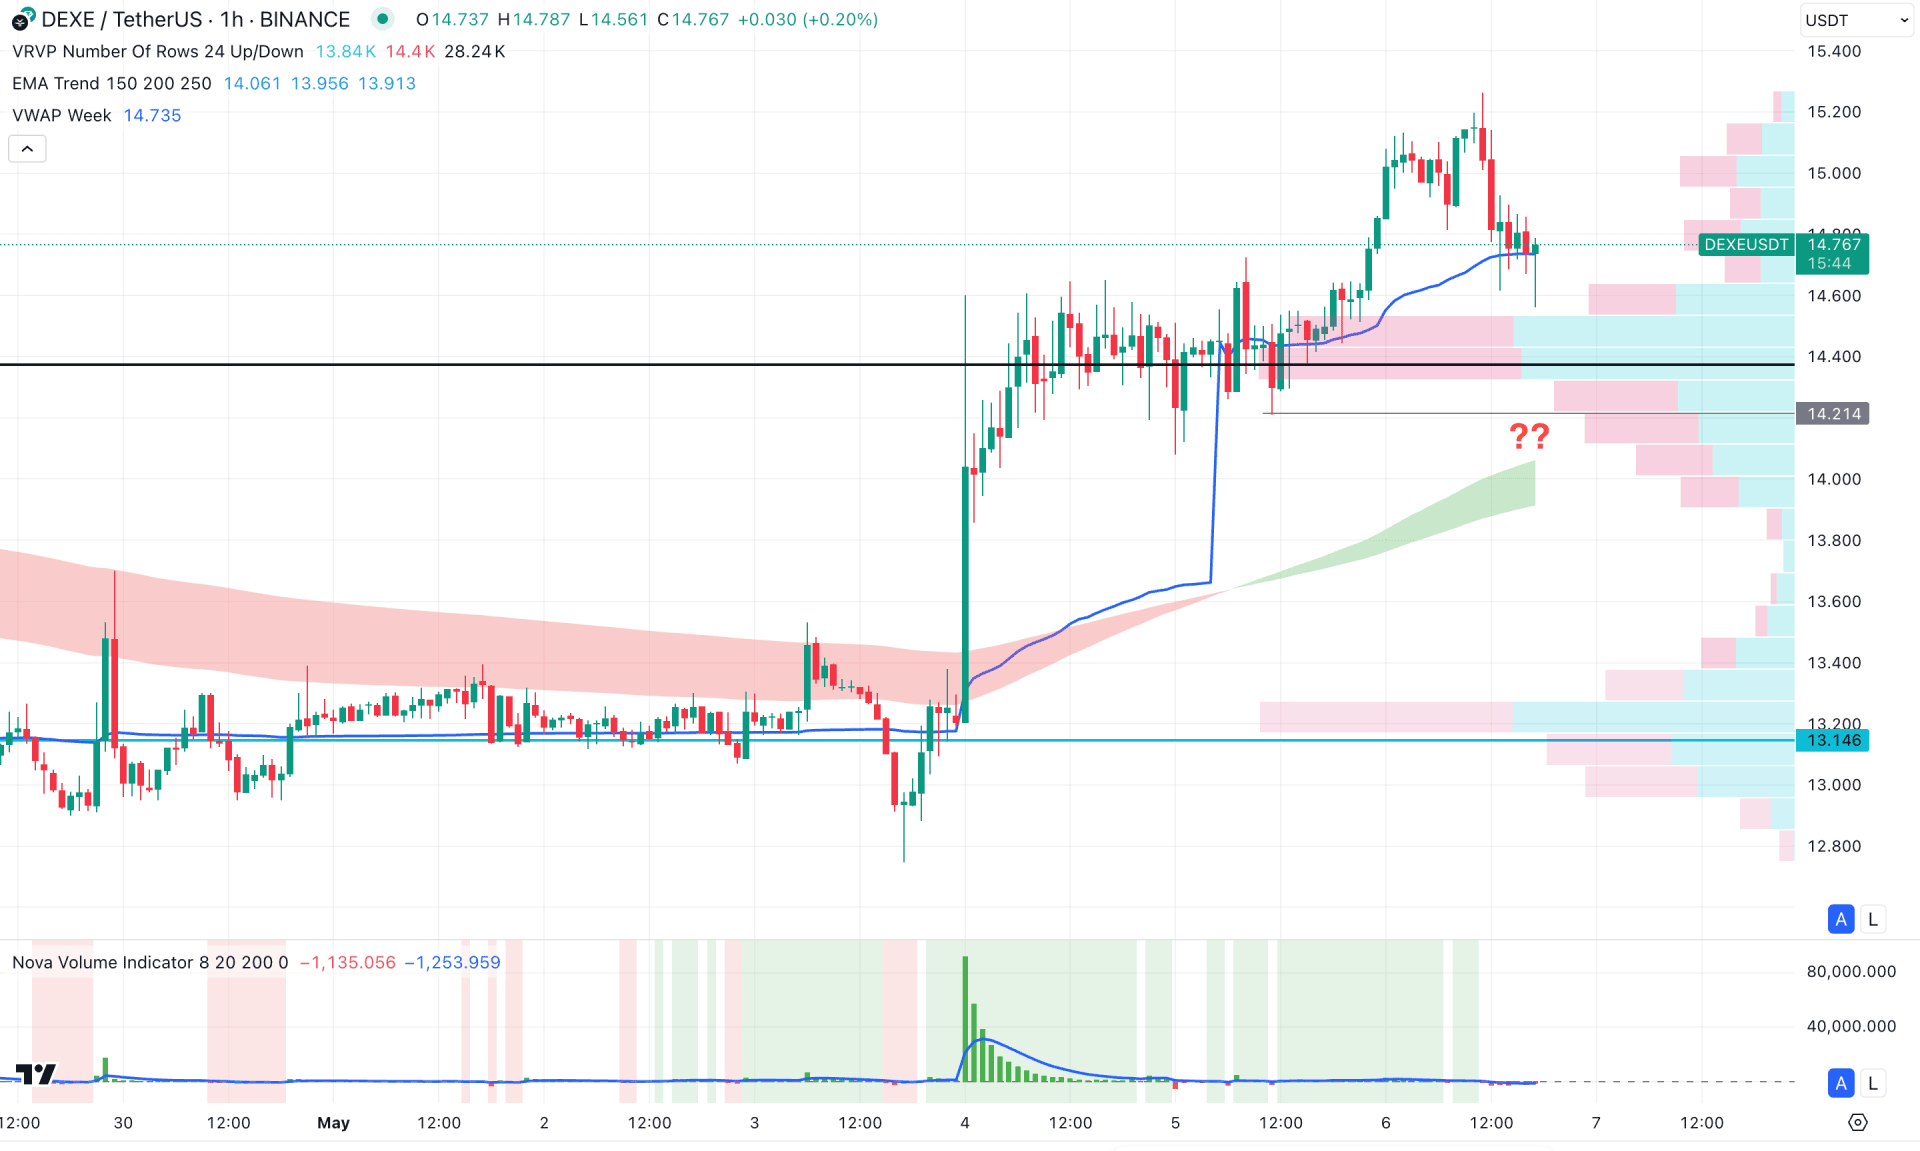
In the hourly time frame, the current price is trading above the high-volume line, signalling buying pressure in the market. Moreover, the moving average wave has flipped direction and is currently heading upward, acting as crucial support. As long as the price remains above the moving averages, the primary outlook for this pair favours long trades.
On the other hand, no significant volume activity is visible on the recent chart, as per the volume histogram, which signals lower transaction levels at a premium price. Additionally, the price has left an imbalance below the 14.00 support level, which is likely to be filled.
Based on this outlook, bullish continuation is favoured, and a bullish reversal may occur from the 14.21 support level. However, extended selling pressure is possible after filling the imbalance in the 13.60 to 13.20 zone, before forming another long opportunity.
Still, failure to hold above the 13.14 level could be an alarming sign for bulls, and the price could decline further toward the 11.00 area.
Based on the broader market context, DEXE/USDT is trading with a bullish breakout potential. A valid falling wedge breakout, along with a stable market above the dynamic 50-day EMA, could offer a decent investment opportunity.
However, the intraday market is still in a premium zone. A minor bullish reversal is pending before a stable trend can form.


