
Published: April 7th, 2026
Delta Airlines Inc. reported $16 billion in sales last quarter, up 2.9% year over year, exceeding analysts' revenue projections. The company had a mixed quarter, beating analysts' EPS projections but falling short of their EPS guidance for the upcoming quarter. It reported revenue-generating passenger miles of 59.86 billion, which was unchanged from the previous year.
In contrast to the 2.1% gain it saw in a similar quarter last year, the market anticipates Delta's revenue expanding by 7.5% year over year this quarter.
Over the past 30 days, analysts monitoring the company have largely reaffirmed their projections, indicating that they expect the company to continue on its current trend. Moreover, Delta has a track record of outperforming Wall Street's predictions.
Let's see the complete price outlook from the DAL analysis:
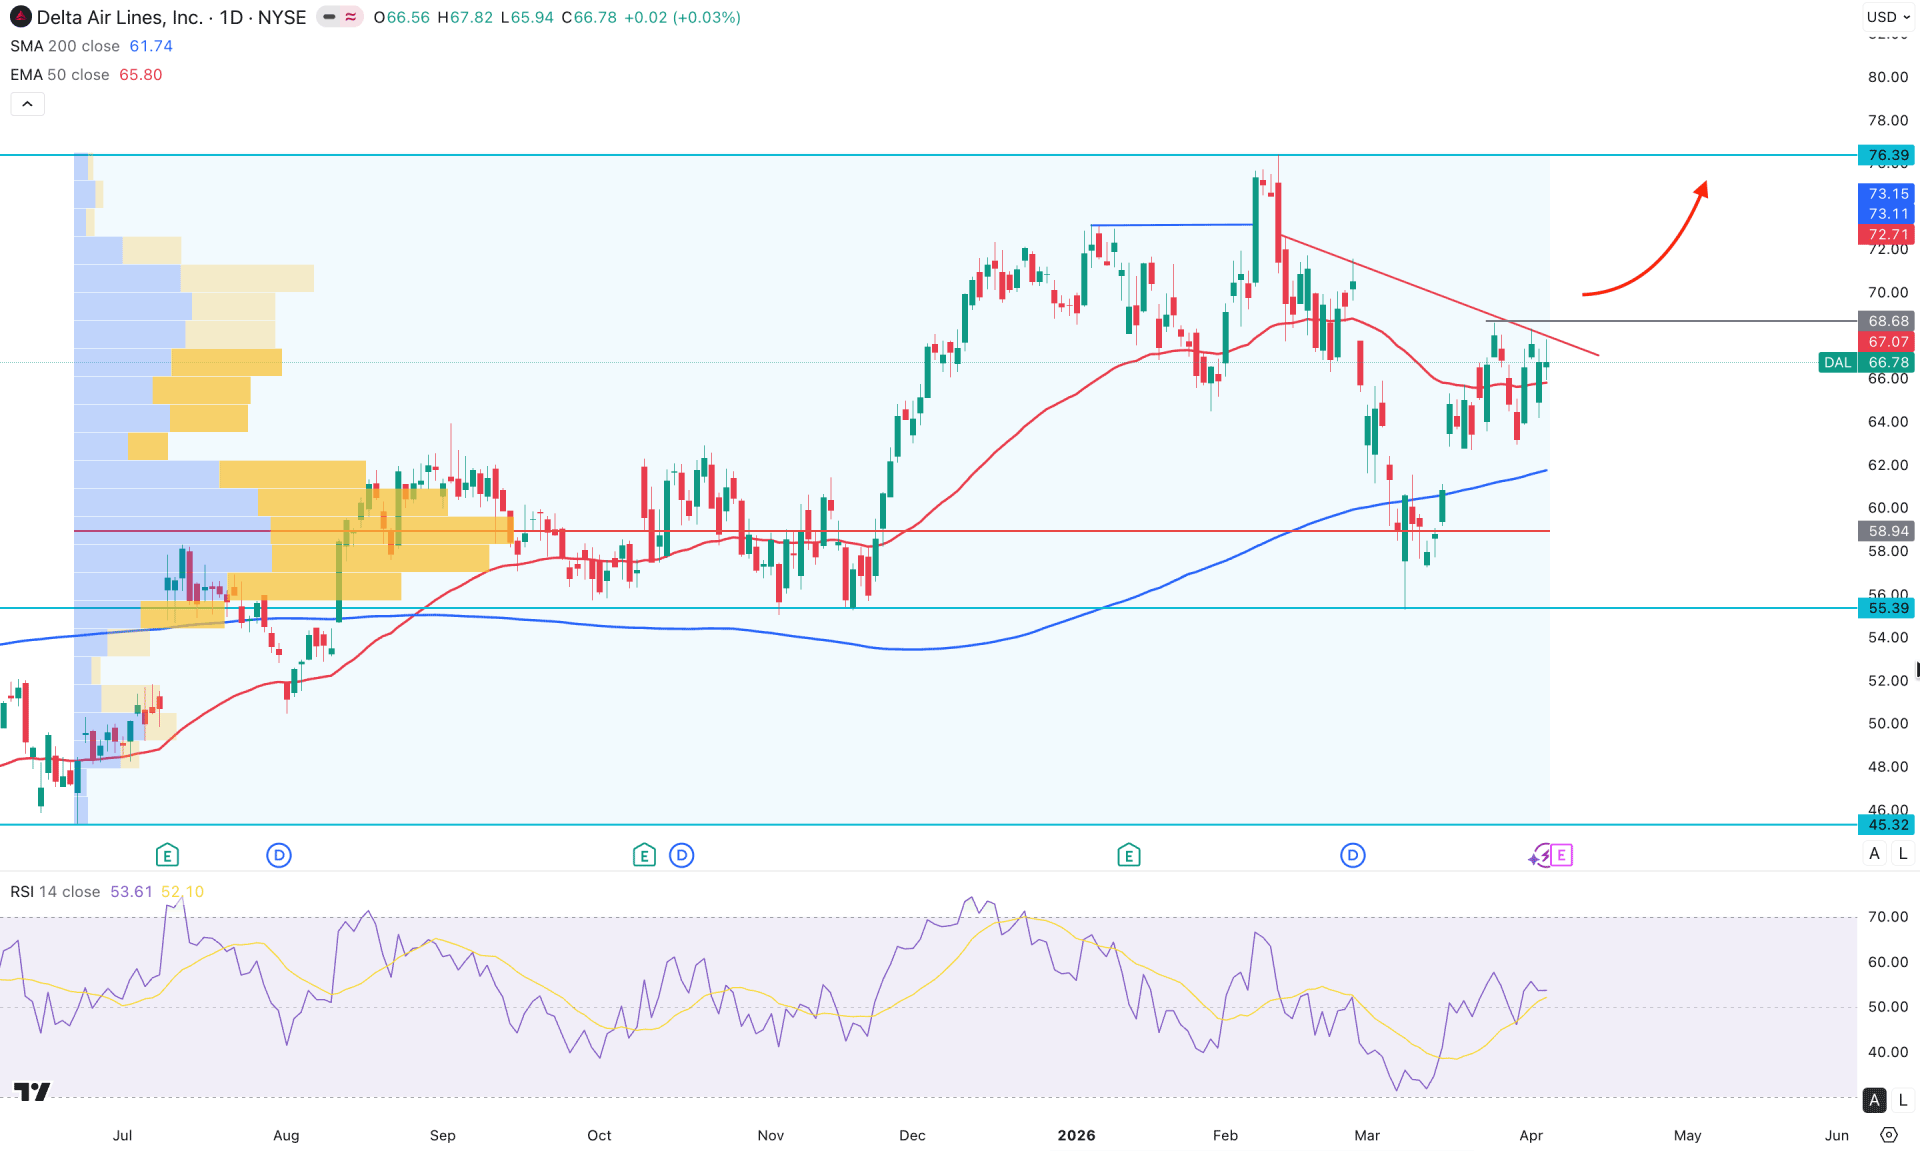
Delta Airlines stock has completed an extensive downside correction and found a bottom before forming a decent recovery in the first quarter of 2026. The most recent price is trading sideways at a crucial dynamic support area. A bullish breakout is pending before forming trend confirmation.
In the higher timeframe, the price is showing a strong bullish recovery, as the latest monthly candle closed with a strong sell-side liquidity grab. Moreover, the price is still holding momentum near the peak, from where a bullish monthly candle breakout is possible.
Looking at the volume structure, the price is trading at the buyer zone after testing the 58.94 high-volume support level. Moreover, no high-volume activity is observed at the bullish peak, indicating limited space for buyers. As long as the price remains bullish above the high-volume support, the main aim would be to look for long trades only.
On the daily chart, a strong bullish signal is present from the 200-day simple moving average, as the price failed to consolidate below this line. As a result, a bottom is formed at the 55.939 area, followed by multiple bullish candles above the 50-day EMA. The most recent price is highly corrective at the 50-day EMA area, from where a bullish confirmation is pending from a range breakout.
In the secondary indicator, the Relative Strength Index remains above the 50.00 neutral line after recovering from the oversold area.
Based on the overall market structure, DAL is trading within a bullish structure. A decent recovery from the 55.39 level indicates strong bullish potential. Investors should closely monitor how the price trades at the current trendline resistance area. A bullish breakout with a stable price above the 68.68 swing high could validate a long opportunity, targeting the 76.39 level. Moreover, overcoming the all-time high level could push the price beyond the 90.00 and even 100.00 levels.
On the other hand, the price is actively facing resistance from the trendline, which could limit buying pressure at any time if a sufficient buy-side liquidity sweep with a bearish recovery occurs. In that case, a failure to overcome the 68.68 level with a bearish daily candle below the 50-day exponential moving average would increase the possibility of testing the 58.94 high-volume support level before forming another bullish signal. A failure to hold the price above the 58.94 support level could increase the possibility of extended downside pressure towards the 45.32 key support level.
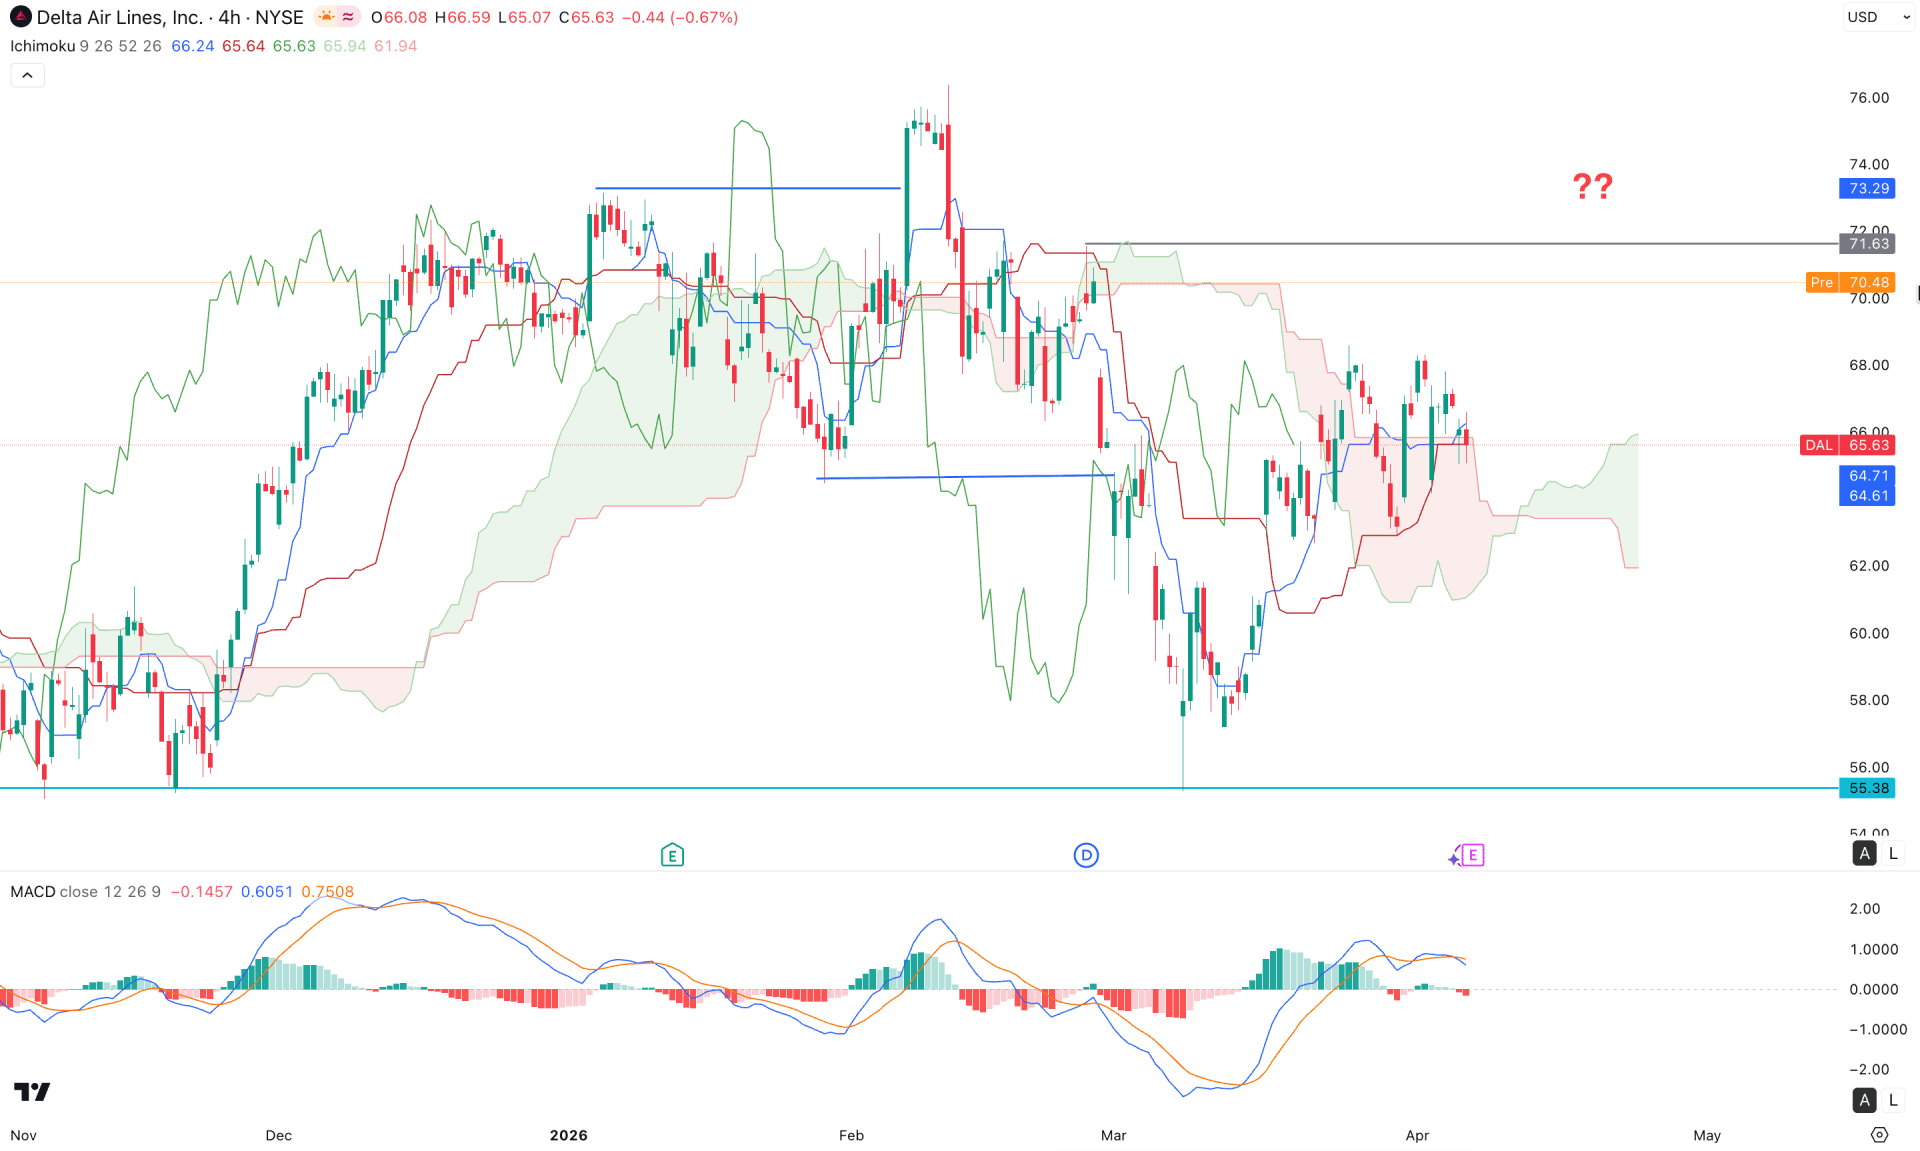
In the four-hour timeframe, the price is trading below the Kumo cloud after having a strong bullish break of structure in February 2026. Primarily, the pressure within the cloud area is signalling a strong liquidity grab, while the immediate support is located at 55.35. As the recent price has recovered from this support level, investors should monitor how it reacts at the current cloud resistance level. The future cloud is still sideways, as Senkou Span A and B show an expansion.
In the secondary indicator window, moderate buying pressure is evident, as the histogram remains above the neutral level. However, the signal line has reached the upper peak area following a bullish crossover, indicating sideways market pressure.
Based on the current market structure, a valid bullish break with a four-hour close above the 71.61 resistance level could validate a high-probability opportunity. In that case, the price is likely to move beyond the 78.00 level and more.
On the other hand, a rejection is visible where the cloud is working as resistance. In that case, a range breakout with a daily close below the Kijun-sen might create a new swing low below the 55.35 level.
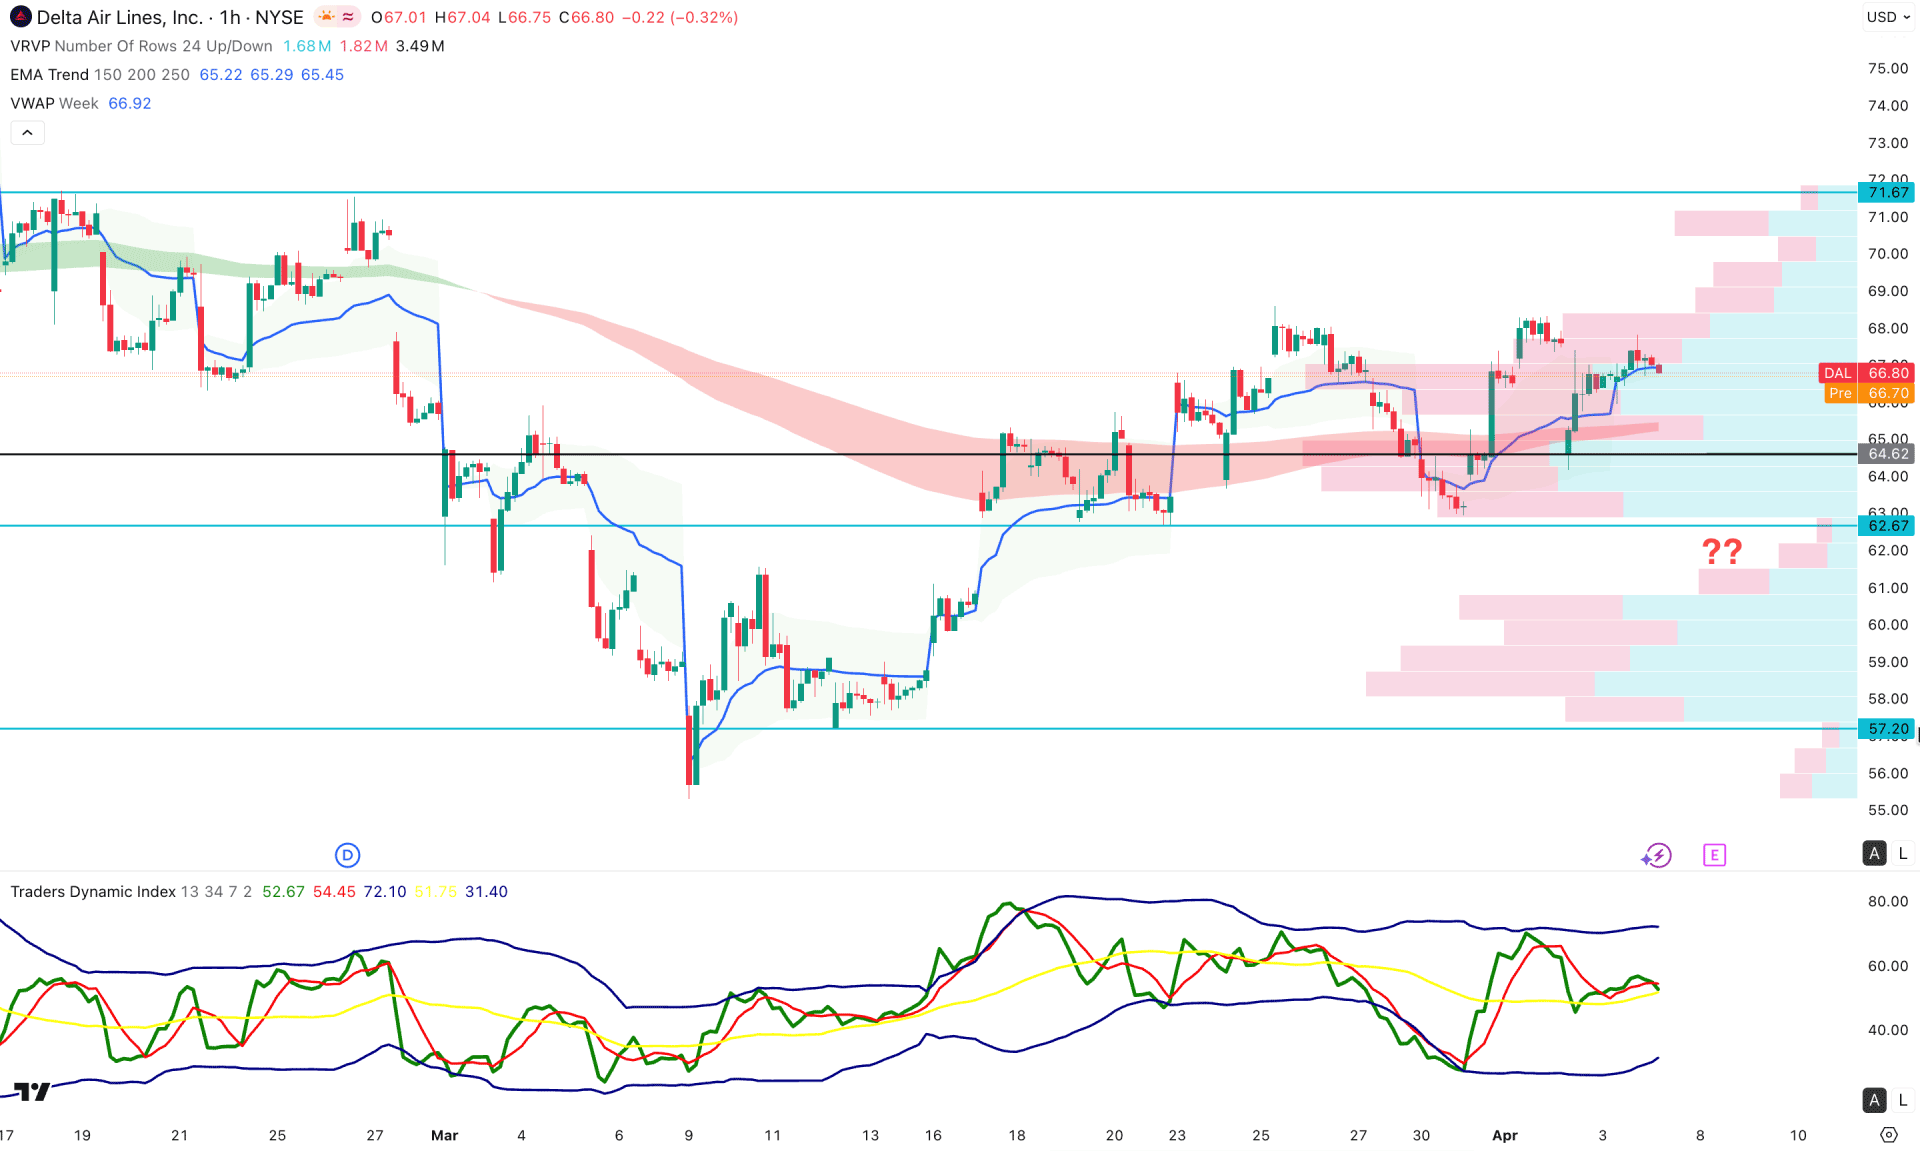
In the hourly timeframe, extended bullish momentum is visible, as the entire high-volume level is below the current price and working as support. Moreover, the exponential moving average wave and the VWAP are also below the current price, acting as confluence buying pressure.
The indicator window shows a similar structure, where the current TBI level is flat at the 50.00 neutral level.
Based on the overall market structure, the price is moving within a symmetrical triangle pattern, from where a breakout could initiate a new trend at any time. As dynamic lines are working as support, any bullish breakout with a clear hourly close above the 71.67 resistance level could initiate a bullish impulsive wave.
Based on the overall market structure, the ongoing market momentum for DAL is bullish, where an additional confirmation is needed for the bullish continuation. The intraday price is corrective from where a decent breakout could initiate the trend any time.


