
Published: July 9th, 2025
Last quarter, Delta reported sales of $14.04 billion, representing a 2.1% year-over-year increase, 1.1% higher than analysts had predicted. The company had a mixed quarter; its sales guidance for the upcoming quarter was above analysts' demands, but its EPS predictions fell short of their projections. It reported revenue-producing passenger miles of 55.68 billion, a 2.7% increase from the previous year.
In the current quarter, analysts predict that Delta's revenue will drop 1.5% year over year to $16.41 billion, reversing the 6.9% gain it saw in the same period last year. It is anticipated that adjusted earnings will be $2.05 per share.
Over the past 30 days, the company's analysts have largely reaffirmed their projections, indicating that they expect the business to continue on its current trajectory as it reports results. Over the past two years, Delta has exceeded top-line predictions by an average of 1.9% and only fell short of Wall Street's revenue estimates once.
Some of Delta's competitors in the buyer discretionary sector have already released their Q2 results, which gives us an idea of what to anticipate. Nike reported a 12% sales decline, exceeding projections by 3.4%, while Carnival reported a 9.5% year-over-year revenue increase, exceeding analyst projections by 1.7%.
Investor confidence in the buyer discretionary sector has been strong, as evidenced by share prices rising 5.6% on average over the past month. Additionally, Delta is losing 1%.
Let's see the future price outlook for this stock from the DAL technical analysis:
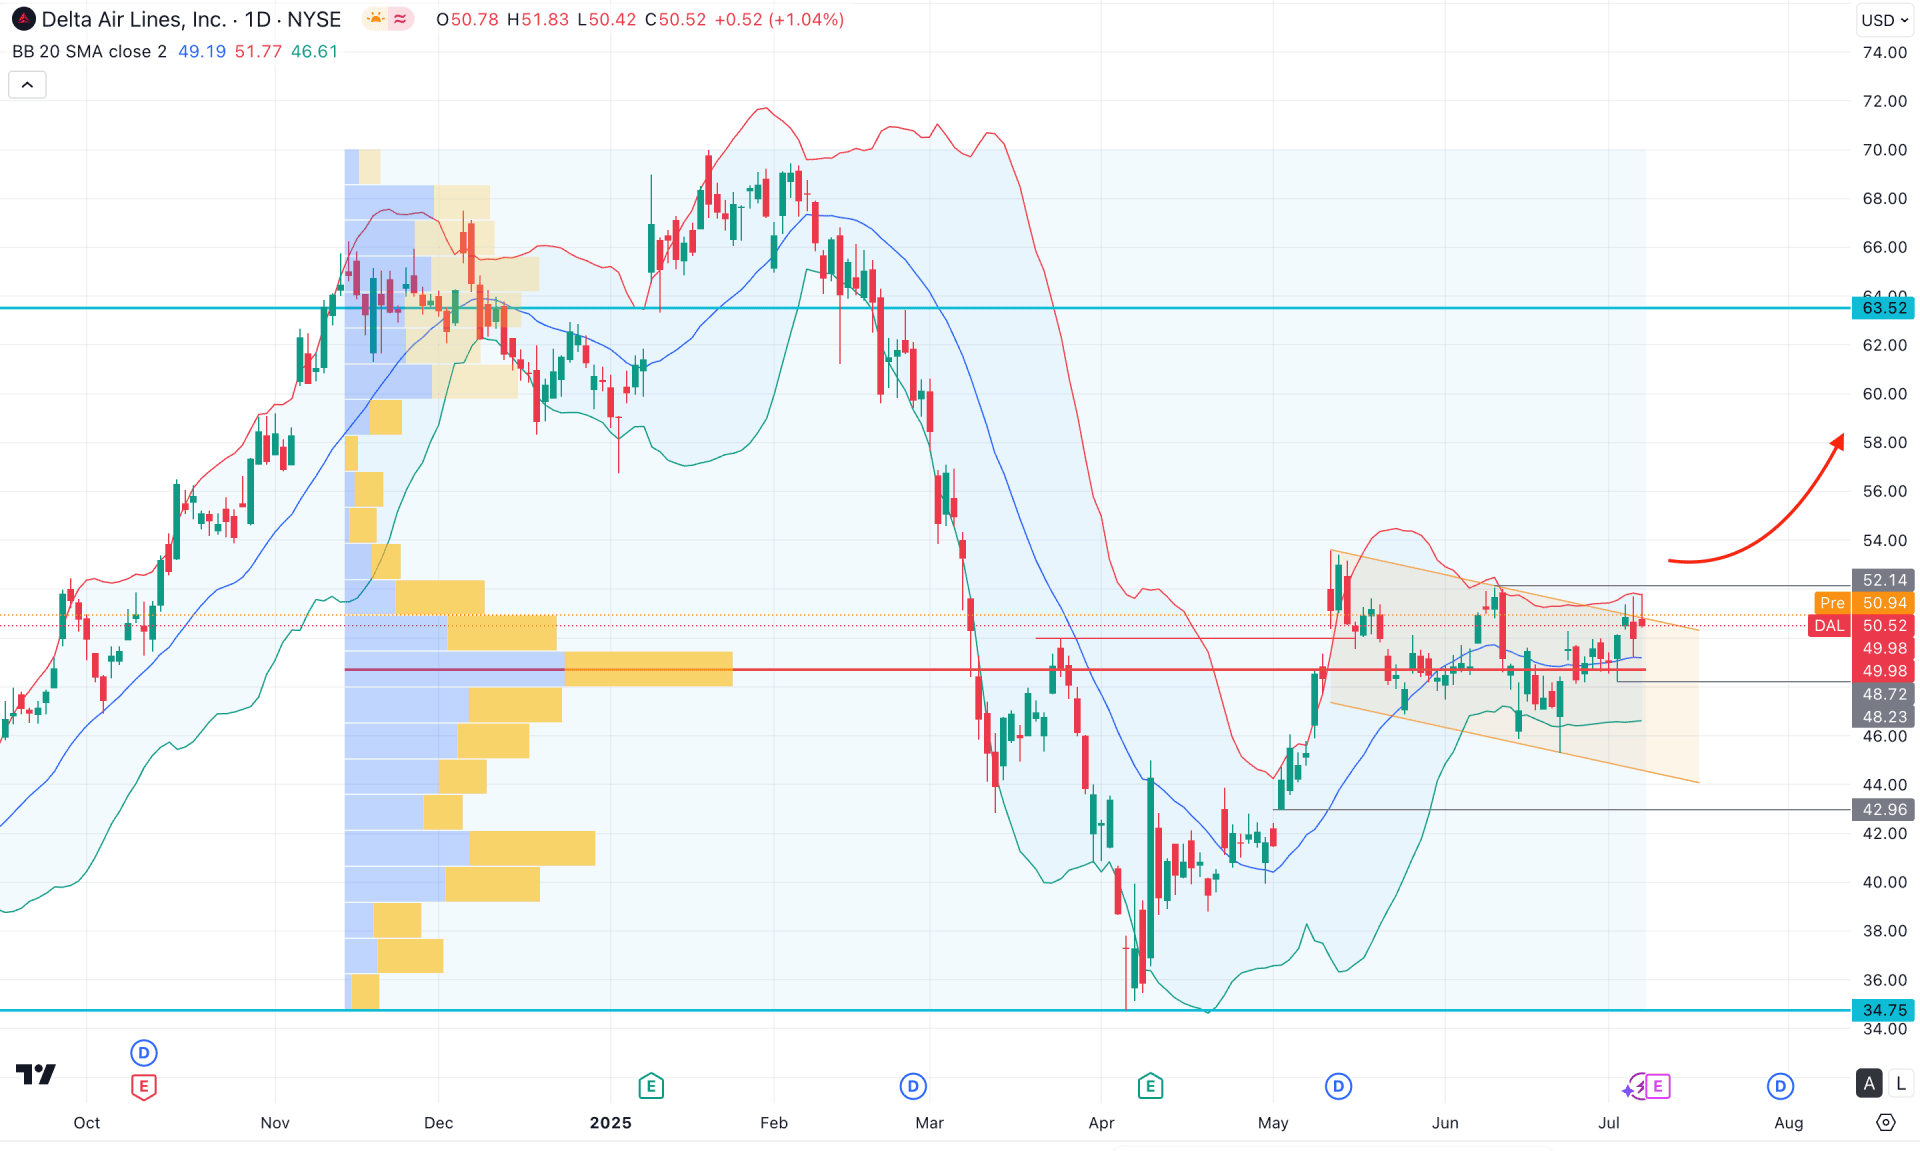
In the daily chart of Delta Air Lines, the recent price action indicates a strong bullish recovery. With a clear bottom formation, investors might anticipate a bullish continuation, as significant investor interest is visible around the resistance area.
Looking at the higher timeframe, the buying pressure remains valid, as the price continued to rise after forming an indecision candle in April 2025. However, the weekly chart also shows signs of indecision—after peaking at the 53.57 level, the price moved sideways within a channel. In this case, further confirmation is needed before expecting a bullish breakout from the current price zone.
Based on the volume structure, the price is trading within the highest activity level since November 2024. This suggests that an order-building process is underway. A price expansion may occur once sufficient liquidity has been swept.
On the main chart, the ongoing price action is encountering resistance near the upper Bollinger Band, following a bullish wave that started from the 34.75 level. Although the price is struggling to break above the 52.00 level, the sideways momentum within a descending channel signals a possible bullish expansion, pending proper validation.
Currently, both the upper and lower Bollinger Bands have flattened, while the mid-Bollinger Band is acting as immediate support, backed by the high volume line. This setup suggests a potential bullish continuation, especially after a confirmed breakout.
Given the current price structure and sustained upward pressure, a stable position above the 53.14 level may open long opportunities at any time. On the bullish side, immediate resistance is located at the 63.52 level, which could act as a key barrier before a potential move beyond the psychological 70.00 mark.
On the bearish side, sufficient confirmation is required before expecting the price to revisit the 74.75 level. A failure to hold above the 52.14 level could lead to a bearish correction, with the primary downside target being the lower boundary of the channel.
However, the 42.96 level could serve as a crucial support. A decisive break below this zone could drive the price into the liquidity area. A strong bearish breakout and consolidation below 42.96 may present a bearish opportunity, with the next key target near the 32.00 level.
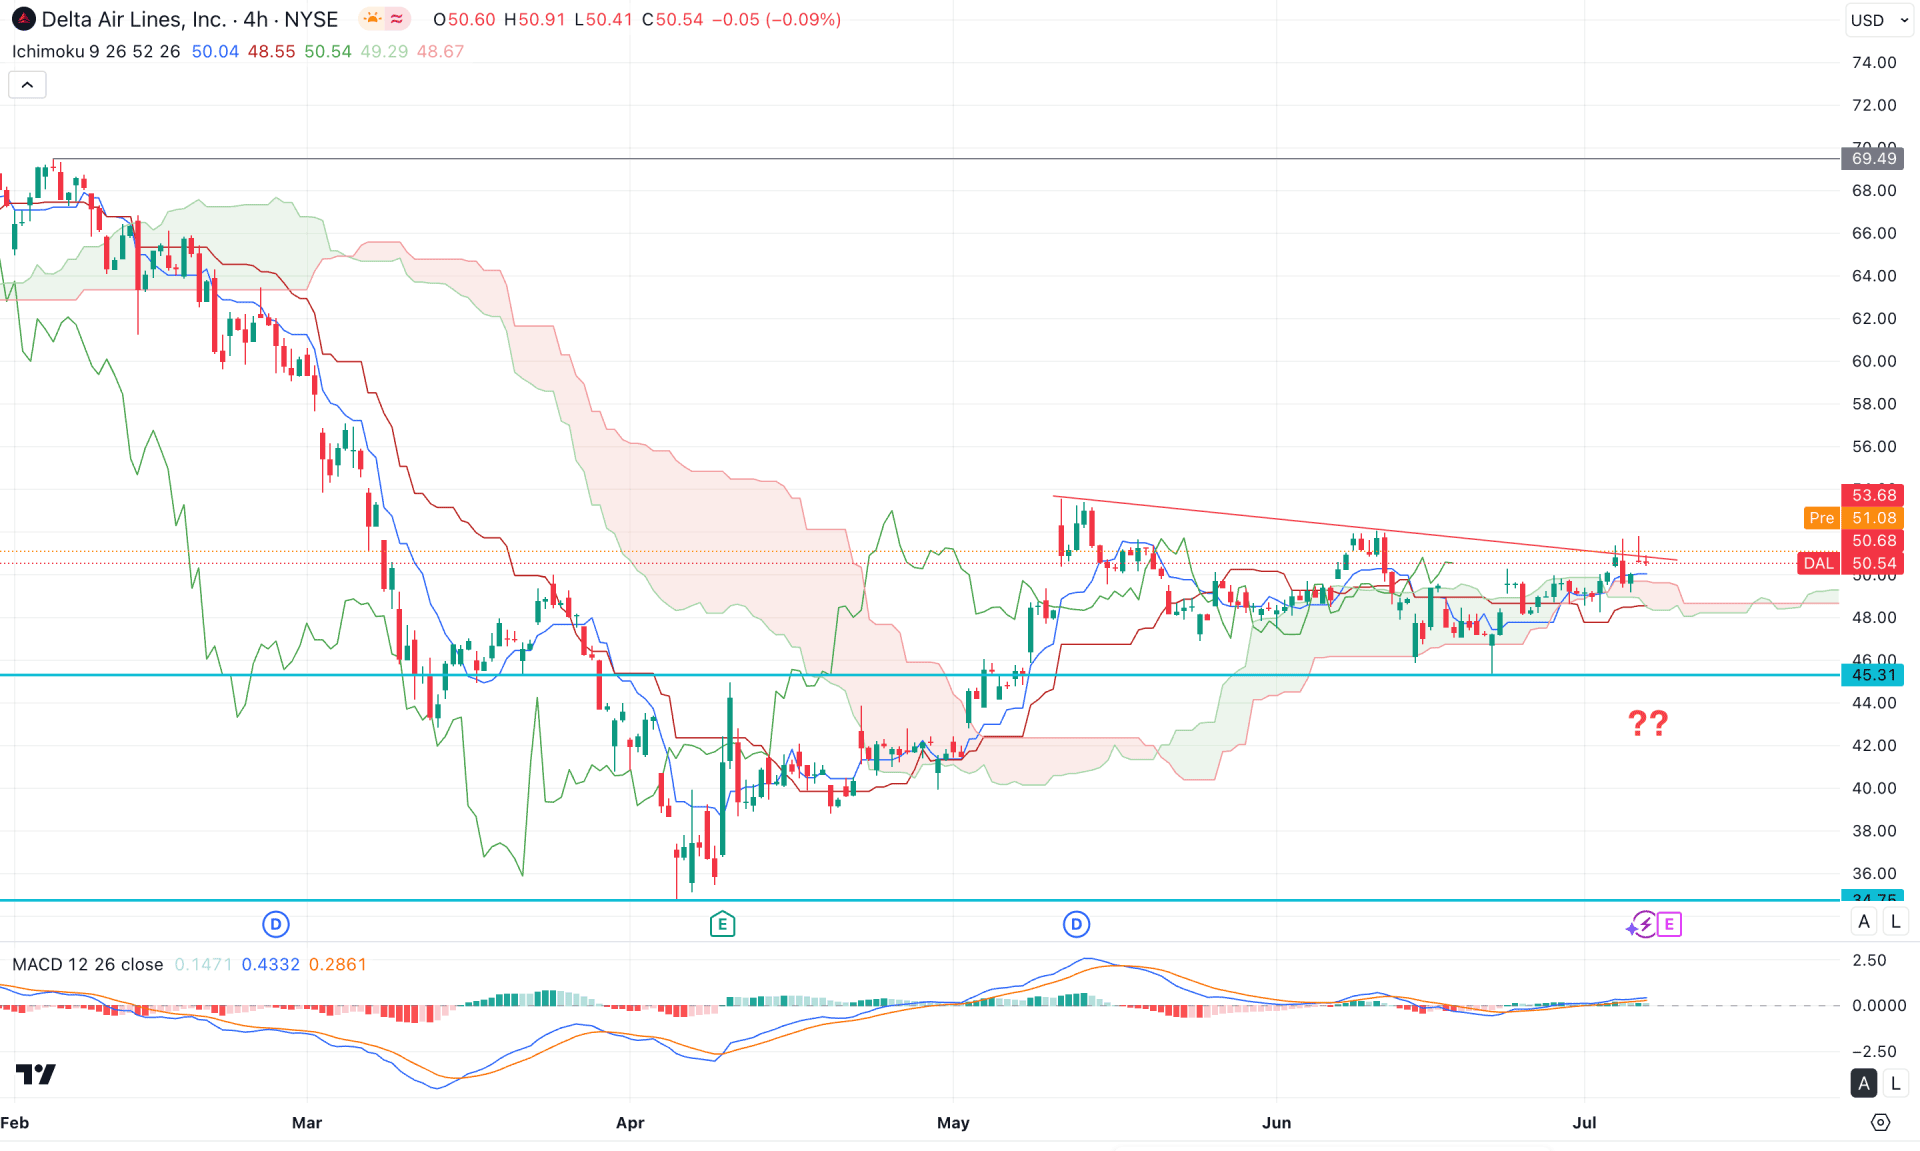
In the 4-hour timeframe, the recent price shows a strong bullish recovery, as multiple 4-hour candles have formed above the Kumo Cloud zone. Currently, the Kumo Cloud is acting as immediate support, and investors may expect a bullish continuation as long as the price holds above this area.
In the future cloud, the bullish potential remains strong, as both Senkou Span lines are trending higher. The secondary indicator window supports this view—the current MACD histogram maintains a positive outlook, while the neutral MACD signal line reflects a similar sentiment by holding a stable position within the bullish zone. There is still room for further upside in the histogram and signal line, indicating open space for upward movement in the main price chart.
Overall, the 4-hour market outlook remains bullish above the trendline resistance, with the ongoing consolidation signalling a potential continuation toward the psychological level of 70.00.
On the other hand, investors should closely monitor how the price reacts to the dynamic Kijun Sen level. A shift to sideways momentum could lead to an extension below the Kumo Cloud area, weakening the bullish outlook.
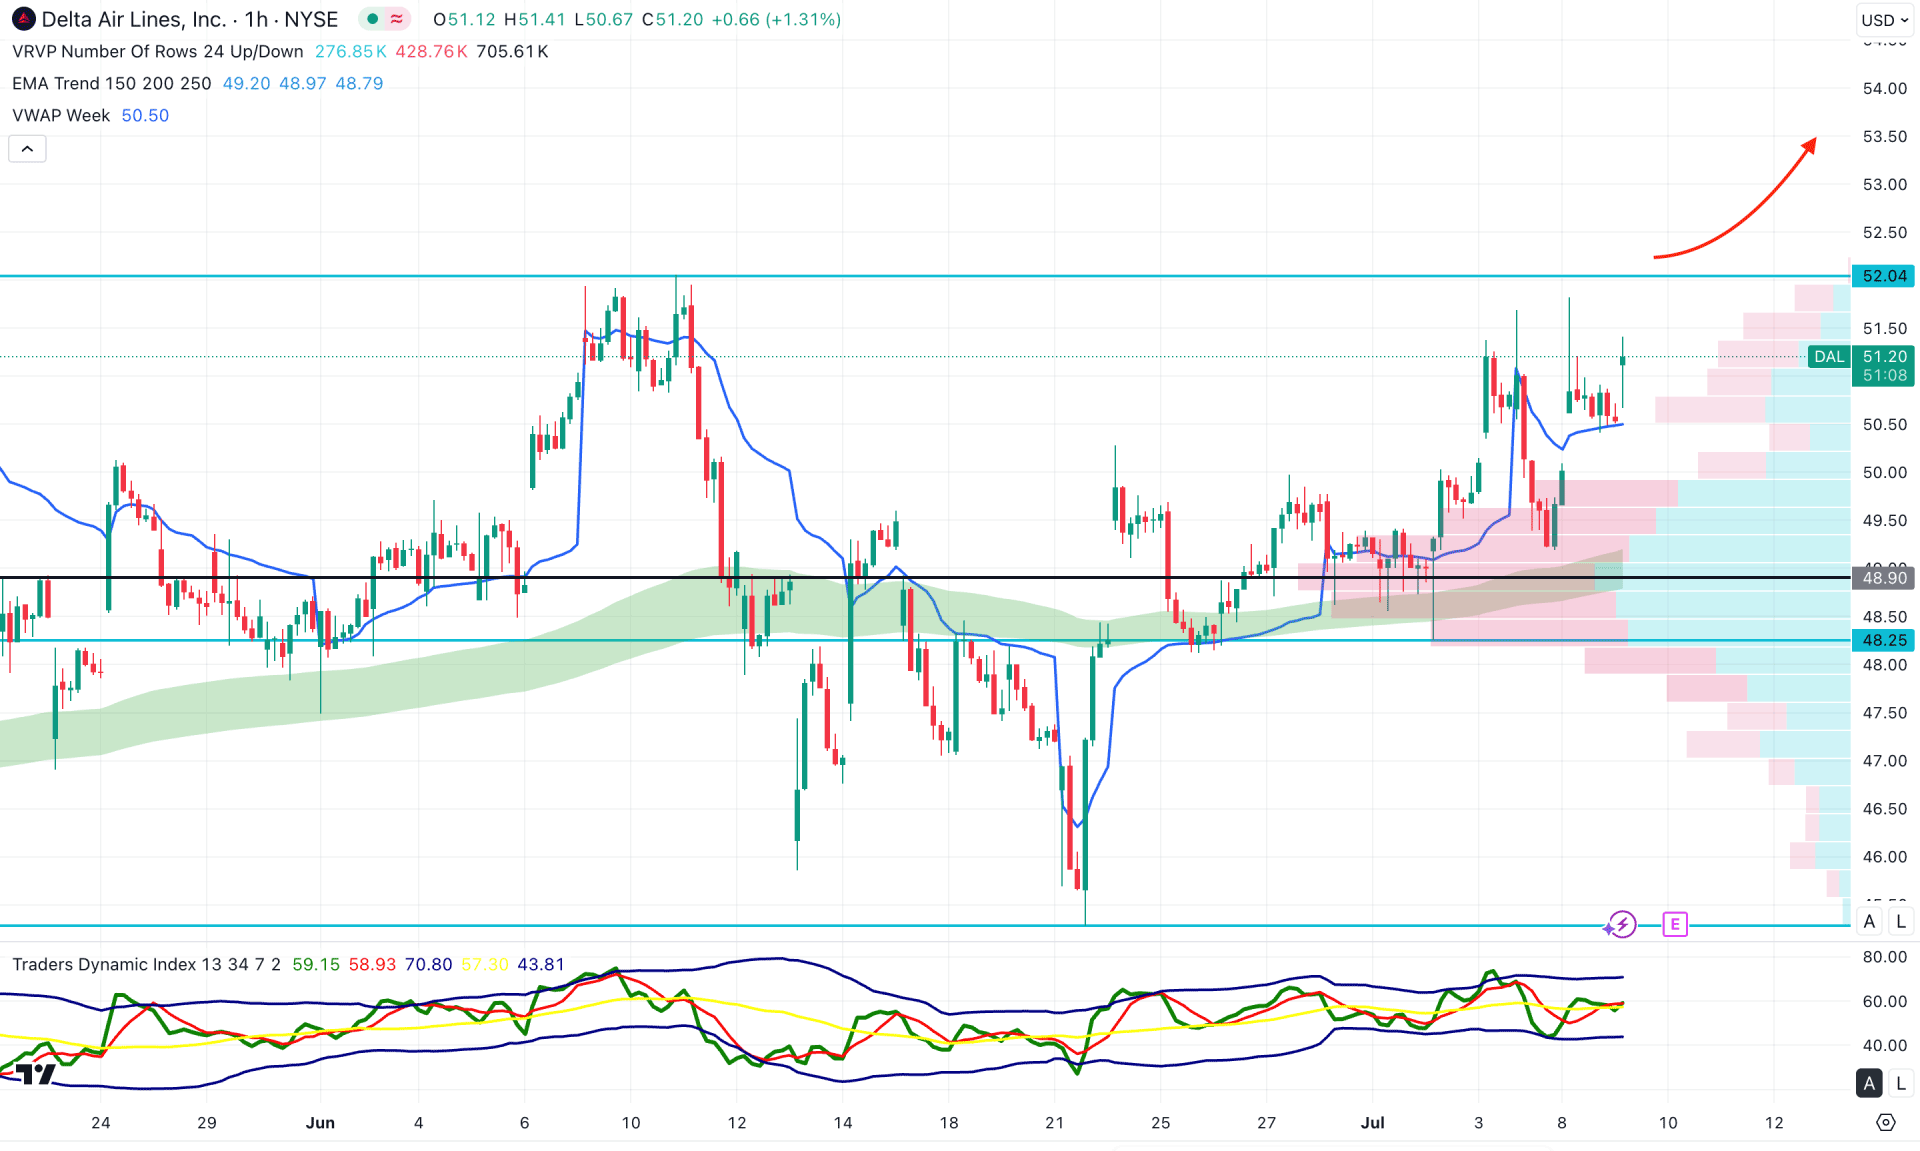
In the hourly time frame, intraday buying pressure is evident for DAL, as the most recent price action moved higher above the rising EMA wave zone. Moreover, the visible range's high-volume node remains below the EMA zone, supporting the bullish bias.
In the indicator window, the Traders Dynamic Index (TDI) has flipped its position sideways around the 50.00 level, indicating potential corrective price action.
Overall, the volatility around the 51.50 level may signal a possible downside correction in the coming hours. However, bullish momentum remains valid as long as the price holds above the 48.90 high-volume line. In that case, any rebound from dynamic support could trigger a long opportunity, targeting the 53.50 level. On the other hand, ongoing volatility near the top could increase selling pressure, and a stable price below 48.20 may open a short-term bearish opportunity.
Based on overall market momentum, Delta Airlines stock (DAL) is currently trading within a bullish pre-breakout structure, supported by the recent U-shaped recovery. A confirmed breakout above the 52.00 level could validate further upside. Investors should closely monitor the intraday chart, as an aggressive buying opportunity may emerge after a confirmed bottom is established in the hourly time frame.


