
Published: May 28th, 2025
On May 29, Dell is expected to release its fiscal 2026 first-quarter earnings. Revenues are anticipated to range from $22.5 billion to $23.5 billion for the first period of fiscal 2026, with a midpoint of $23 billion indicating 3% year-over-year growth. At the halfway point, non-GAAP earnings are projected to be $1.65 per share (+/- 10 cents), representing a 25% increase.
In the to-be-reported quarter, Dell Technologies expects the entire Infrastructure Solutions Group (ISG) and Client Solutions Group (CSG) to boost its revenue by 6% year over year at the halfway point. CSG revenues are anticipated to remain unchanged yearly, whereas ISG revenues are predicted to grow in the low teens.
The expanding AI industry and Dell Technologies' dominance in AI-optimized servers, such as the PowerEdge 9680, are anticipated to have contributed to the quarter that will be reported. Orders for DELL's AI-optimized servers increased by $1.7 billion in the fourth quarter of fiscal 2025. In the fourth quarter of the year, the business delivered $2.1 billion in value to AI servers, and the backlog of AI servers, which stands at $4.1 billion, remained solid.
Dell Technologies announced significant developments throughout the Dell AI Factory in May 2025 to speed up workplace AI adoption, partnering with NVIDIA. These include new management services for efficient AI implementation, improved AI data channels, integrated software products, and next-generation PowerEdge servers. This collaboration with NVIDIA is probably going to have benefited the success of the to-be-reported quarter.
The two companies partnered to facilitate the on-premises deployment of Meta Platforms' Llama 2 models and Dell Technologies' AI-optimized portfolio.
At a projected 12-month P/S of 0.75X, DELL's stock is trading at a substantial discount to the 6.12X for the Computer and Technology sector.
Let's see the further outlook from the DELL technical analysis:
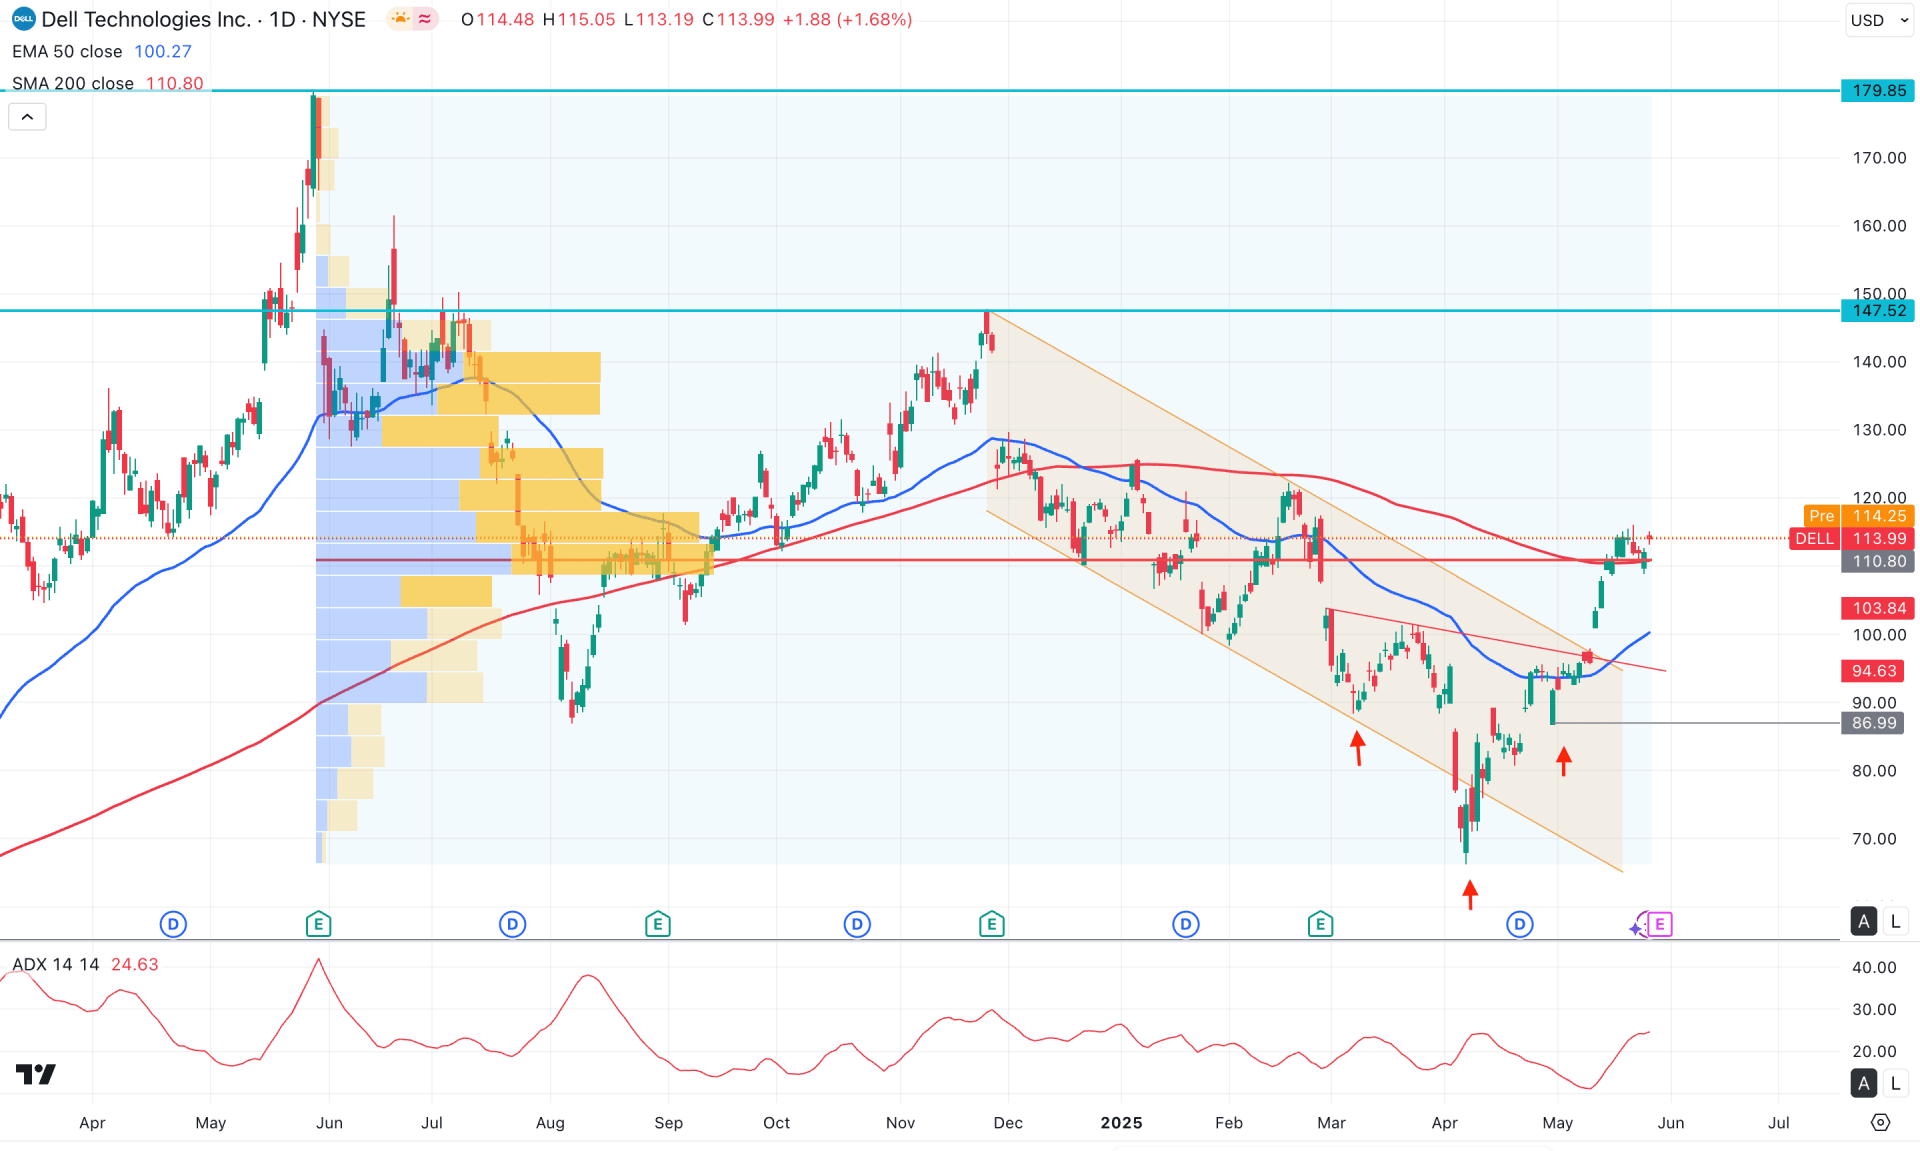
In the daily chart of DELL, the recent price action suggests a potential bullish reversal following the formation of a valid bottom. Primarily, investors might anticipate an upward continuation once a confirmed downside recovery is completed.
Looking at the higher time frame, the price already exhausted sellers in April 2024, as evidenced by a strong liquidity gap and a new multi-month low. The latest month closed with a bullish hammer candlestick, indicating a possible continuation toward the three-month high. With ongoing bullish momentum, further upside movement will likely appear in the coming days.
Analyzing the volume structure, the most active level since June 2024 is at 125.65, which lies just below the current price. This indicates that the recent bullish recovery has the potential to extend higher, as the gap between the current price and the high-volume level remains narrow.
On the main price chart, the dynamic 50-day EMA is still below the 200-day SMA, but both moving averages are positioned beneath the current price. This suggests strong upward momentum. However, the widening gap between the current price and the 50-day EMA signals a potential short-term correction.
In the secondary indicator window, the Average Directional Index (ADX) line is at a two-month high but shows limited upward potential. This indicates that the upcoming price action may be corrective. From the ADX momentum perspective, if the correction is validated, this could present a buying opportunity.
Based on DELL daily market outlook, the breakout from an inverse Head and Shoulders pattern, followed by a descending channel breakout, serves as a confluence of bullish pressure. Multiple bullish daily candles are visible above the channel resistance, confirming buyer dominance. In this case, any downside correction toward the 105.00 to 102.90 zone could offer a potential buying opportunity, especially if there's a valid rejection from the 50-day EMA.
On the other hand, a failure to hold the price above the 86.99 neckline of the inverse H&S pattern could pose a challenge for the bulls. In that scenario, long-term bearish strength may resume if the price breaks below the 85.00 psychological support level with strong bearish price action.
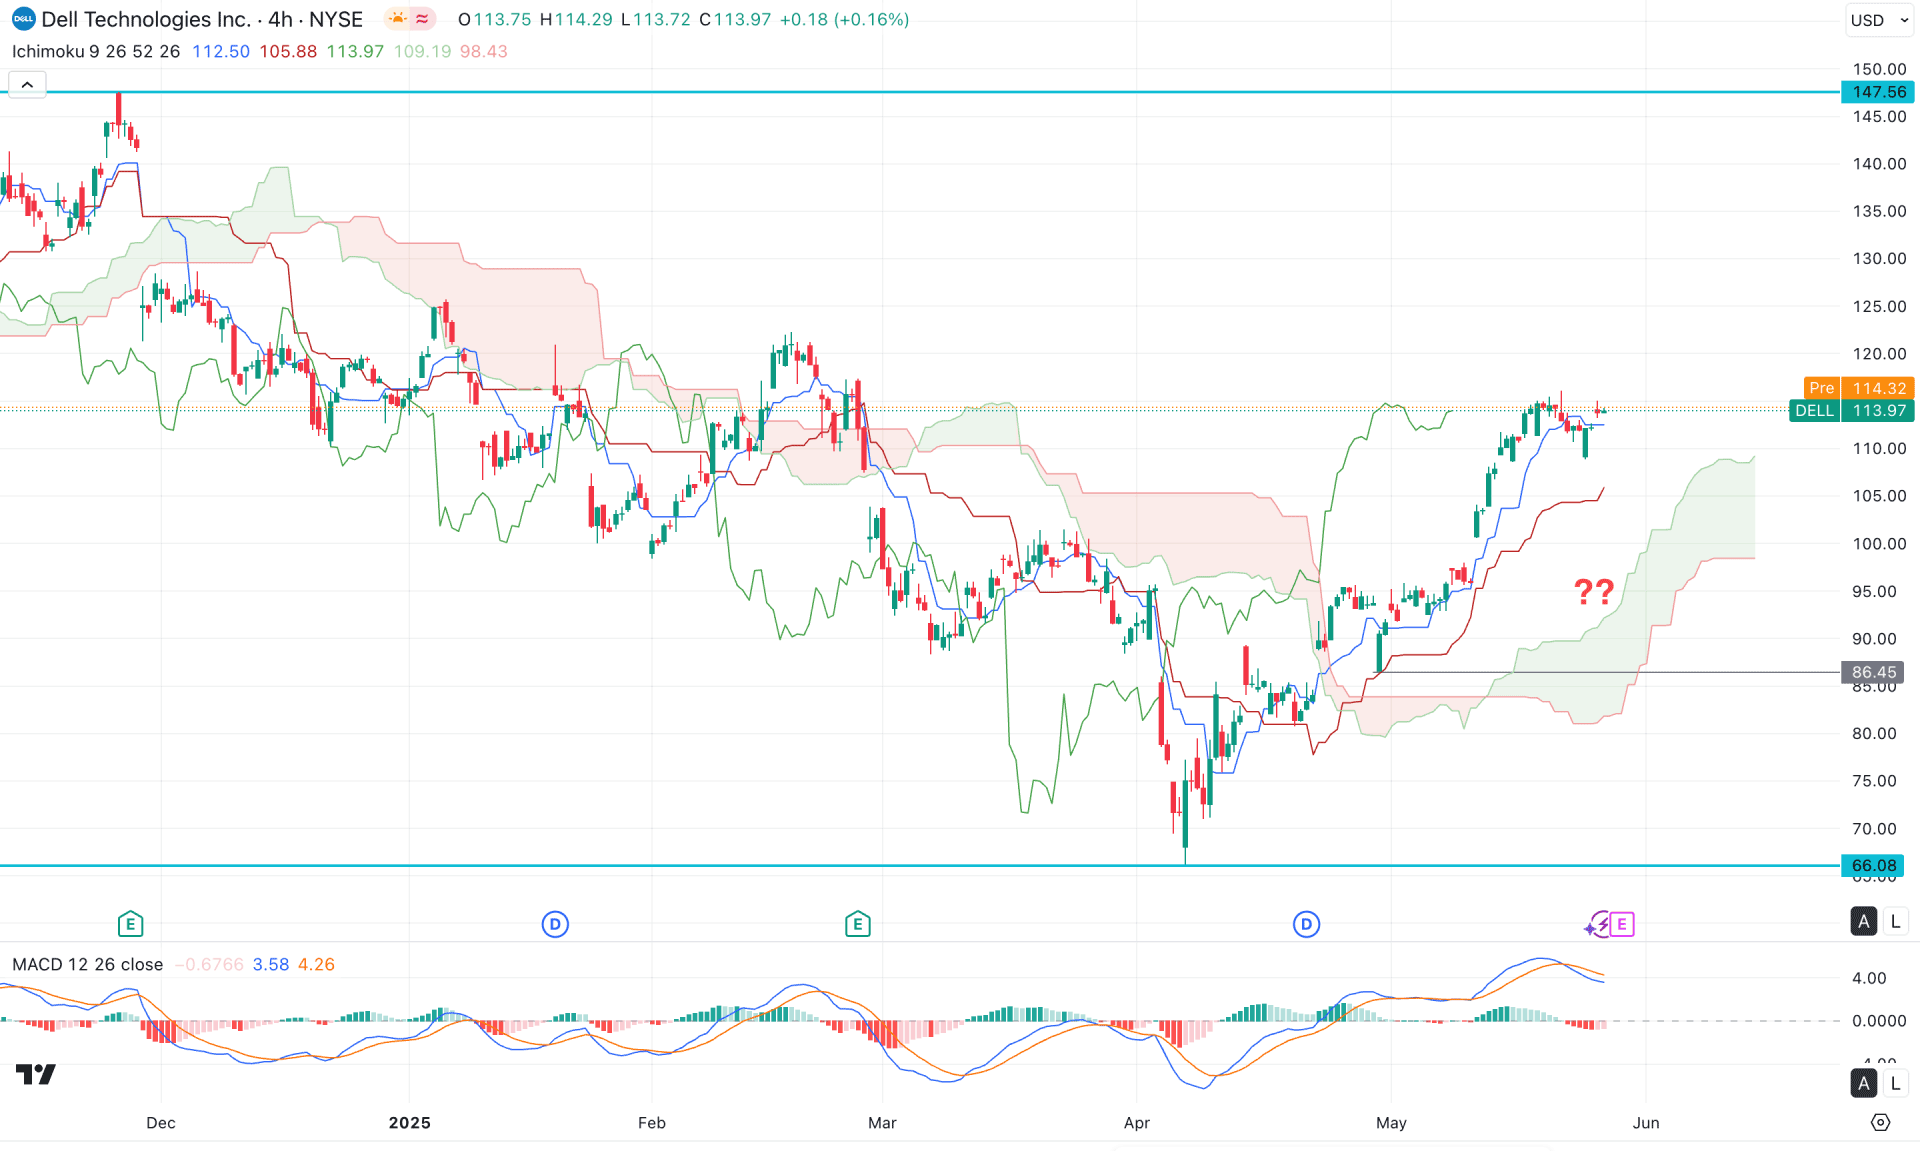
In the 4-hour timeframe, the current price is trading above the Kumo Cloud support, suggesting a possible bullish continuation. Moreover, both future cloud lines are sloping upward, which could act as a confluence of buying pressure.
Looking at the indicator window, the current MACD histogram is climbing higher after flipping above the neutral line. However, the signal line remains in the positive zone and is moving sideways following a bearish crossover.
Based on the 4-hour market outlook, the stock is more likely to extend higher once the current downside correction is complete. At present, the price is approaching dynamic Kijun Sen support from above. A breakout to a new swing high could validate an immediate long opportunity.
On the other hand, if the price moves below the Kijun-sen line, a short-term recovery may still occur, potentially finding support within the cloud area. However, a failure to establish a bullish reversal from the cloud zone could be an alarming signal, as it may lead the price to retest the 66.08 low.
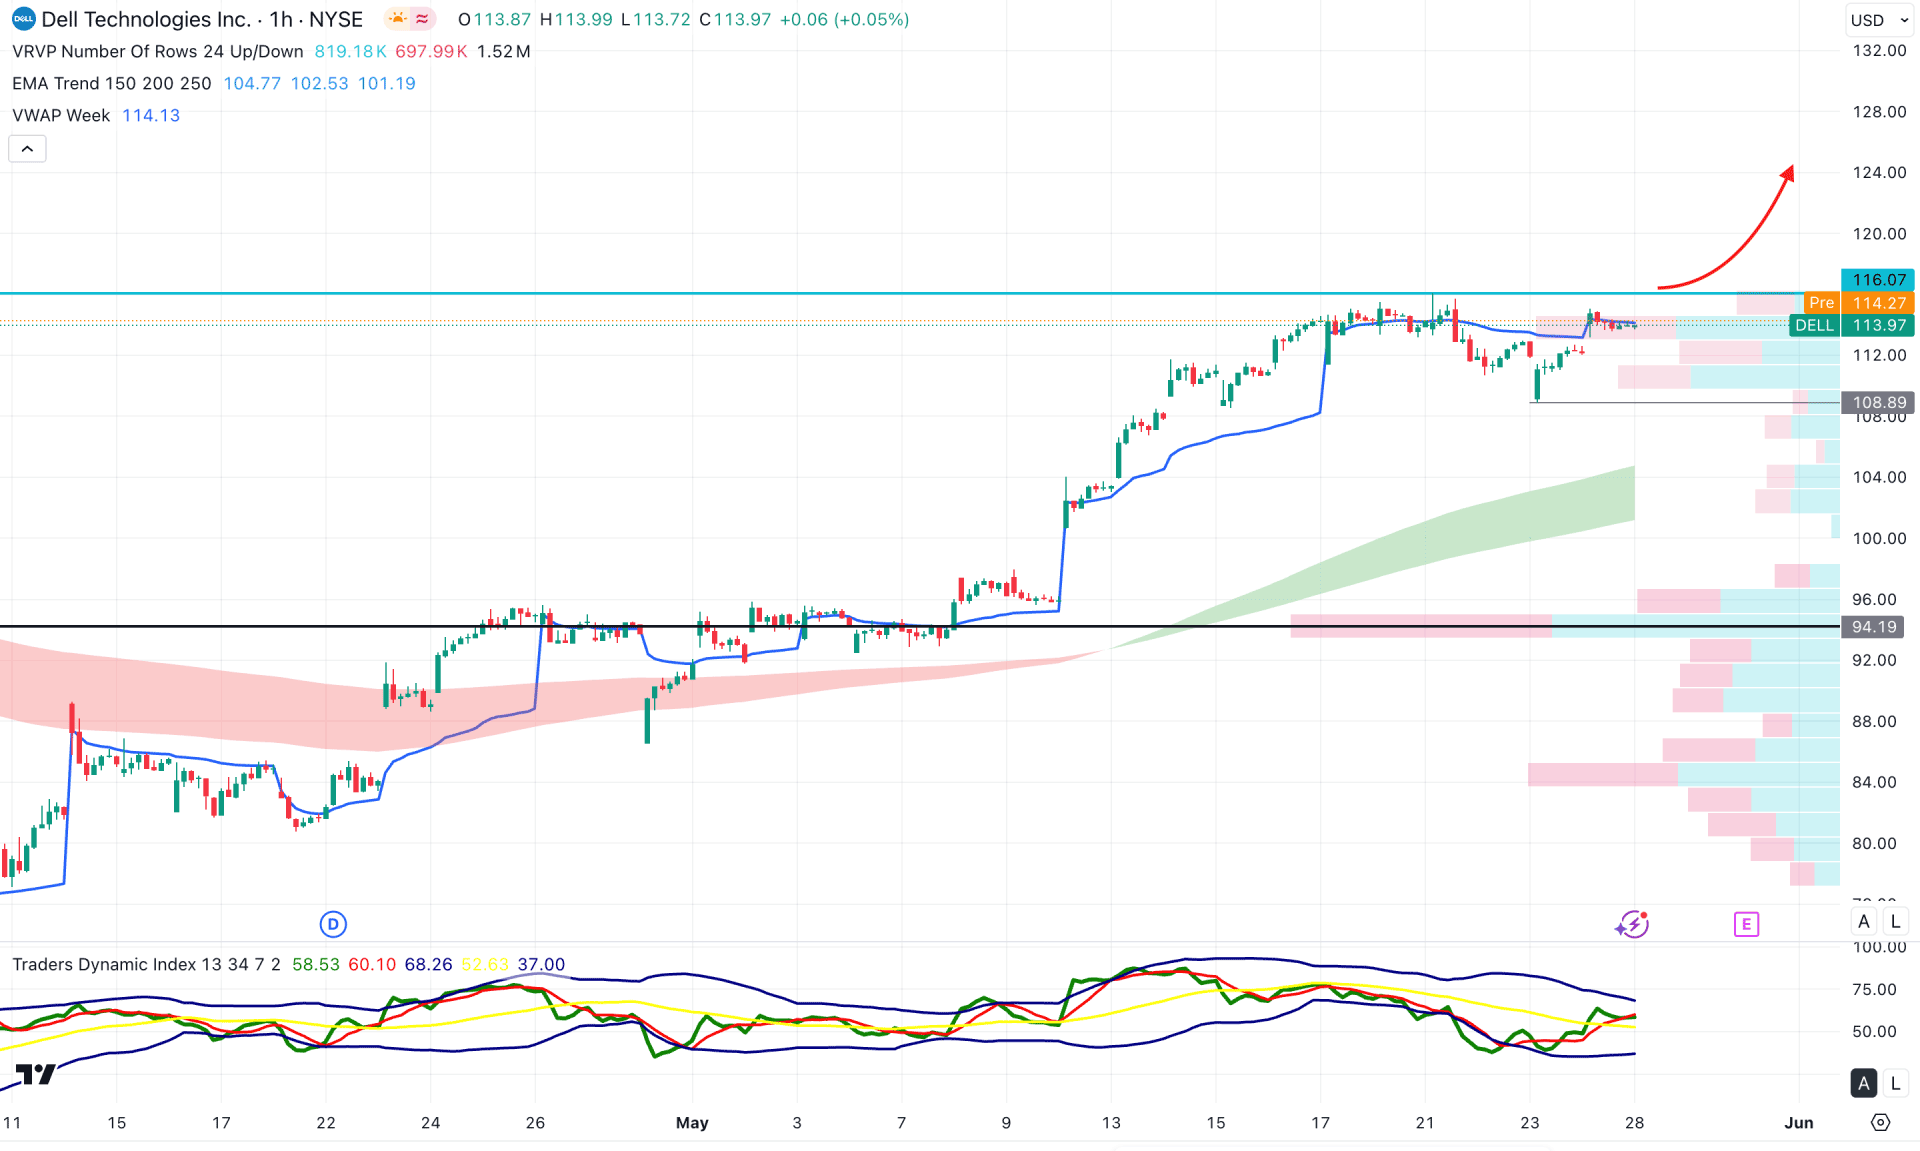
The recent price is trading sideways at the top in the hourly timeframe, from where more confirmations are needed before opening a long position. However, the intraday high volume line is below the current price, working as a major support.
The Traders Dynamic Index (TDI) hovers above the 50.00 line in the secondary indicator window, signalling an ongoing buying pressure.
Based on the hourly outlook, a bullish breakout with an hourly candle above the 116.07 level could be a long opportunity, aiming for the 132.00 area.
On the other hand, a deeper discount is possible if the price comes below the 108.89 level, which might offer another long opportunity from the 100.00 to 92.00 zone.
Based on the current market outlook, the ongoing bullish momentum could find fuel after having an upbeat earnings report. Investors should closely monitor the intraday price action as any minor dip with a valid price action could be an early long opportunity.


