Published: November 18th, 2025
Deere & Company (NYSE: DE) is an American corporation that produces large machinery drivetrains, diesel engines, landscaping equipment, and machines for forestry, construction, and agriculture. In addition, the corporation conducts a number of other business operations and provides financial services.
In the upcoming earnings report, Deere's sales are predicted to increase by 4.5% to $47.1 billion in fiscal 2026, while its adjusted earnings per share are anticipated to rise from $18.53 to $20.86. A 17.5% rise in operating income is expected to deliver a considerable improvement in segment profitability as advancements in productivity and operational leverage gain traction.
Deere & Company (NYSE: DE) has established large investments in technology and research and development (R&D) to offer a variety of data-enabled solutions for the agricultural sector. The company also emphasised Deere's forestry and construction division as a potential margin driver, utilising accurate machinery and road-building technologies, which was reinforced by its 2017 acquisition of Wirtgen.
Even if Deere's long-term prospects are still promising, analysts note that record U.S. harvests, falling crop prices, and persistent trade concerns might make 2025 a seasonal low point for profitability.
Let's see the upcoming price projection for this stock from the DE technical analysis:

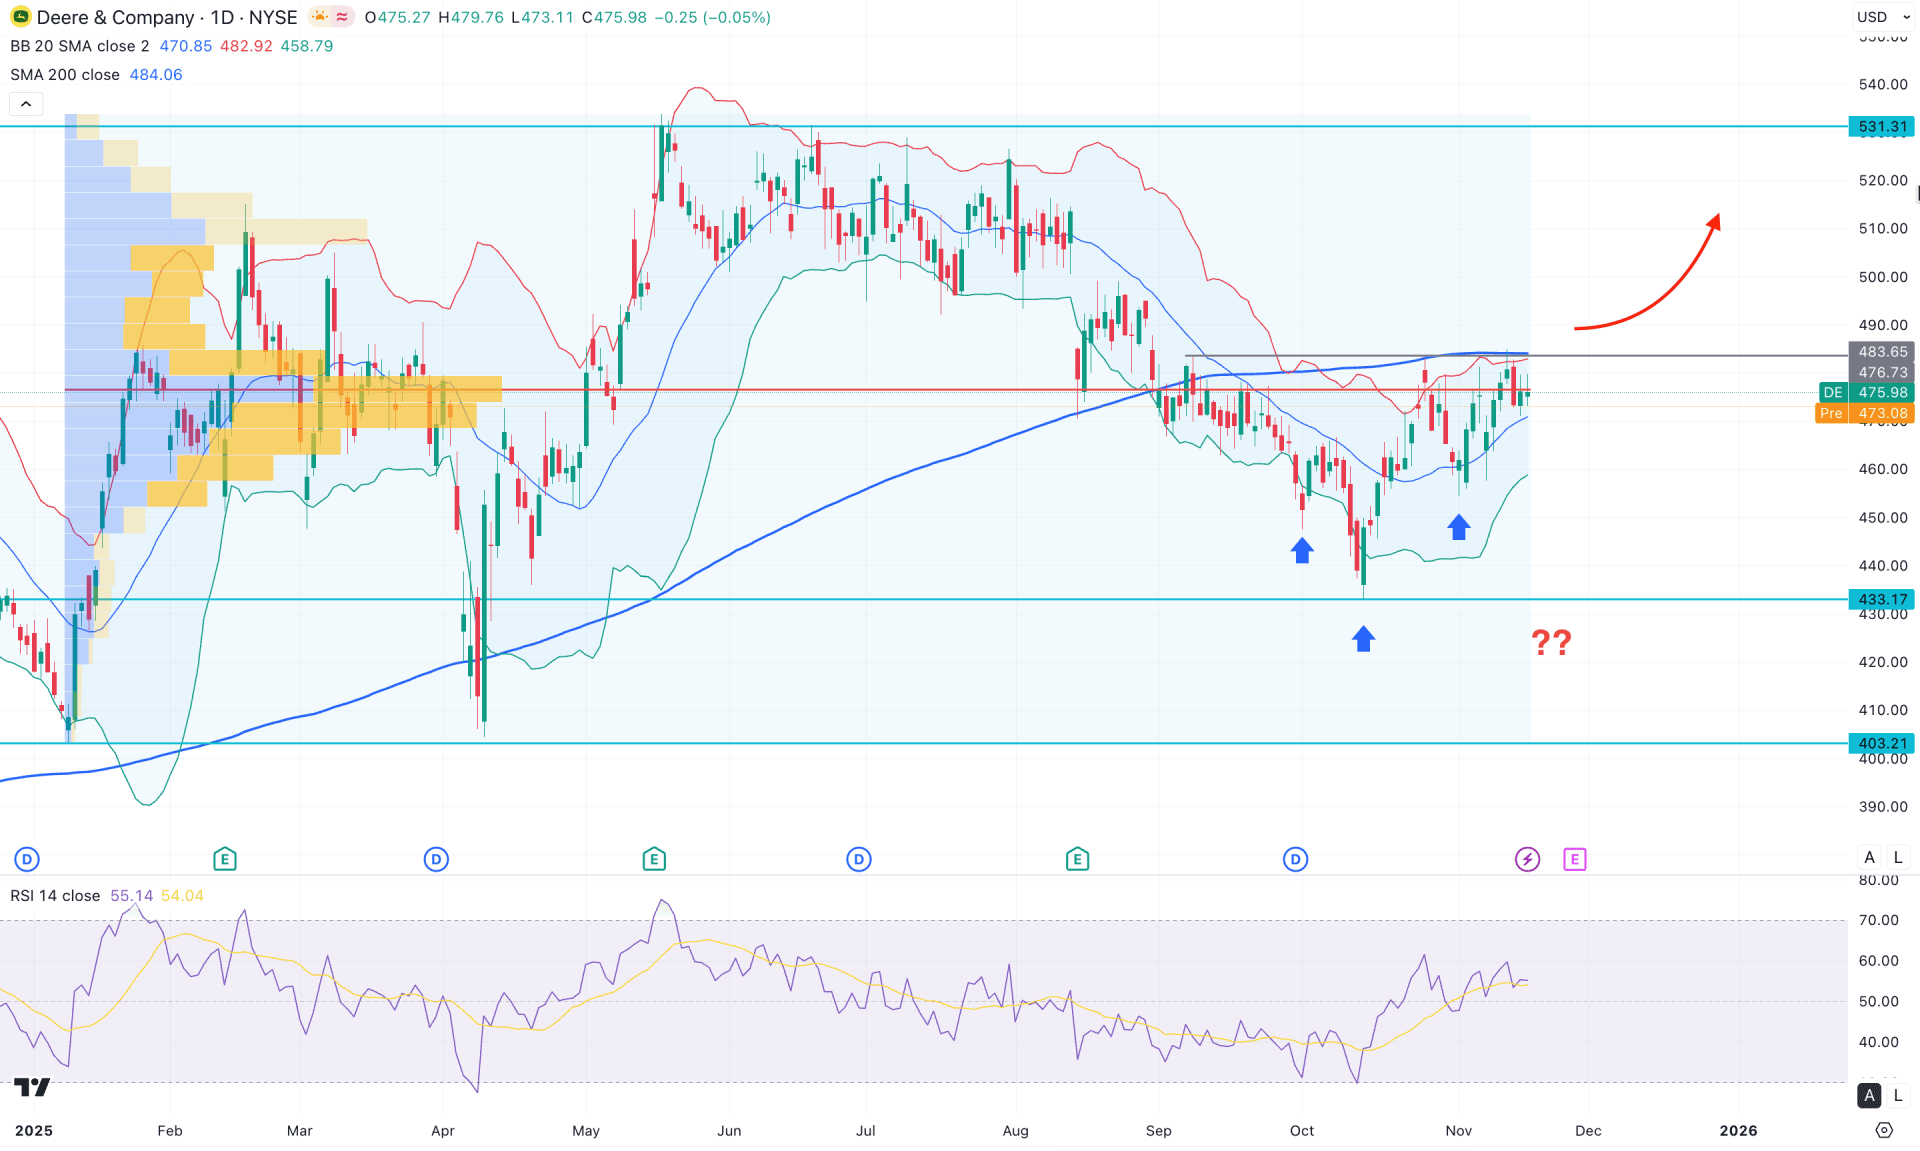
In the daily chart of Deere & Co stock (DE), the ongoing market momentum is corrective, as the recent price shows a strong bearish reversal within a major bullish trend. Initially, a strong bullish rebound from the 433.17 support level initiated a V-shaped recovery, but no significant buying pressure has been seen after the breakout.
Looking at the higher timeframe, ongoing bullish pressure is visible in the monthly chart, even with multiple sideways phases. As the current price is trading above the October 2025 high, a valid monthly close could signal a decent trend-trading opportunity supported by a strong trendline.
In terms of volume, accumulation is visible, with the largest activity zone positioned near the current price at the 476.73 level. As the recent price moves sideways, a strong breakout with a liquidity sweep could initiate a trend-trading opportunity at any time.
On the main price chart, the 200-day Simple Moving Average is acting as strong resistance at the 483.65 level. However, a strong bounce from the lower Bollinger Band, along with sideways movement above the mid-Bollinger Band level, signals a potential bullish breakout at any moment.
In the secondary indicator window, the Relative Strength Index is moving sideways but maintaining momentum above the 50-point neutral line. A sideways trend is also visible in the Average Directional Index, currently at 14.67. A stable RSI above the 50 line, combined with an ADX rebound above 20, may signal a shift in momentum in the main price chart.
Based on the overall market structure, a bullish breakout with a daily close above 483.65 could increase the probability of a move toward the 531.31 resistance level.
On the other hand, a buy-side liquidity sweep from the 480.60 level is possible, as sufficient buy orders may be present above the 200-day SMA. In that case, a strong bearish reversal with a daily close below the mid-Bollinger Band could extend the downside correction toward the 433.17 support level before a new long opportunity forms.
Additionally, an inverse head-and-shoulders pattern is emerging, where a valid break above the 483.65 neckline could open a long opportunity from the breakout.

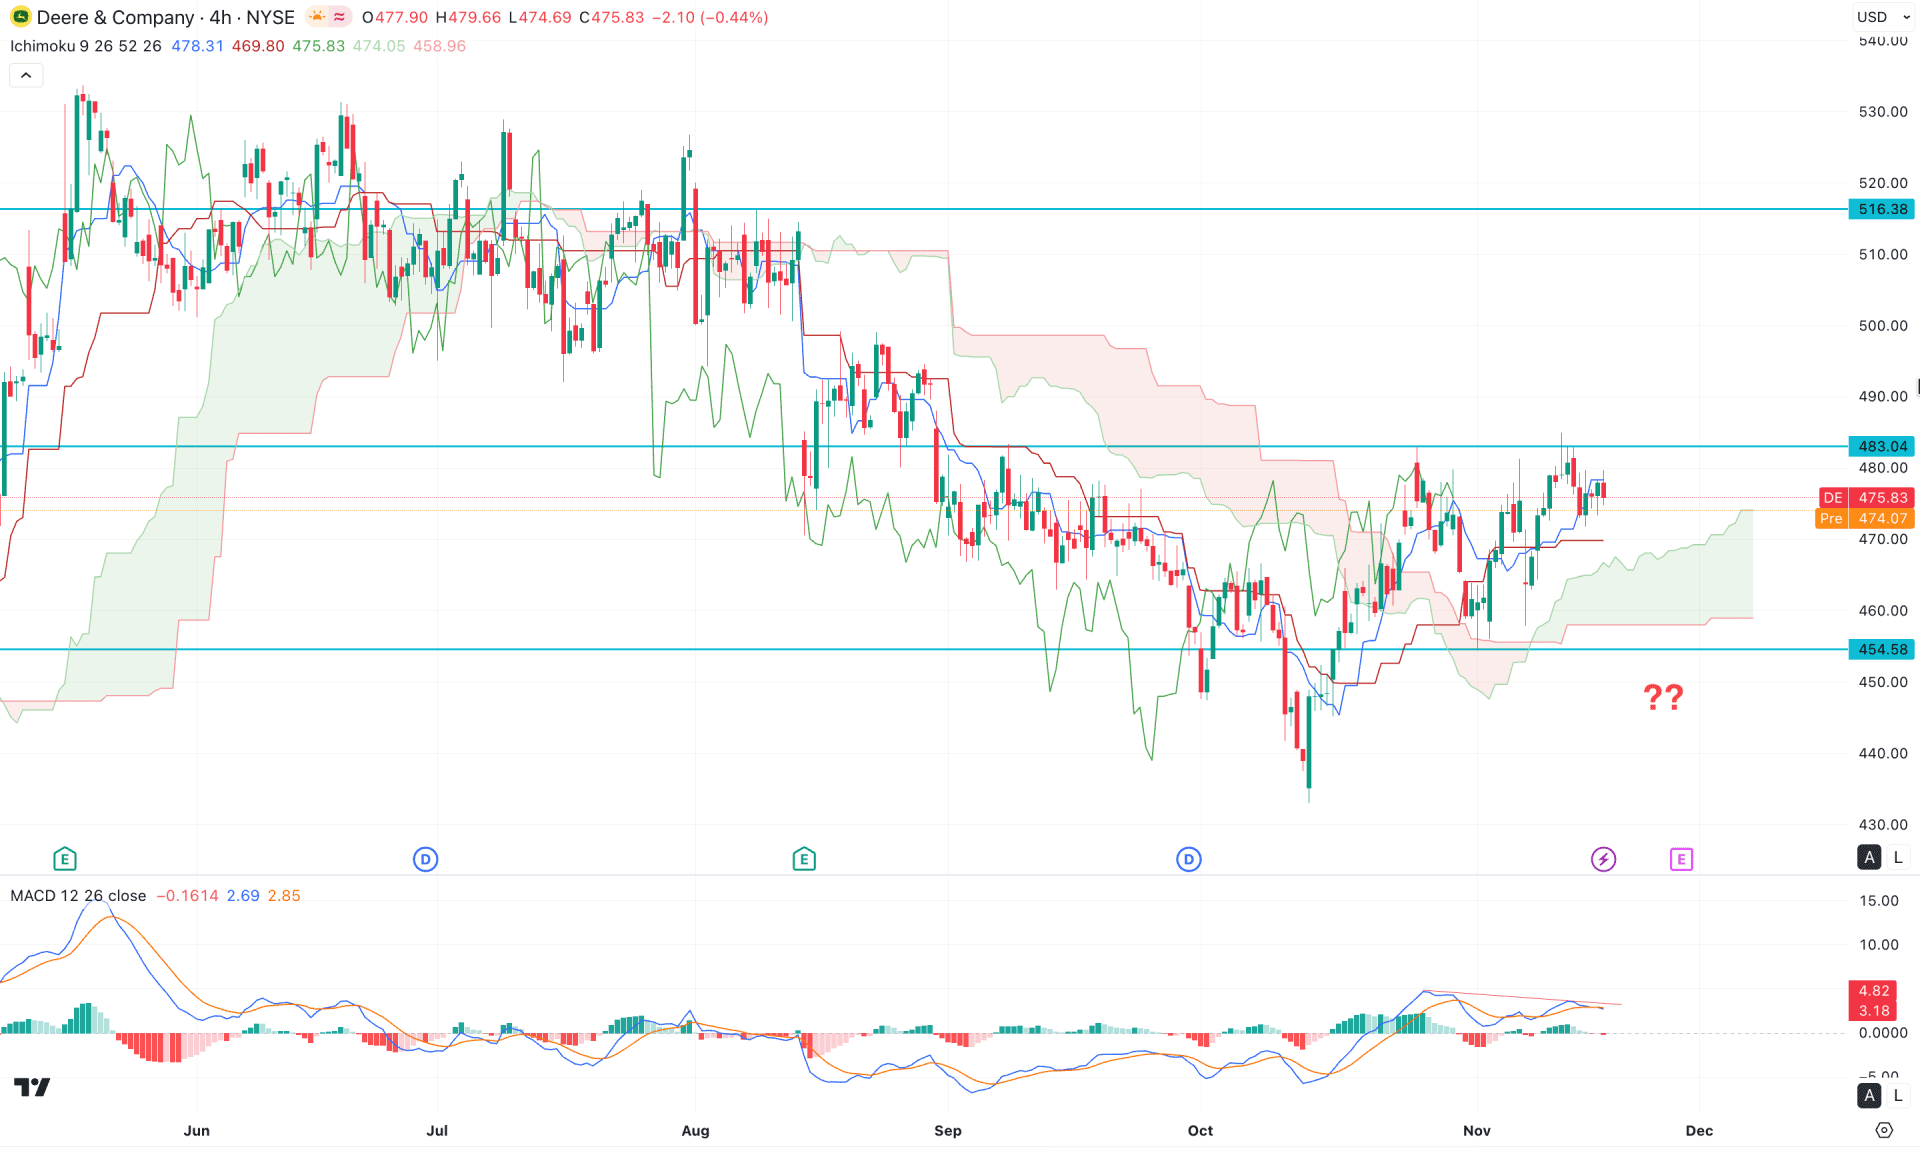
In the H4 timeframe, the recent price shows a bullish recovery above the cloud area, where the current price is trading sideways above the dynamic Kijun Sen level.
In the future cloud, both lines are heading upward, where the thickness is solid for taking the price higher.
However, the indicator window shows a different story where a divergence is formed with the price swing and the MACD signal line. Moreover, the histogram remains sideways with a negative vertical line below the neutral point.
Based on the H4 market structure, the price is facing strong resistance at the 483.04 level, which needs to be overcome before continuing the bullish trend. In that case, any strong bullish reversal from the dynamic line or cloud area with a candle close above the 483.00 level could be a highly probable long opportunity targeting the 516.38 level.
The alternative trading approach is to find a bearish break with an H4 below the 454.5 level, which could validate the cloud breakout targeting the 430.00 level.

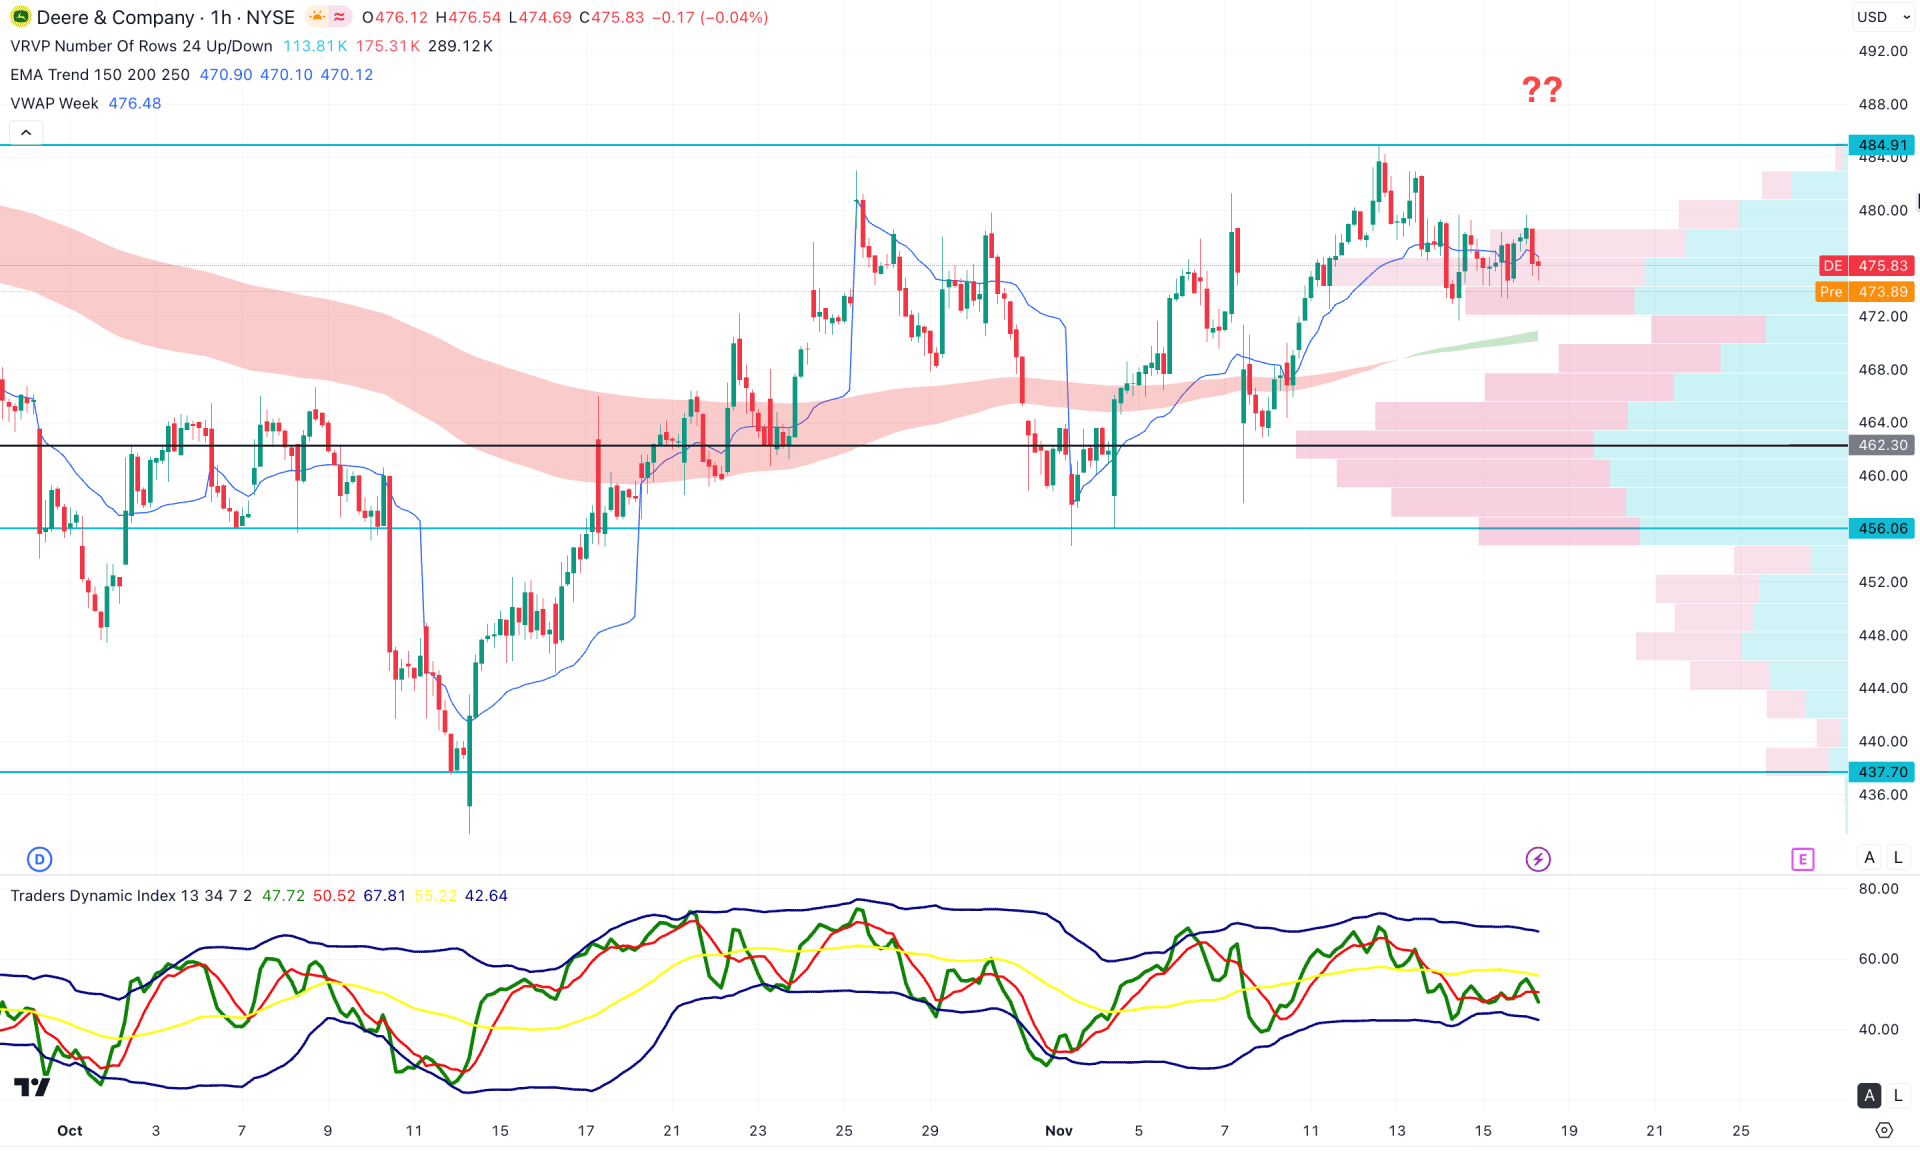
In the hourly timeframe, the recent price is trading sideways at the top with no sign of a bearish reversal. Moreover, the dynamic EMA wave is below the current price, working as an immediate support. The intraday high volume line is also below the current price, which could work as a strong barrier for sellers.
In the indicator window, the Traders Dynamic Index (TDI) is below the 50.00 neutral line, suggesting sellers' dominance in the market.
Based on this outlook, a minor downside correction is pending as long as the price trades below the 484.91 key resistance level. However, major dynamic lines are below the current price, working as a strong support zone. In that case, a failure to make a dip below the EMA wave with a bullish reversal could resume the existing trend.
Based on the overall market structure, the Deere & Co stock (DE) is trading within a corrective bullish trend where sufficient downside correction is pending.
Investors should closely monitor how the price trades at the resistance area, as a strong bullish break could be a highly probable bullish continuation signal.