
Published: November 16th, 2021
The long-term perspective of a crypto asset is important for investors and HODLers. If the aim is solid, any dip is a discount where traders can join the rally at any time. Based on the reliability and future potentiality, Decentralized (MANA) is potential due to its virtual reality platform, backed by Ethereum blockchain, where people can create, experience, and monetize their content and apps.
Decentraland initiated the operation with a $24 million initial coin offering in 2017. Later on, they closed the beta in 2019 and opened for the public in 2020. Since then, this platform has become interested in investors due to its interactive games, impressive 3D scenes, and other experiences.
Apart from the project, investors have seen Bitcoin and other cryptocurrencies fall sharply while the BTC/USDT reached near the $60,000 value. Among other cryptocurrencies, Ethereum, BNB, Solana, Cardano, SHIBA Inu have lost their value by around 7% to 10%. As per the analyst’s estimation, this sudden crash has wiped out about $400 billion from the broader crypto market, reaching a record high of $3 trillion a week ago.
Following the broader crypto crash, MANA/USDT has lost around 10% in the last 24 hours, where the trading volume was up by 3.2% or $2,172,241,506. Let’s see the upcoming price direction from the MANA/USDT technical analysis:
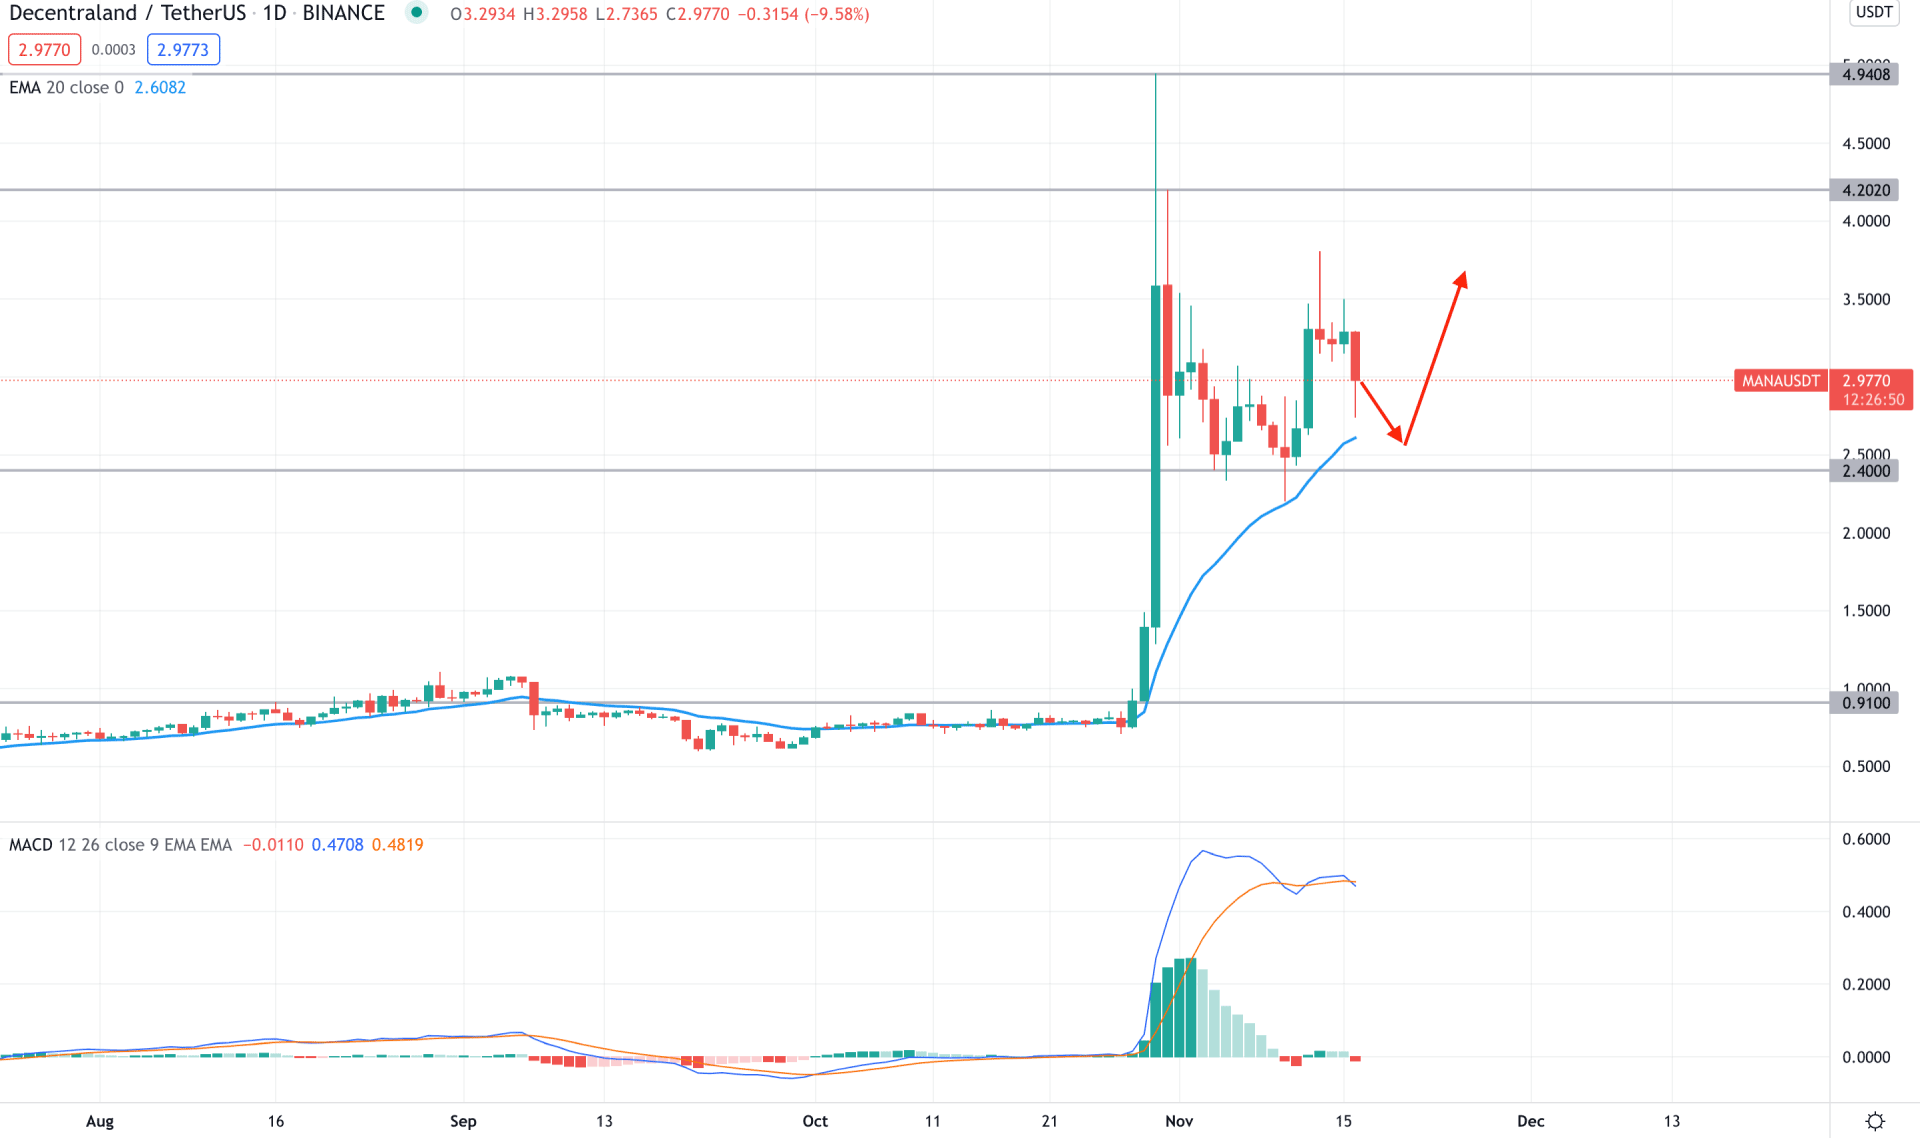
Since the beginning of 2021, MANA/USDT remained corrective, but the price became interesting as soon as it shot higher in the last week of October 2021. The price shot higher from 0.9100 key resistance level and reached 4.94 level with more than 500% gains within three days. Later on, the price moved lower and is still trading above the 50% level of the massive swing in October.
The above image shows how the price consolidates above the 2.400 key support level, where the dynamic 20 EMA is approaching the price. Meanwhile, the MACD Histogram remained bearish while the MACD line was above zero with strong bullish momentum. In this context, investors should closely monitor how the price reacts from the dynamic 20 EMA; any bullish rejection from the 2.700 to 2.400 area with a bullish daily close may resume the current bullish trend towards the 4.20 level. On the other hand, a break below the 2.40 level would open a selling opportunity with the target of 0.9100 level.
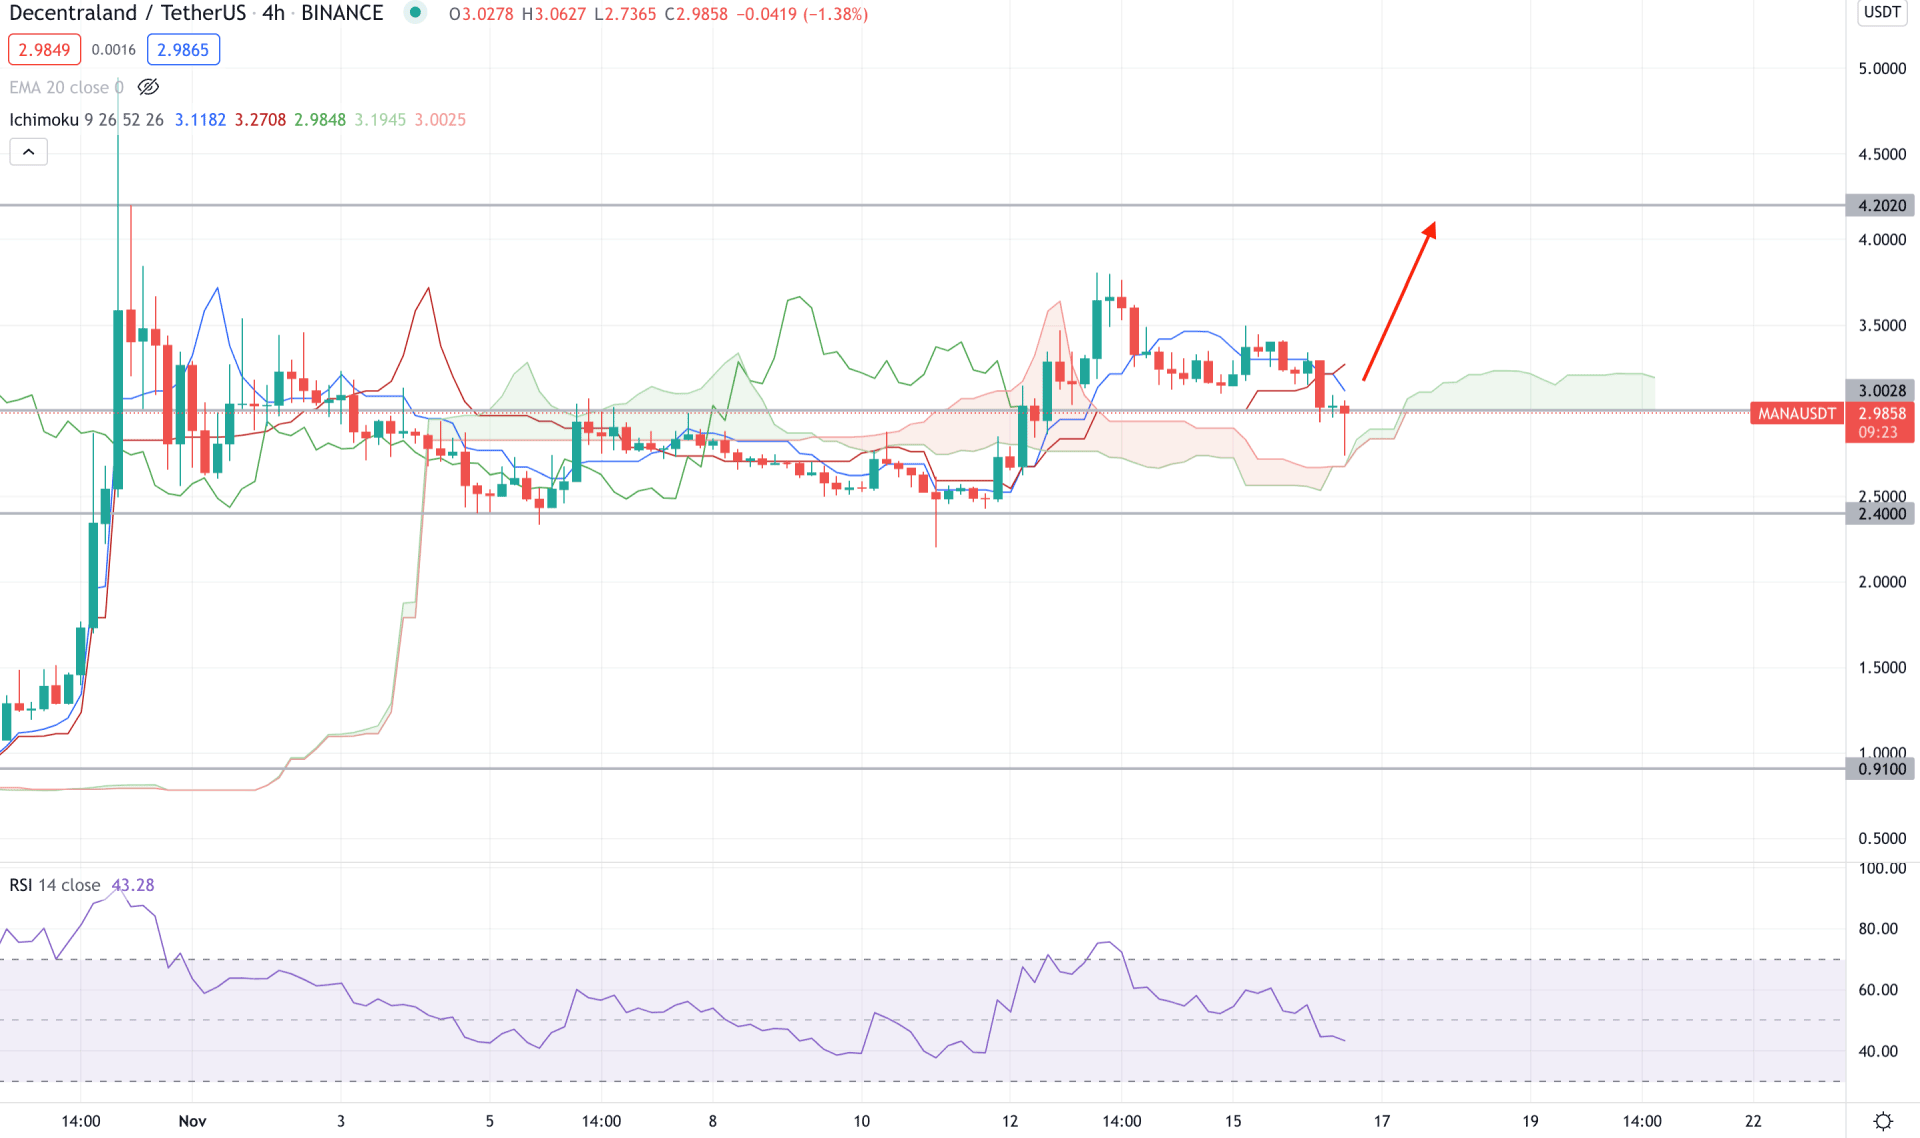
In the H4 chart, MANA/USDT is still within the buyer’s zone as the price is above the Kumo Cloud while the future cloud is bullish. In addition, Senkou Span A is above Senkou Span B in the future cloud while the Lagging Span is near the price. Moreover, the lower part of the Future Cloud remained closer to the static 3.00 key support level from where a bullish rejection would be encouraging for bulls.
The above image shows the H4 chart of MANA/USDT where the Tenkan Sen and Kijun Sen showed a bearish crossover while the current price is below them. In this context, a bullish H4 close above the Kijun Sen would increase the buying possibility where the ultimate target should be at 4.200 key resistance level.
On the selling side, RSI moved below the 50 levels where an H4 close below the Cloud support would take the RSI at oversold 30 areas. In that case, any rejection from the 2.40 level would be another buying opportunity for MANA/USDT bulls, where a break below this level would lower the price towards the 0.9100 area.
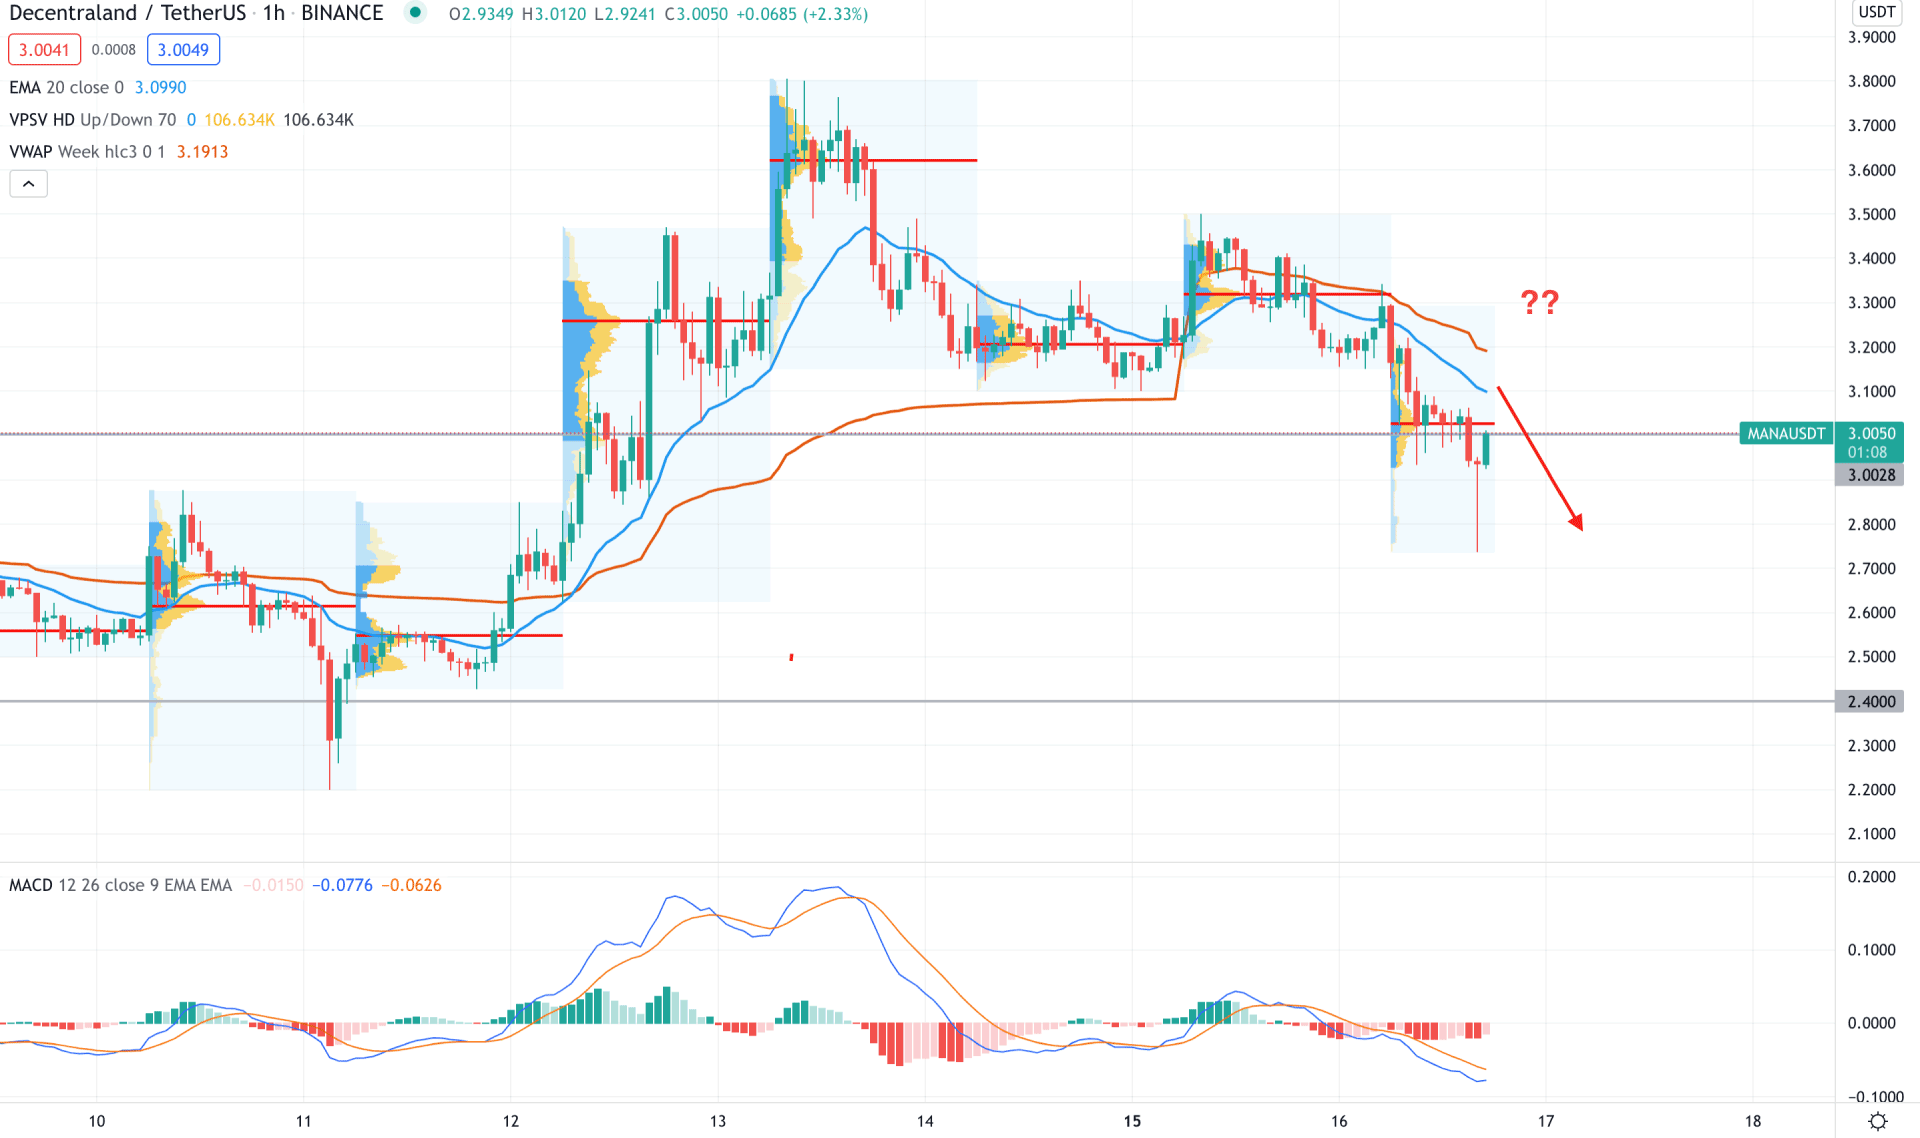
MANA/USDT formed a potential Head and Shoulder pattern in the intraday chart where the neckline breakout happened below the 3.00 level. However, the bearish pressure below the 3.00 level is exhausted with a bullish pin bar. Therefore, the most immediate event level of 3.00 is important to investors where the dynamic 20 EMA and weekly VWAP is above the price and working as minor resistance.
The above image shows how the price showed a bullish rejection where the most recent high volume level is at 3.02 level. In that case, a bullish H1 close above the dynamic 20 EMA with a positive mACD Histogram would be a decent buying opportunity in this pair to test the 4.00 level. On the other hand, any bearish rejection with an H1 candle close below the 2.90 would lower the price towards the 2.40 area.
As per the current market condition, MANA/USDT bullish possibility is valid as long as bulls hold the price above the 2.40 key support level. Based on the intraday chart, any bullish activity above the H4 Cloud Support would be the best buying opportunity in this pair. On the other hand, a break below the 2.40 level with a bearish D1 close would lower the price towards the 0.9100 level.


