Published: January 27th, 2022
Decentraland provides a 3D virtual platform on the Ethereum blockchain using the power of Metaverse. Here people can buy virtual lands, houses, assets and gain from the price appreciation.
According to the report from an AI-based predictive platform, there could be a strong surge in rentals and exchanges of digital real estate assets in the Metaverse. In that case, investors could experience assets like Decentraland with adoption to the on-chain activity. Some analysts said that projects like Decentraland have a clear connection to the activity of the sub aggregated value of its network. In that case, we can expect that the strong position of the Ethereum blockchain might work as a price driver for MANA.
As per the latest data, the cyberpunk-themed Atheria is the largest place in the Decentraland among 8000 lands. Besides, there are many decentralized autonomous organizations (DAO) projects in this system. Therefore, MANA-holders can hold power to control the system with their voting power and types of contents allowed to share in this system.
The current market cap of this instrument is $4,053,219,022 with last 24 hours trading volume at $828,736,670, representing a 37% increase in volume.
Let’s see the upcoming price direction from the MANA/USDT technical analysis:
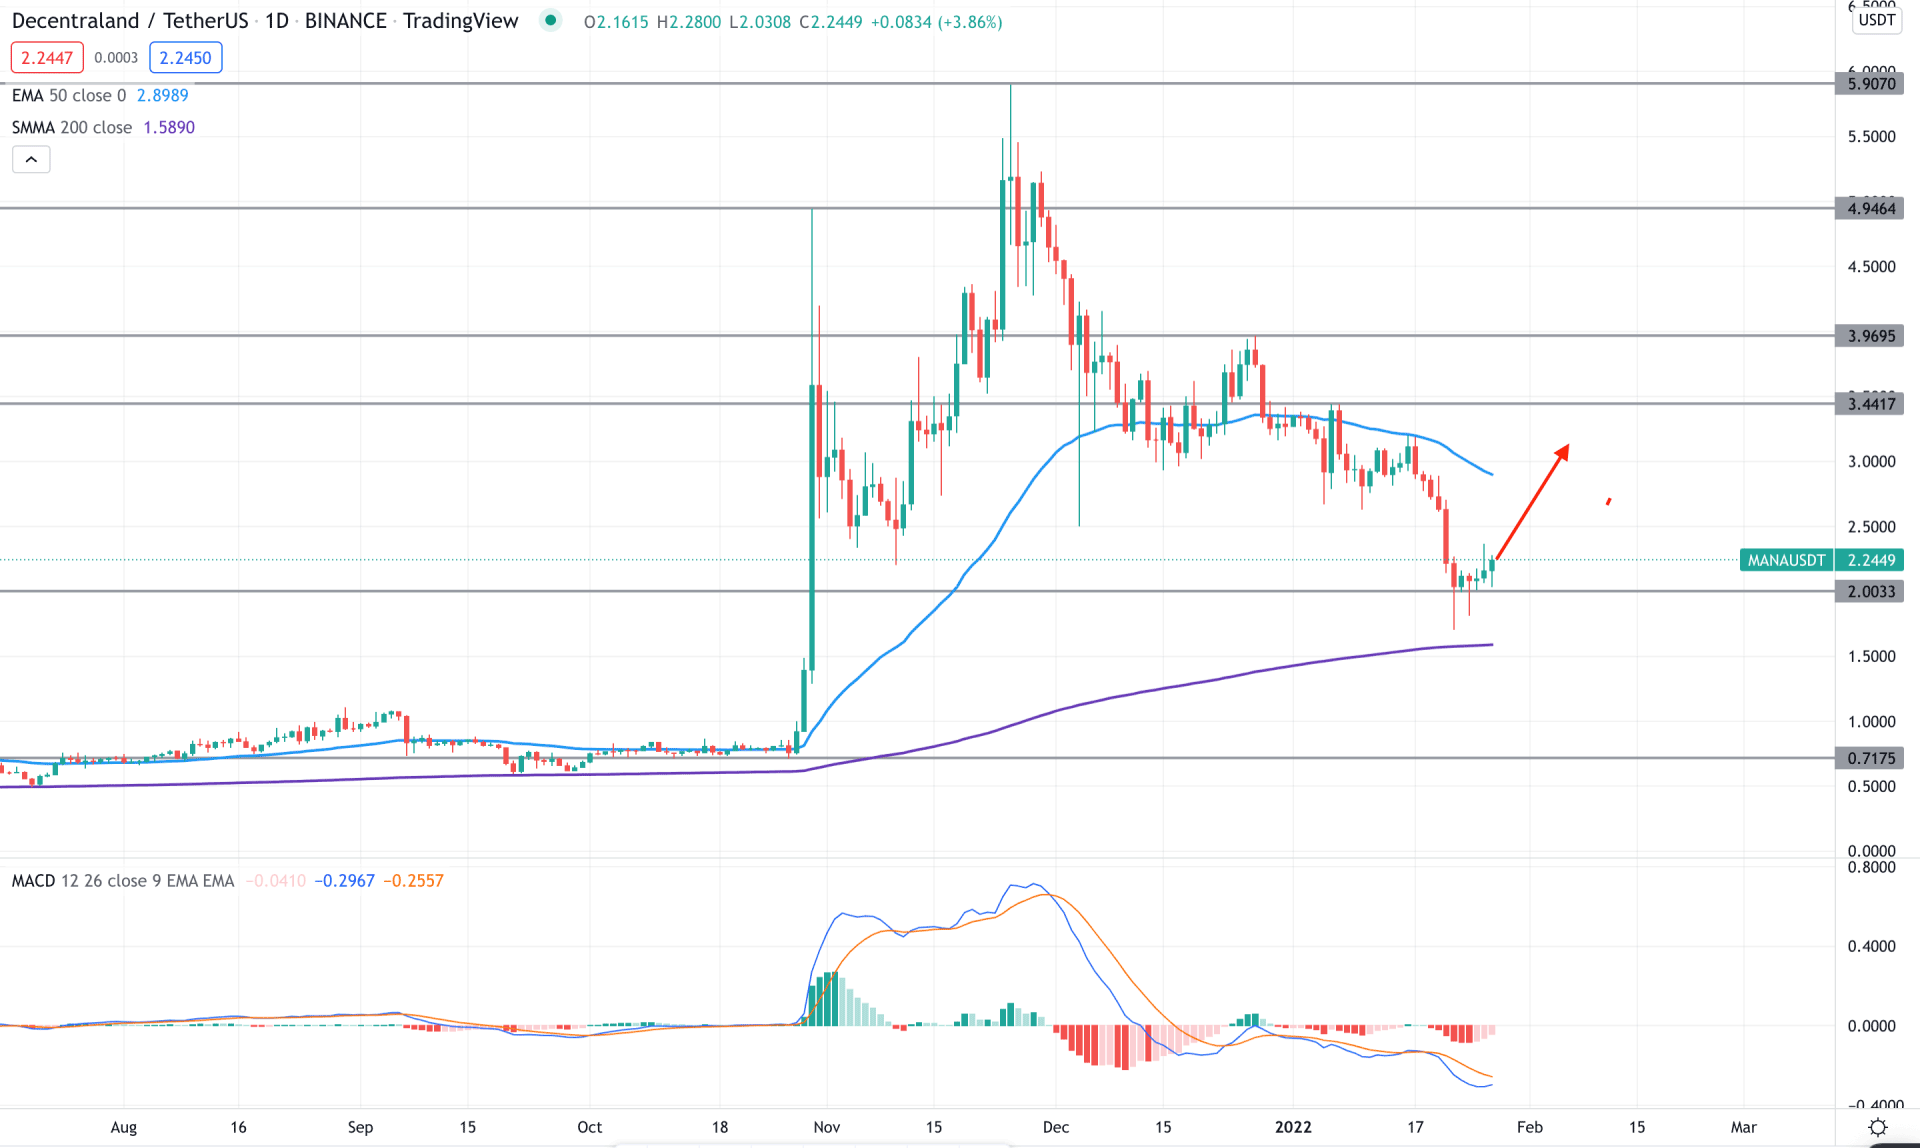
The broader crypto market is bearish where the negative sentiment came from the Russian crypto ban news and stronger US dollar after the FOMC. Therefore, investors might not see a huge surge in any crypto asset while some corrective bullish pressure is still pending. Although the current price of MANA/USDT is above the 200 SMA while the 50 EMA is sloping down.
The above image shows how the MACD Histogram showed a corrective bearish pattern while the MACD line remained lower. However, a bullish correction as a mean reversion to the 50 EMA is also pending as the price holds steady above the 200 SMA
Based on the daily price structure, investors should experience a buying pressure in the MANA/USDT chart as long as bulls hold the price above the 2.00 level. In that case, the primary target of the bullish pressure is 50 EMA area. On the other hand, a break below the 200 SMA area would increase the selling pressure towards the 1.00 level.
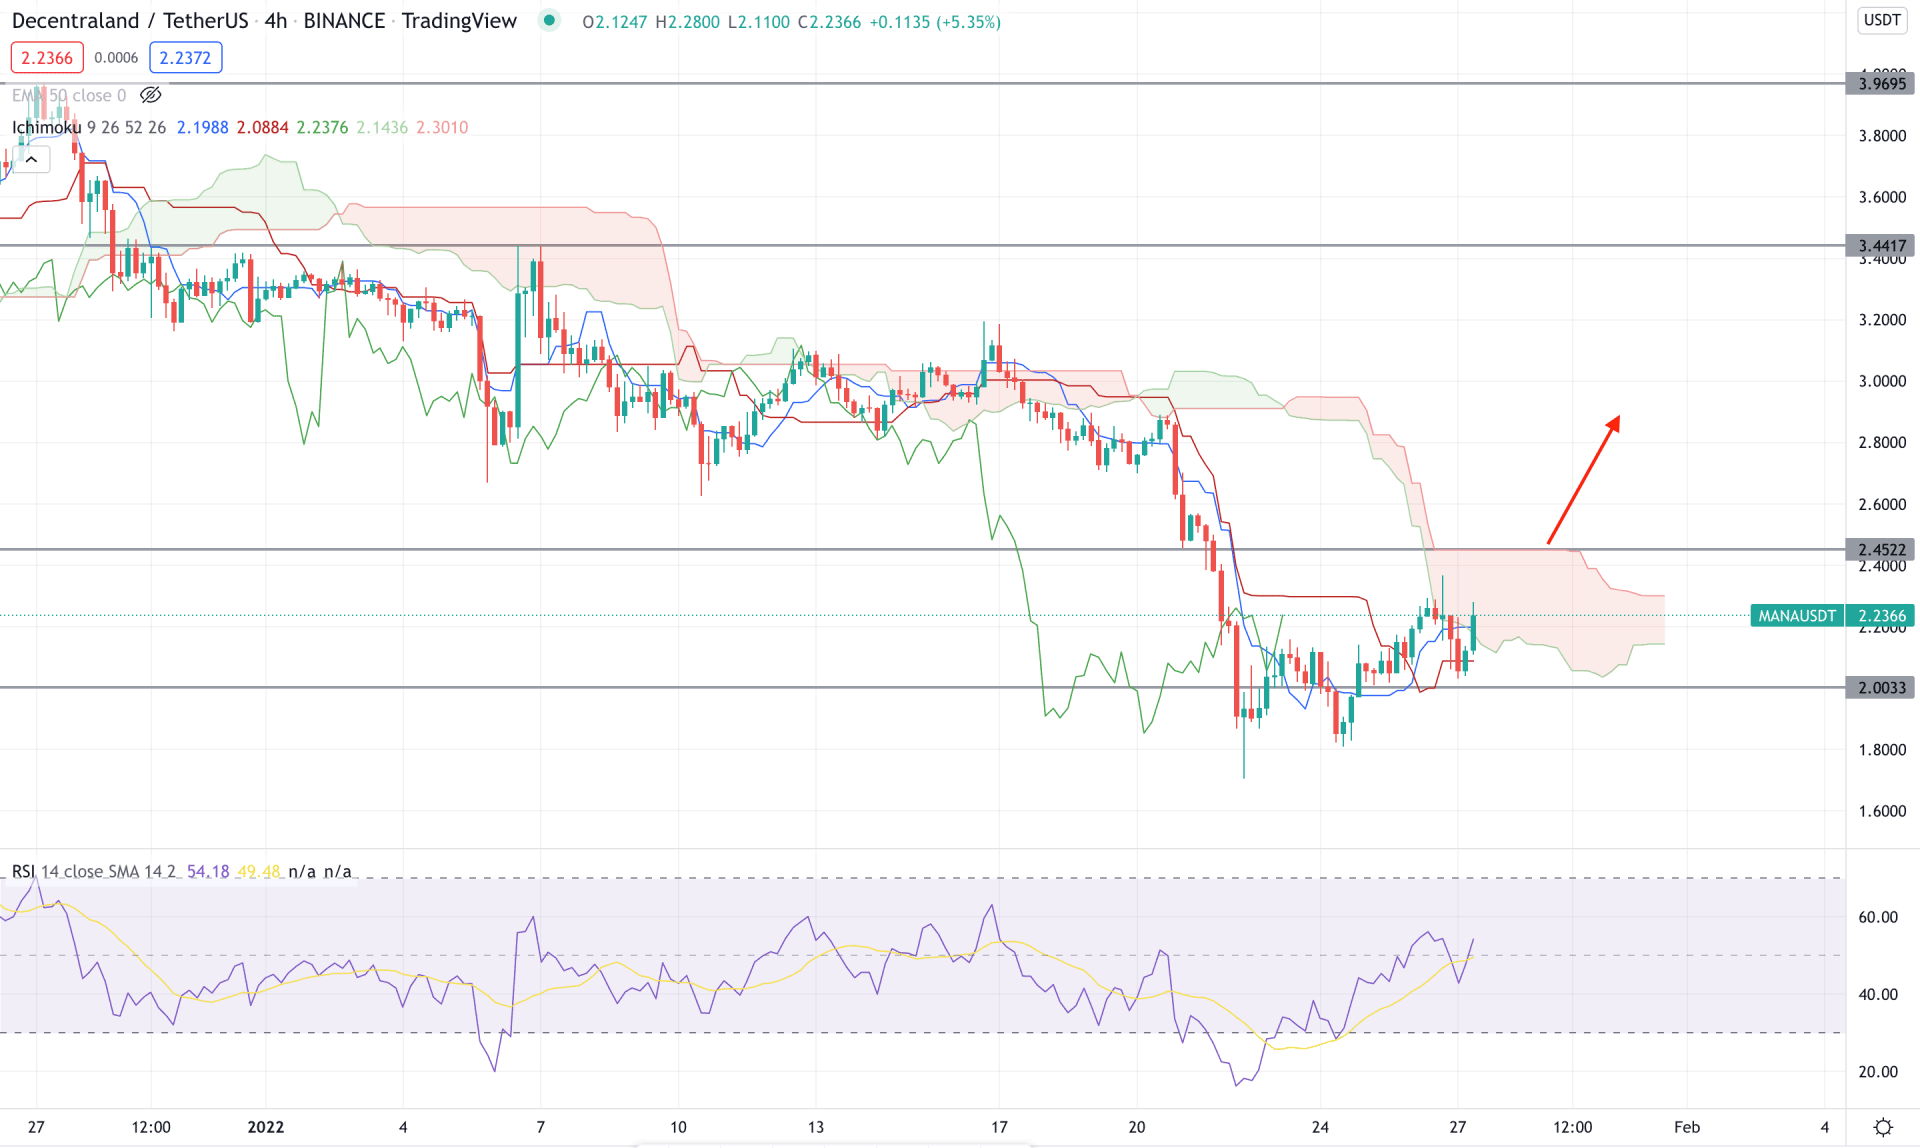
According to the Ichimoku Cloud analysis, MANA/USDT is trading within a bearish pressure where the current price is facing a minor resistance from the Kumo Cloud while the future coloud remained bearish. However, the volatility from testing the 2.00 level is a sign that bulls are attempting to gain a momentum which is not confirmed yet.
The above image shows how the RSI level rebounded higher from the potential 30 oversold zone and reached above the 50 level. On the other hand, there is a bullish crossover in the dynamic Tenkan Sen and Kijun Sen while the current price is above those levels.
Therefore, based on the current price structure, investors should find the price above the 2.45 static resistance level with a bullish H4 close to see the price at 3.40 area. On the other hand, a break below the 2.00 level with a bearish H4 close would increase the selling pressure towards the 1.00 area.
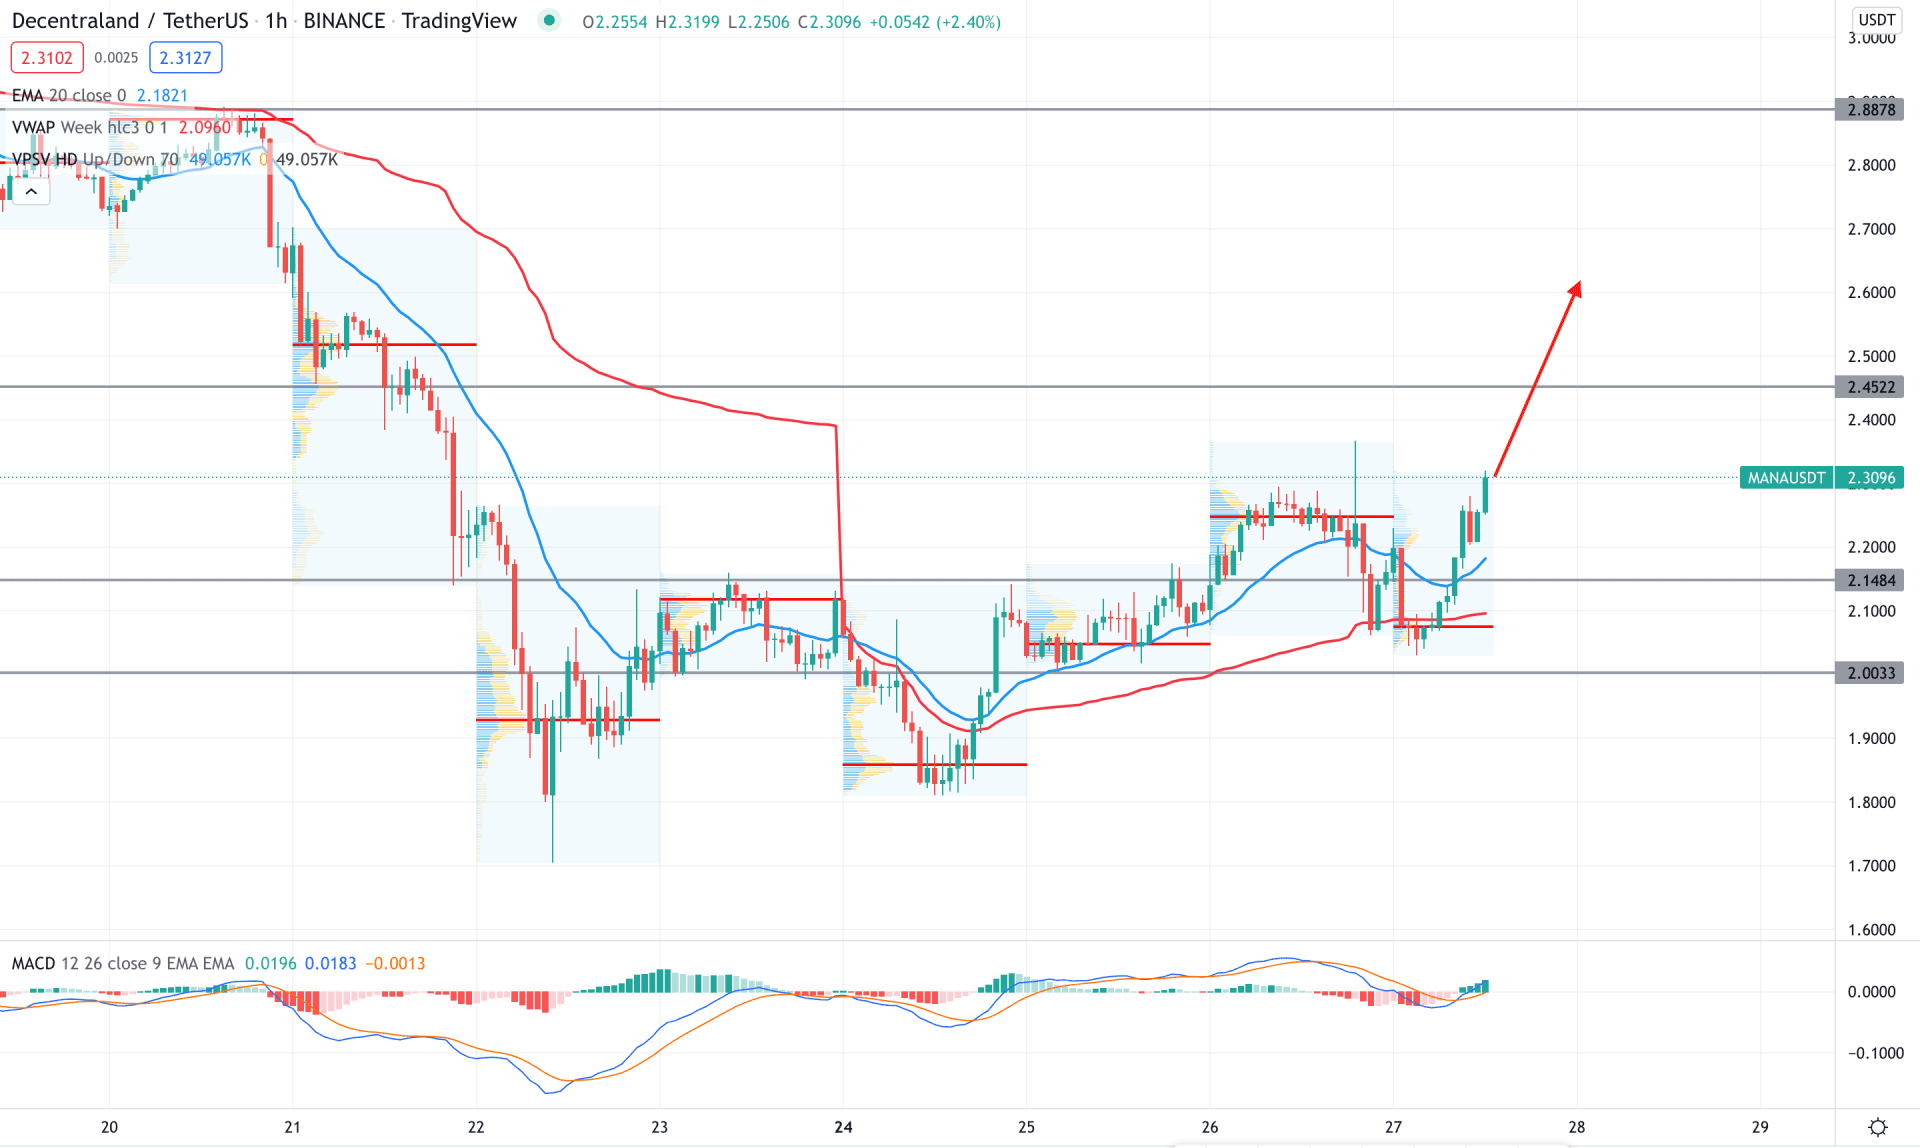
In the MANA/USDT H1 chart, the price is trading with a strong bullish momentum as bulls took the price above teh dynamic 20 EMA with a strong buying pressure. Moreover, the most recent high volume level is below the price that pushed it higher with a solid momentum.
The above image shows how the MACD Histogram changed the direction from bearish to bullish by taking the Histogram up. On the other hand, the dynamic 20 EMA and weekly VWAP are below the price and provide a bullish sentiment. Therefore, as long as the price trades above the 2.14 support level it has a higher possibility of moving up towards the 2.45 level in the coming hours. On the other hand, a break below the 2.00 level may alter the current market structure with a bearish pressure towards the 1.00 level.
As per the current market context, MANA/USDT has a higher possibility of showing a bullish pressure in the coming days where the primary price target is $3.00 level. However, investors should wait for the price to move above the 2.45 resistance level in the H4 chart to find a reliable buying position.


