

Published: October 28th, 2026
Dash (DASH), a privacy-focused cryptocurrency, continued its recovery, trading above $50 after a 3%+ gain and closing above a key resistance zone. Improving derivatives metrics and increasing social dominance indicate strengthening market sentiment. A positive technical outlook also suggests the potential for further gains.
Derivatives data indicates improving sentiment among Dash traders. According to CoinGlass, funding rates for DASH turned positive on Saturday and climbed to 0.0041% on Tuesday. This means long-position holders are paying short-position holders, signalling a bullish market outlook.
Additionally, CoinGlass data shows that Dash's long-to-short ratio stood at 1.02 on Tuesday. A reading above one suggests bullish sentiment, as more traders are positioning for a potential price increase.
Santiment's Social Dominance metric for DASH also points to a positive outlook. The indicator measures the proportion of DASH-related discussions across cryptocurrency media. It has been rising since mid-October, reaching 0.275% on Tuesday. This increase reflects growing interest and improving sentiment among Dash investors, which could support further price recovery.
Let's see the full price prediction from the DASH/USDT technical analysis:
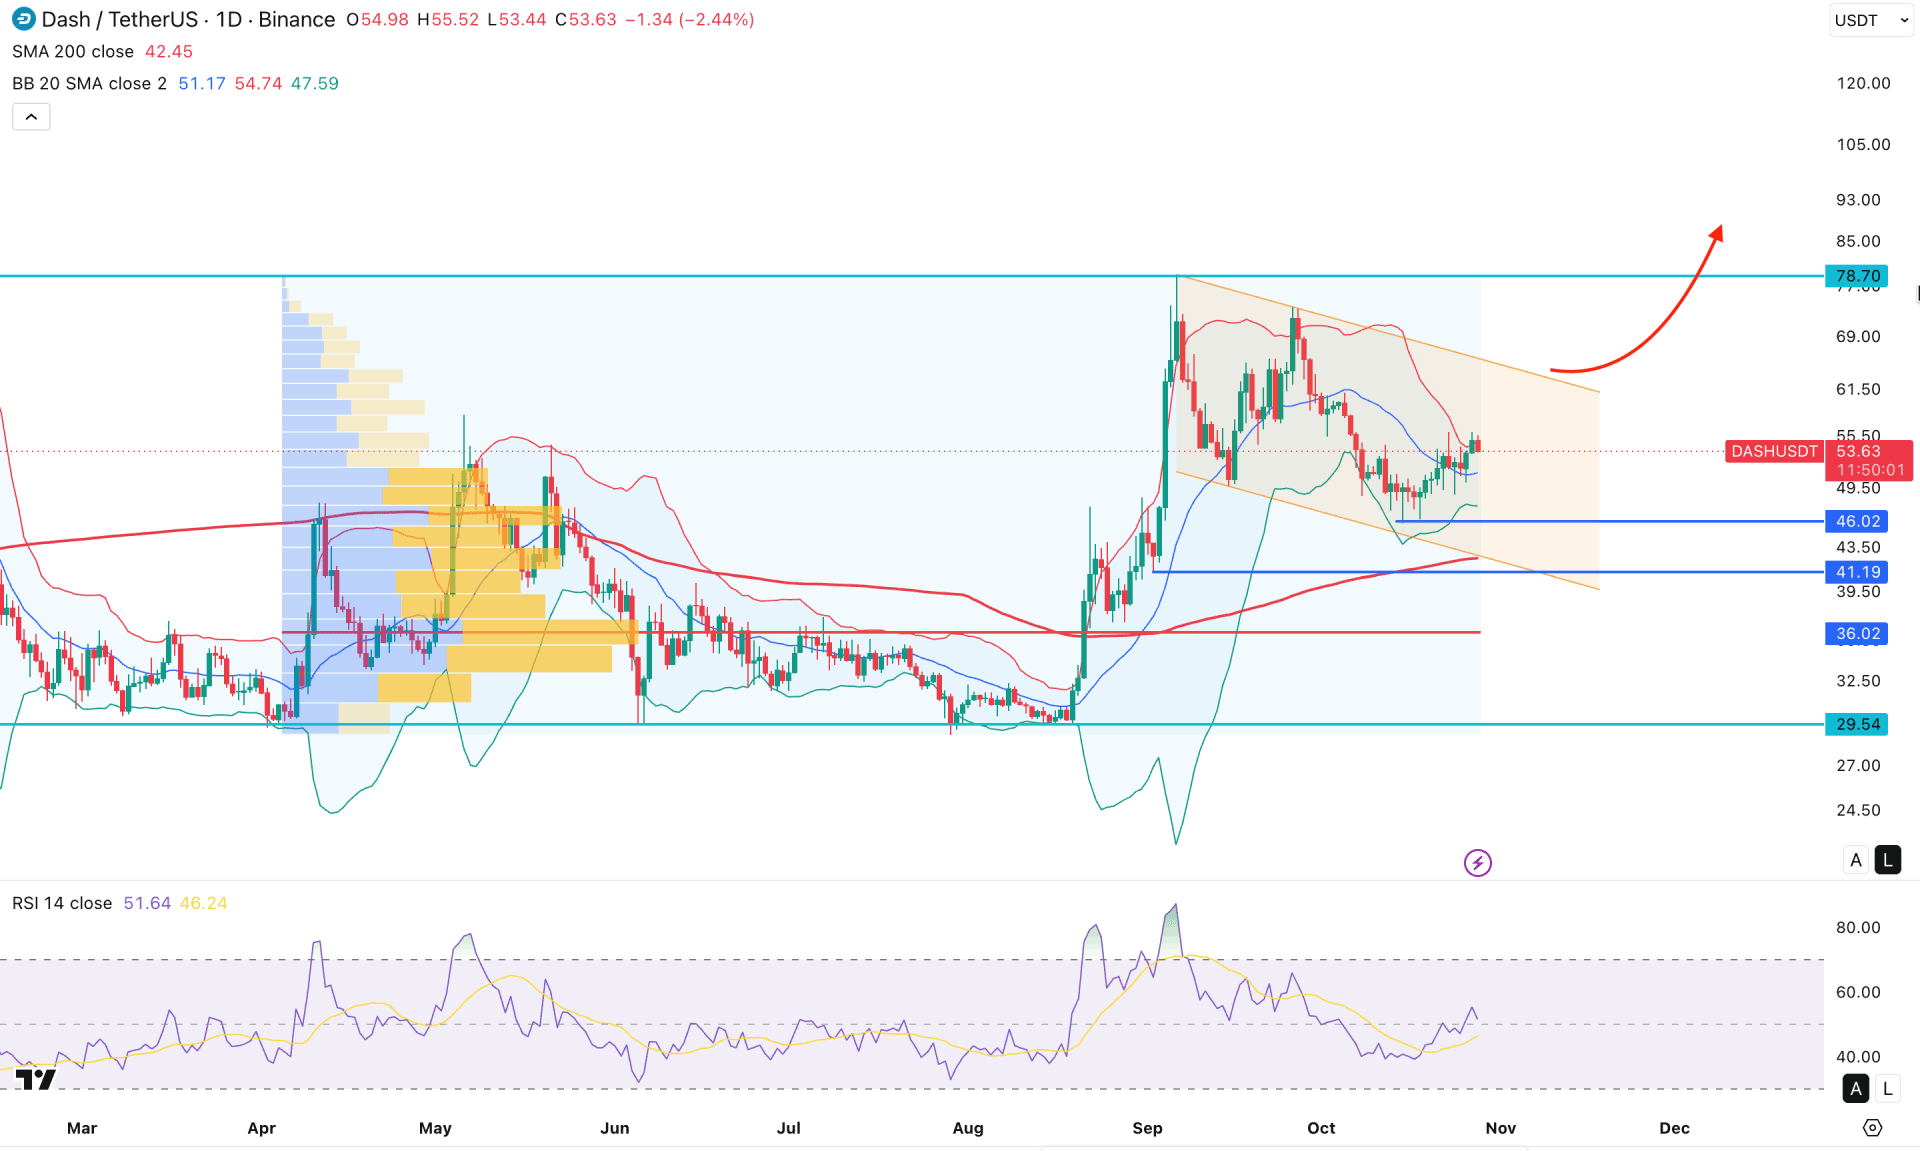
On the DASH/USDT daily chart, price has been sideways after forming a bullish impulse at the 78.70 top. As price moves sideways while momentum remains bullish, we may consider a bullish continuation at any time.
On the higher timeframe, price action looks sideways, where the existing structure remains bullish. On the monthly chart, two consecutive bullish candles push prices above the 50.00 level. Moreover, the weekly timeframe shows a similar structure, with a valid weekly top and no sign of a pump-and-dump.
On the higher daily chart, volume structure remains positive for buyers, as the largest activity level since April 2026 is at 36.02, below the current price. As long as the high-volume line remains below the current area, the primary bias is a bullish continuation.
In the main price chart, the major structure is bullish, as the 200 SMA is below the current price with a bullish slope and the 36.02 high-volume line.
On the other hand, the price rebounded from the lower Bollinger Band level and is currently residing above the middle area, signaling an active band in the market. However, sideways market momentum is a key factor to consider, as it signals increased volatility that can reduce the likelihood of trend formation.
In the secondary indicator, the Relative Strength Index remains above the 50.00 neutral level. Moreover, the recent recovery with a touch of 60.00 signals a possible continuation.
Based on the overall market structure, DASH/USDT is trading within a bullish continuation momentum, while the most recent price is trading within a descending channel structure. As price bounced from 46.02, there is a higher chance of more buying pressure around 78.70.
On the bearish side, the immediate support is at 46.02, while deeper downside pressure is possible at 41.19 before a bullish rebound. Extended pressure below 41.00 could increase the possibility of a move to 29.54 in the coming days.
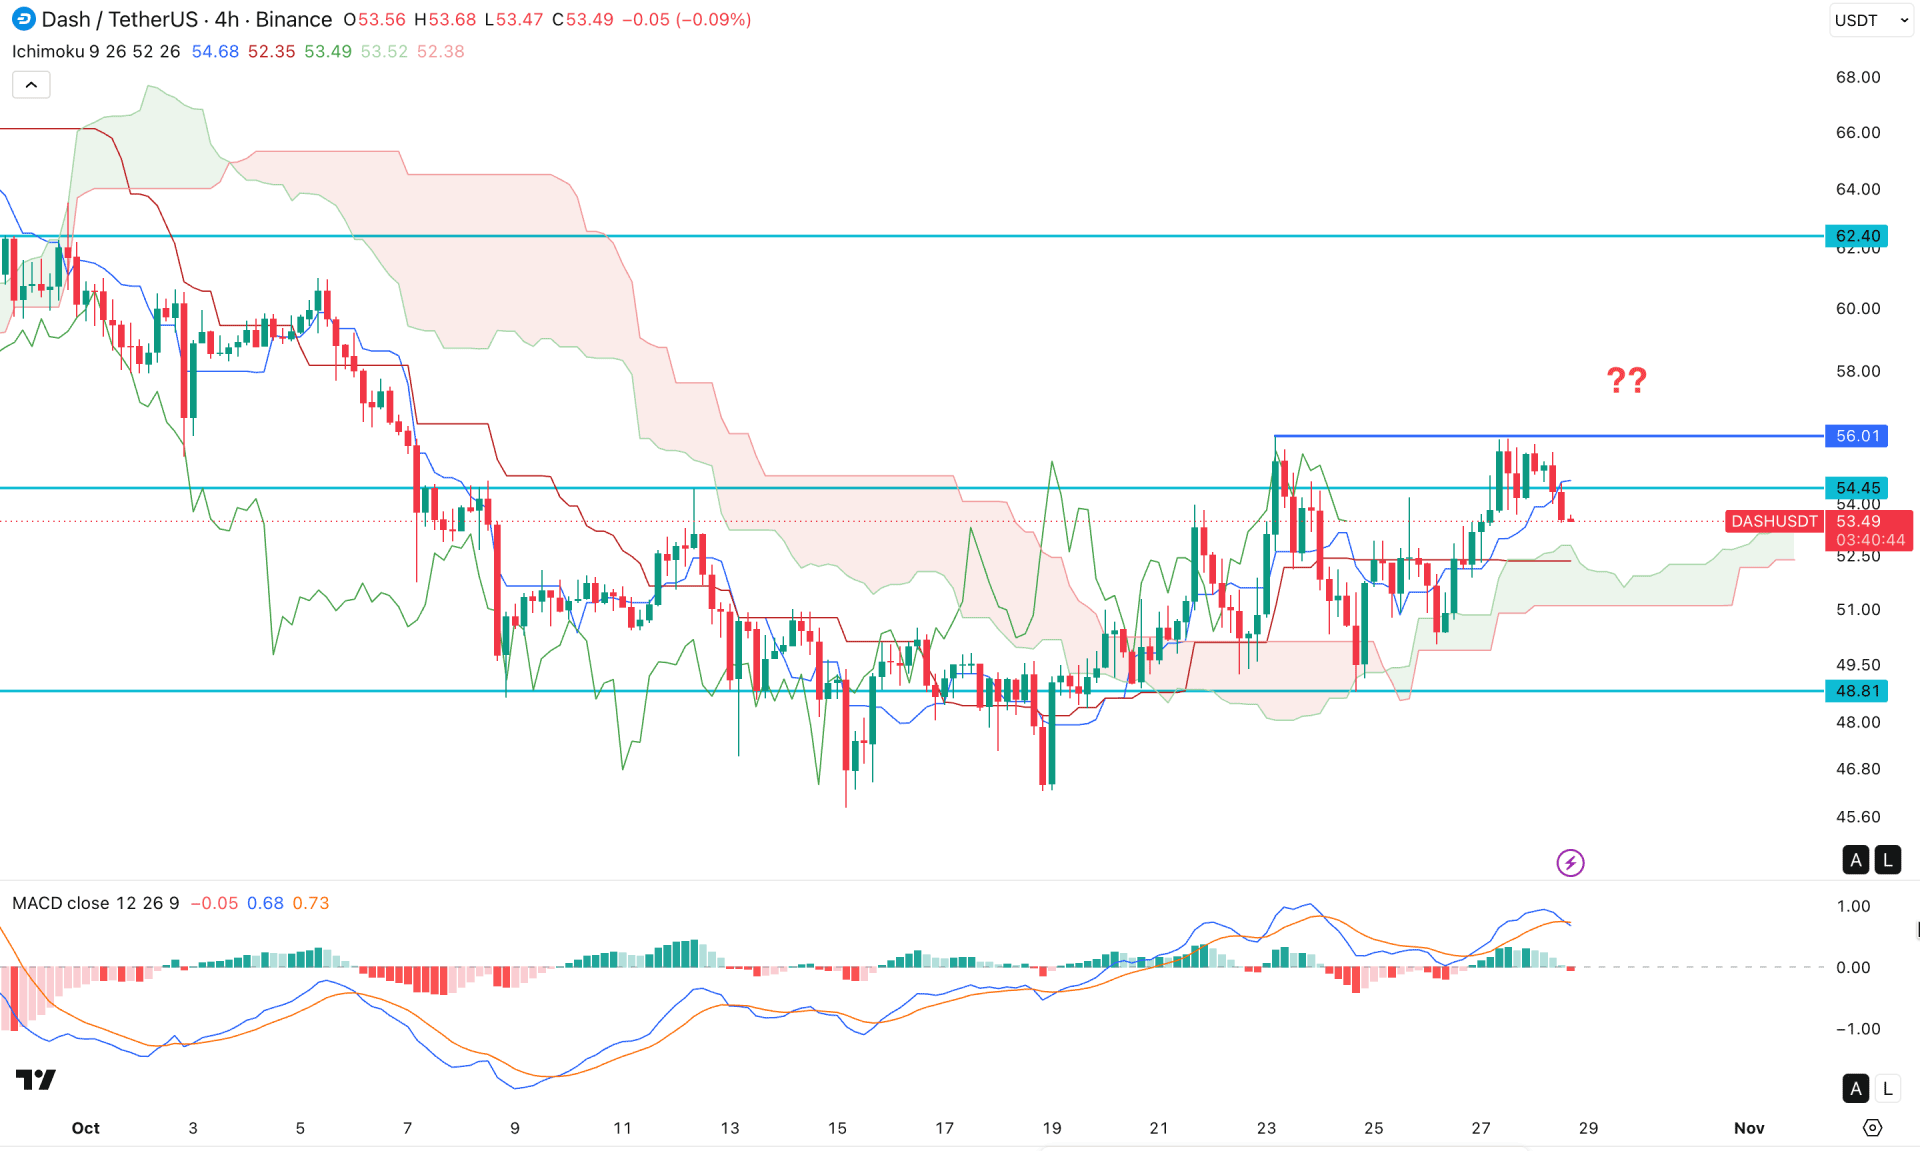
On the four-hour timeframe, DASH/USDT is trading sideways, while market momentum remains volatile. Price rebounded above the Ichimoku cloud area on a retest but failed to make a new swing high at 56.01.
Meanwhile, the future cloud is positive for buyers, as both lines are rising and Senkou Span A is above Senkou Span B.
In the secondary indicator window, the MACD signal line has formed a bearish cross, and the histogram has moved below the neutral level.
Based on this outlook, the buying pressure in this instrument is limited, as the price failed to hold momentum above the dynamic support level. In that case, a failure to hold above the 50.00 level could lower the target below the 45.00 area.
On the other hand, the current market structure is still above the Ichimoku cloud area. In that case, a rebound from the cloud, with a recovery to the 56.0 level, could increase the chance of overcoming the 62.40 resistance level.
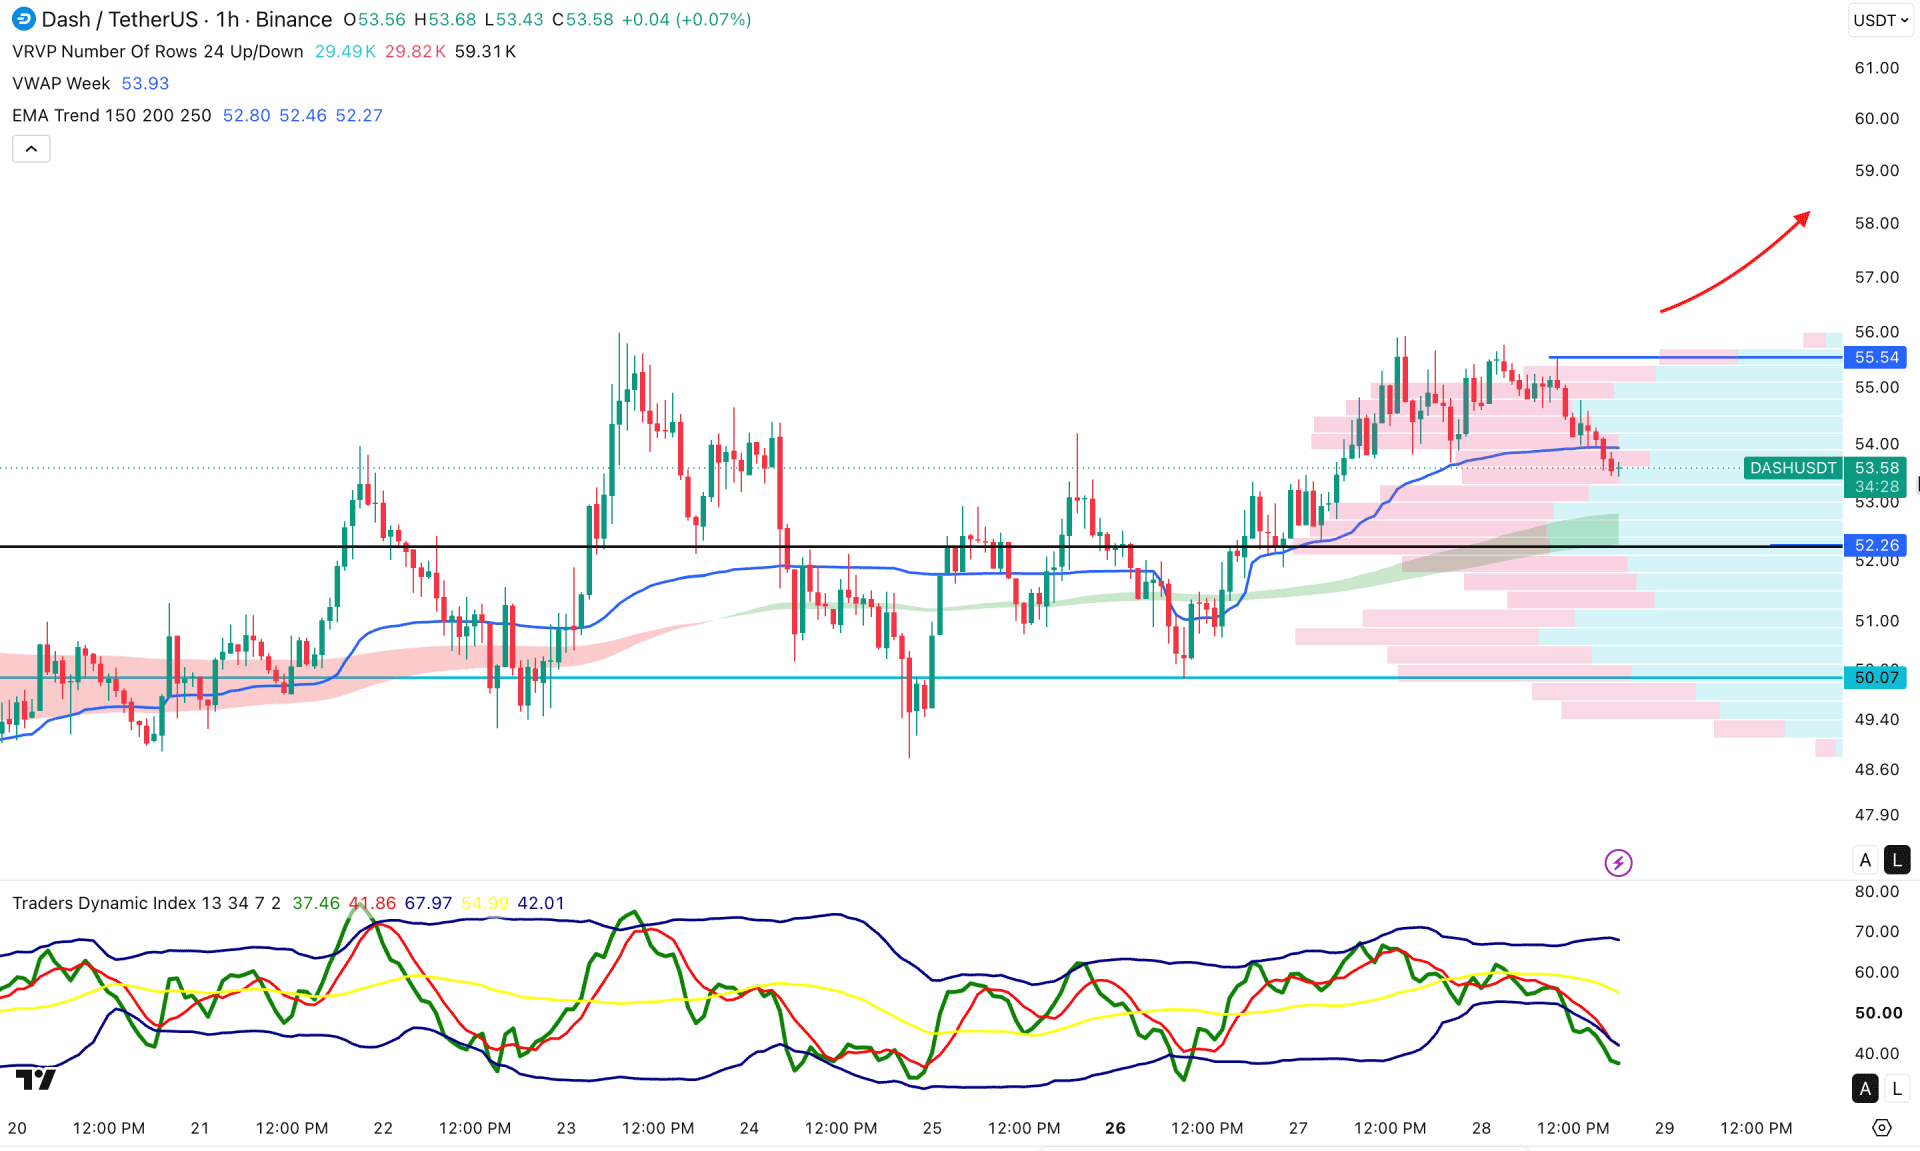
On the hourly timeframe, DASH/USDT is trading with bearish momentum from the peak, signaling pressure on buyers. Multiple hourly candles are below the weekly VWAP level, and the intraday high line remains below the current price.
In the secondary indicator window, the Traders Dynamic Index is rebounding and holding steady downward pressure below the 50.00 neutral level.
Based on market structure, downside pressure in this instrument is limited, as the exponential moving average wave has bullish traction at the high-volume support area.
In that case, a solid bullish recovery above 55.54 could increase the odds of moving beyond 70.00.
On the other hand, an extended downside correction toward the 50.07 support level is possible, which could keep buying pressure alive. In that case, a recovery after grabbing sufficient liquidity from the 50.07 level above the VWAP line could be a possible long opportunity.
Based on the overall market structure, DASH/USDT is trading in sideways momentum, with multiple swing violations on the hourly chart. With the existing bullish wave on the daily chart, we may consider a bullish rebound once the correction is over.


