
Published: May 19th, 2020
In this analysis, we will observe Dash coin, currently ranked #20 by total cryptocurrency market capitalization. This is one of the most popular privacy coins alongside zCash and Monero. The Bitcoin is already on the rise and has managed to recover from the recent huge price drop. Most of the time or in other words statistically speaking, Altcoins are following the trend of the Bitcoin with some time lag. It is highly possible that this time such tendency will be repeated. For this reason, many altcoins can be expected to start gaining in value, and Dash is a great candidate.
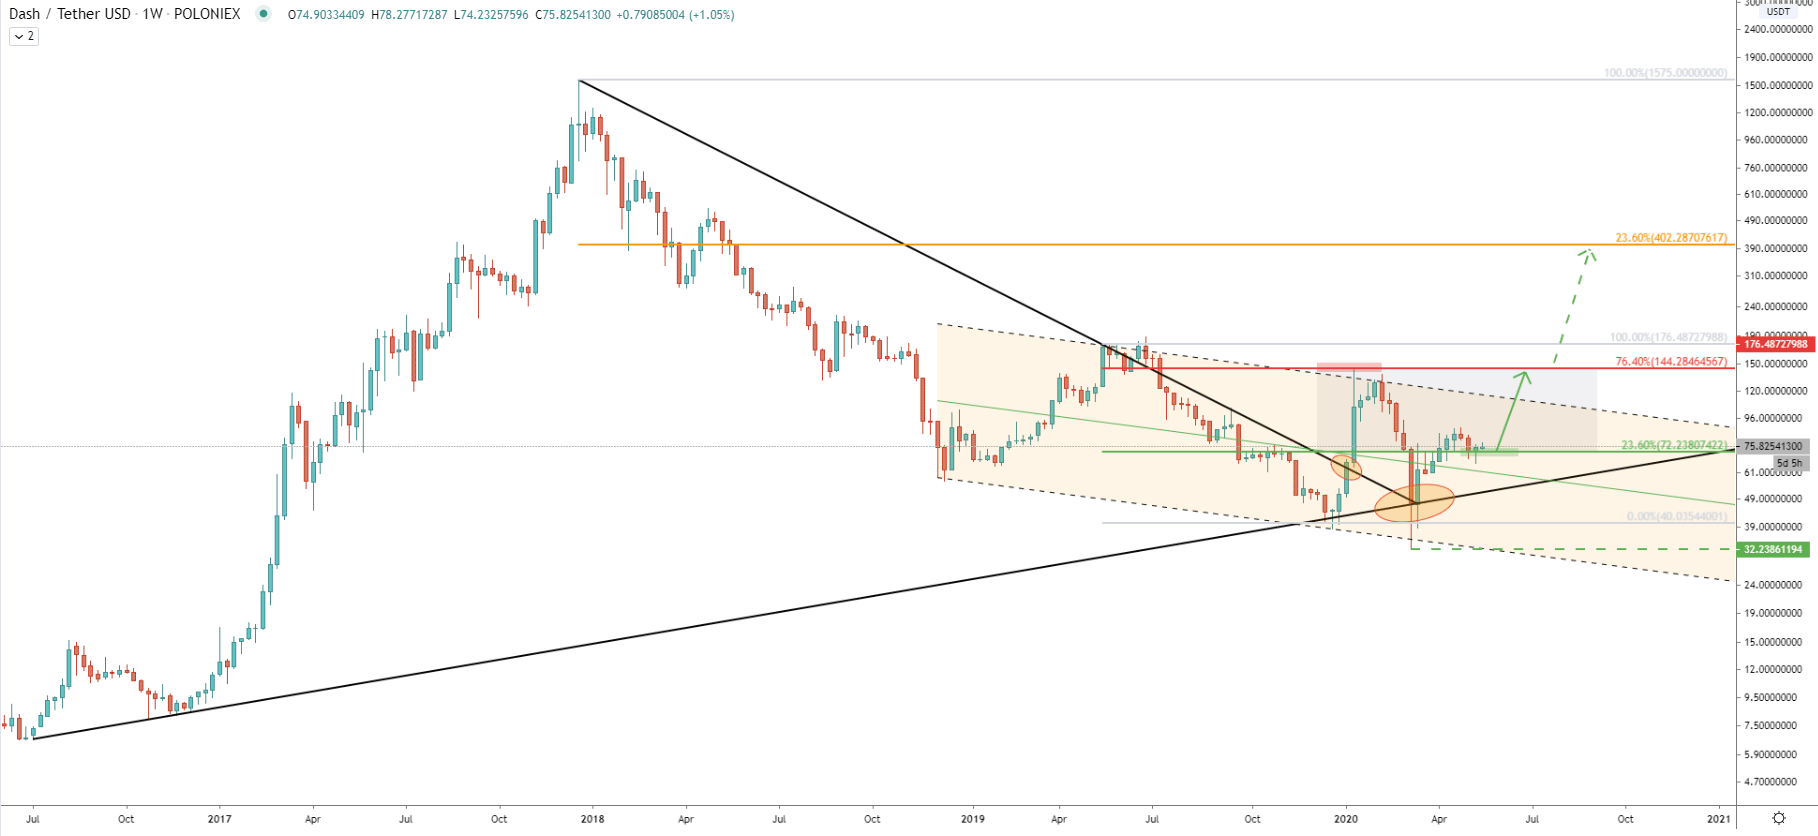
Looking at the DASH/USDT logarithmic weekly chart, the long term trend still remains bullish, after price rejected the uptrend trendline for two consecutive times. The first time it was rejected back in December 2019, when the price has reached $38.2 low and then sharply went up to $150 per coin. Several months later, in March 2020, Dash re-tested previously made low and even produced spike lower, reaching $31.33. However, the Weekly closing price remained above the previous low, above the long term uptrend trendline and above the lower trendline of the descending channel. Maybe such price action can be interpreted as a confirmation of the uptrend validity.
Fibonacci applied to the last downside wave that occurred between May - December 2019 shows two important price levels. First being the resistance at $144, which is 76.4% Fibonacci retracement level. The second is $72, which is 23.6% Fibs. Currently, the price could have entered the potential range trading phase between $72 - 144 levels. Previous few weeks, weekly close remained above the $72 support, which could mean that Dash is ready for an upswing. The nearest resistance is obviously $144, although break above it also highly probable considering the validity of the long term uptrend. If/when this resistance is broken, the next target will become a $400 price area, which is 23.6% Fibonacci retracement level.

On the Daily chart, the $72 support level is also confirmed by the 38.2% Fibonacci retracement level, this time applied to the February 13 - March 13 wave down. We can also observe how important this level had been in the past. During the last 8 months, there were multiple bounces off this support area, which was acting as the resistance at first, and then became the support. The most recent bounce occurred on May 10, where the daily closing price remained above. And already Dash started to move up slowly. It is worth mentioning that in the medium term, $66 level will play a key role, because daily break and close below this price will invalidate the potentially coming bull run and can result in price moving south towards $40 area. Although considering the fact that the support is being rejected and the downtrend trendlines were broken, the probability of the uptrend remains very high.
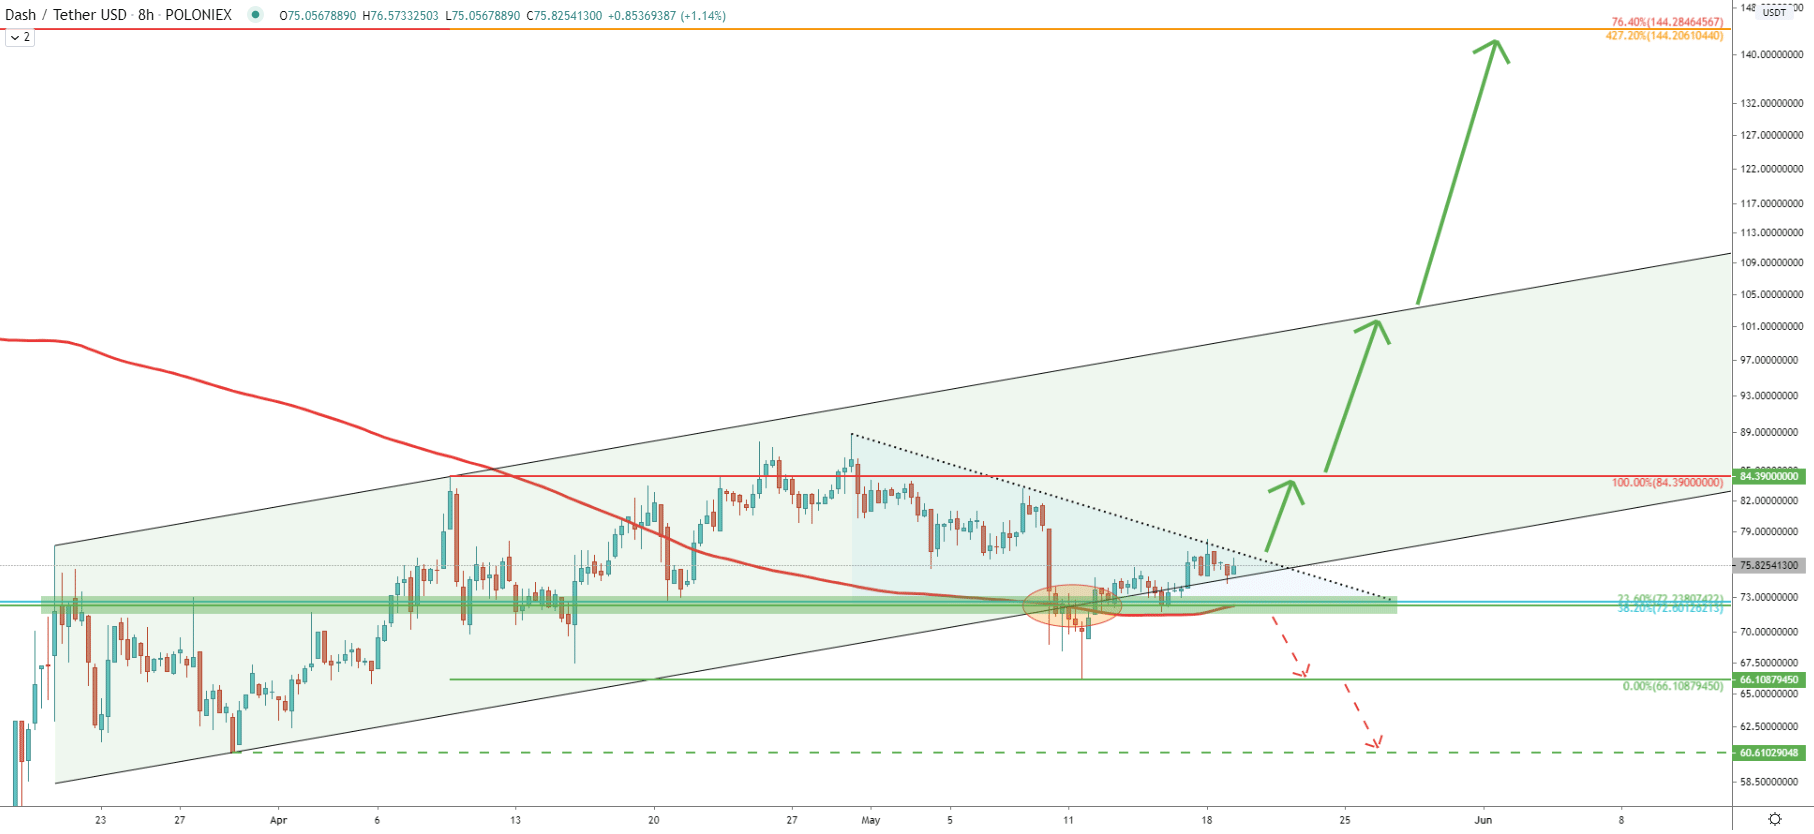
On the 8H chart, DASH/USDT continues to trade within the ascending channel. But what is most important, is the recent rejection of the 200 Simple Moving Average, the bottom of the channel, and the $72 support level even on the lower timeframe. Nevertheless. There is one important obstacle on the way up. This is the downtrend trendline, which still remains respected by the market. When/if the trendline will be broken, buyers are likely to step in with great power, which should result in a strong short term rally towards the $84 resistance level and then perhaps towards the top of the channel. Channel breakout could be the final confirmation of the bull run, at least towards the $144 resistance level, and then perhaps $400 psychological level as per the weekly chart.
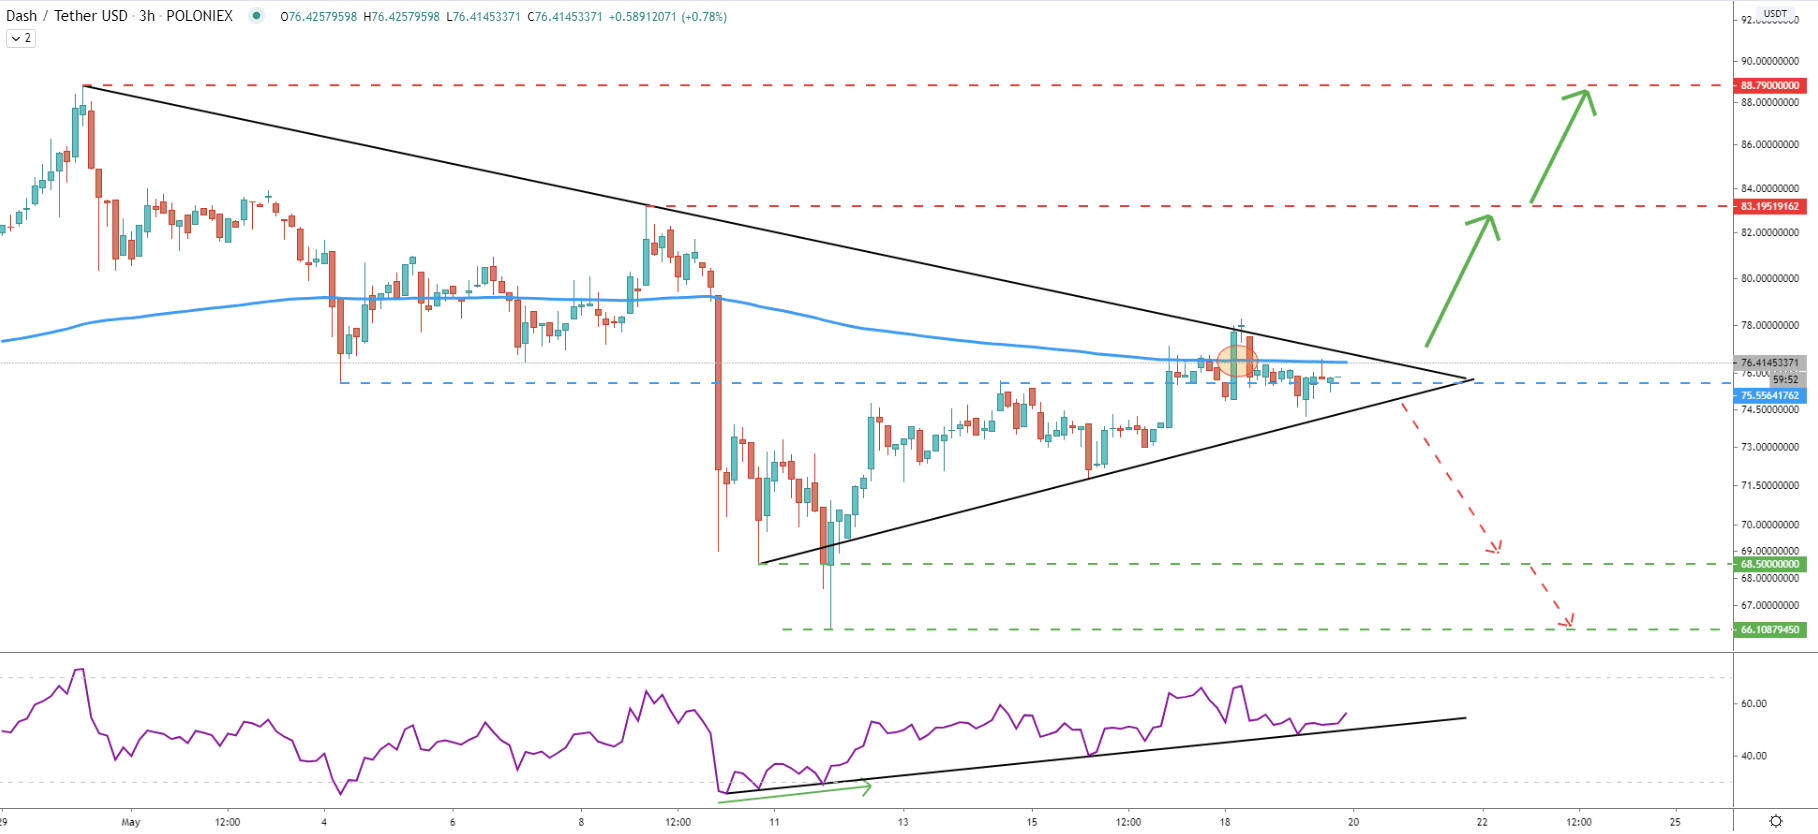
On the 3H chart, we can see the price squeeze between the downtrend trendline and the uptrend trendline, But at the same time, Dash broke above the 200 Exponential Moving Average, and RSI oscillator rejected the uptrend trendline after forming a bullish divergence. The tendency seems to be getting more and more bullish, although final confirmation is required. The price must break through the triangle whether to the downside or the upside. Only upon then, action should be taken.
It seems like Dash is ready to continue trending up on the weekly chart. This might result in long term price growth and strong profit potential for the bullish scenario. Considering current price at $75, DASH/USDT could rise as high as $400 in the coming months, and this over 400% potential gain.
All major resistances are shown on the Weekly chart. Specifically, there are only two of them. First being $144 and second is $402, which is not only a Fibonacci level, but also a strong psychological resistance.
As per the Daily chart, recently established low at $66 is now a key support level. If there will be a daily closing price below this level, the bullish outlook will be immediately invalidated. In this scenario, the price will be expected to move down towards previous support at $40 area.
Support: $72, $66, $40
Resistance: $144, $400