
Published: April 15th, 2026
Dash is a decentralized cryptocurrency, was introduced as a Bitcoin offshoot. Its emphasis on anonymity and privacy is one of its unique characteristics. It has an optional function called PrivateSend that enables users to combine their transactions with those of others, making it more challenging to track the source and destination of money.
Dash's decentralized finance and governance structure is another distinctive feature. A part of block rewards are distributed to a growth fund by Dash's treasury mechanism. Dash's emphasis on user experience, quick transactions, and privacy protections have made it a popular payment option. It has been incorporated as a payment option into a number of online and retail platforms.
Let's see whether it is a good investment or not from the DASH/USDT technical analysis:
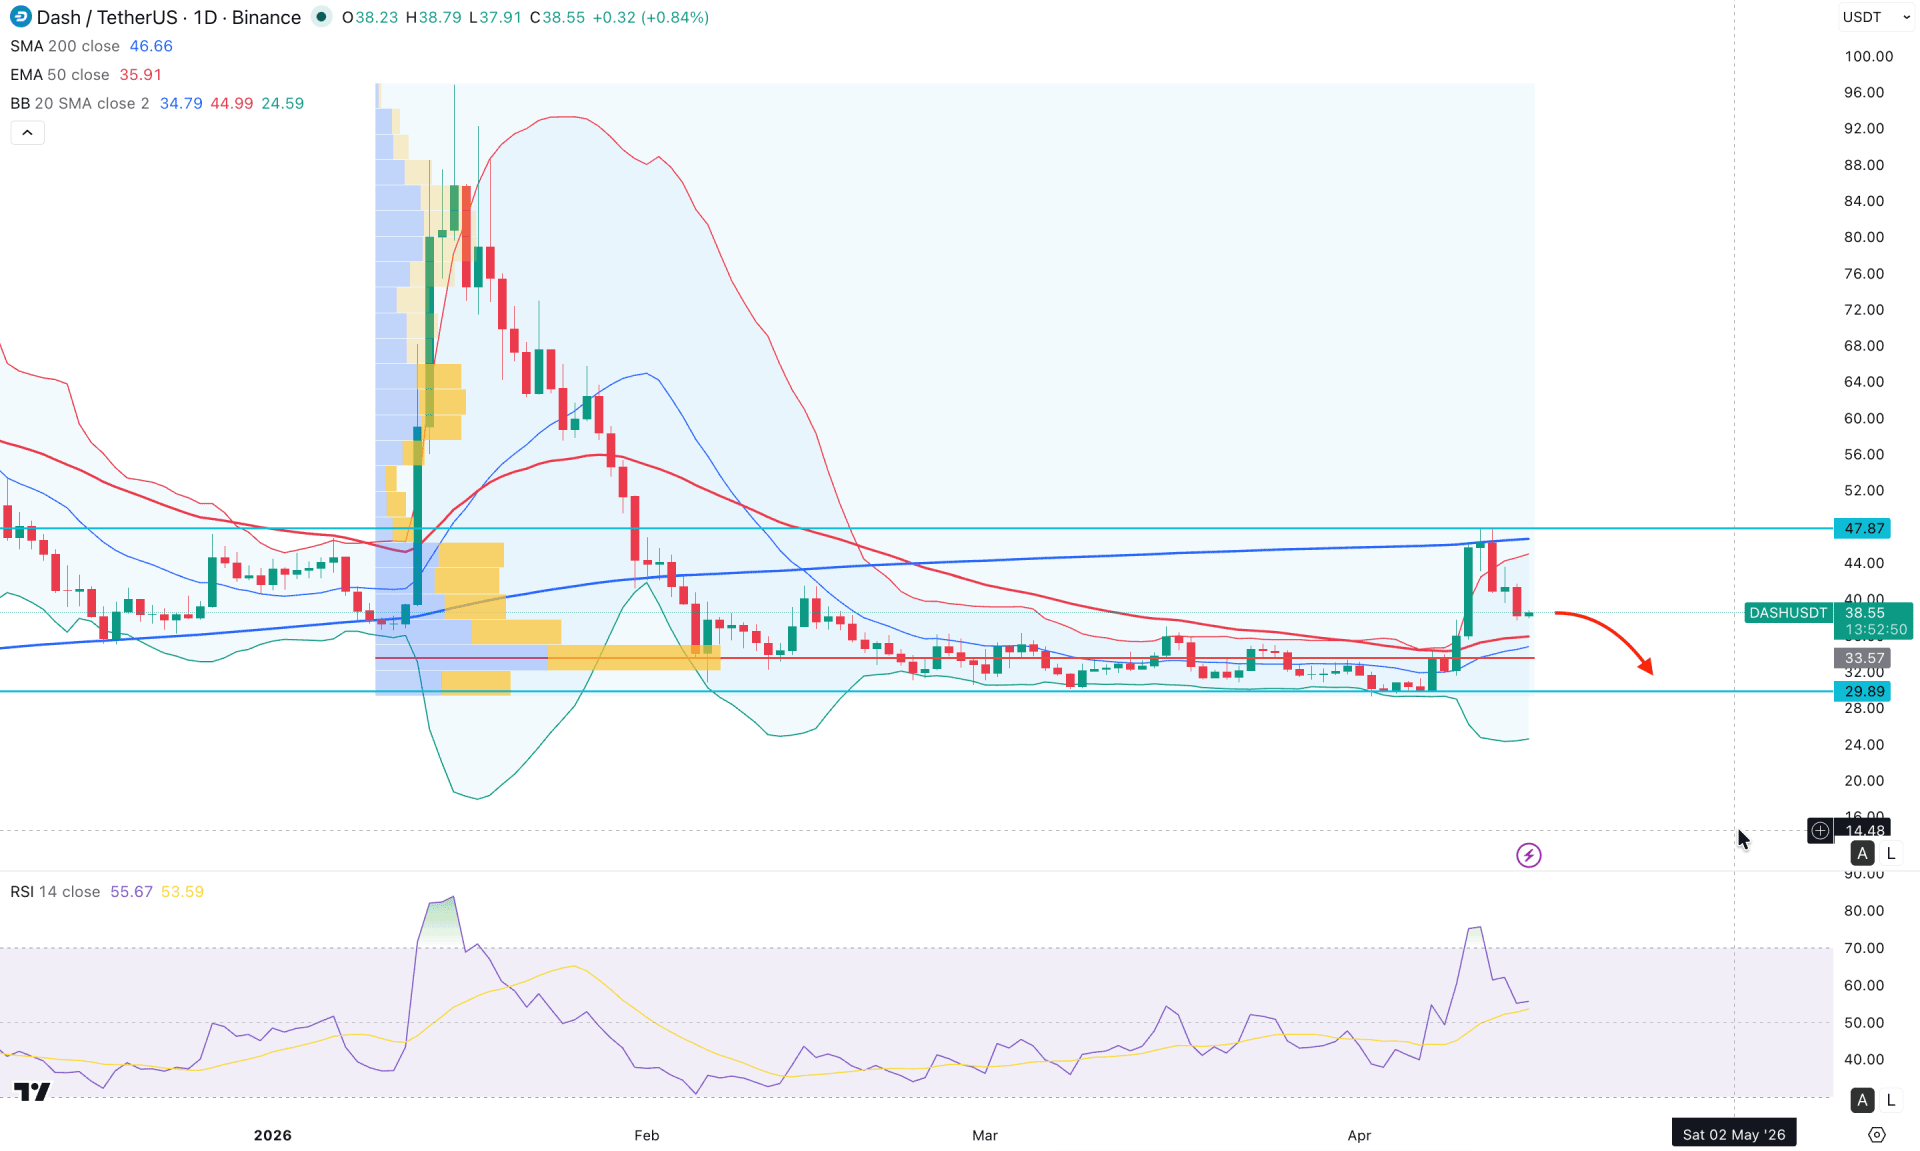
In the daily chart of DASH/USDT, the recent price shows a strong bullish reversal from a range-bound market, creating a top at the 47.87 level. However, the most recent price action shows counter-sell pressure at the top, making the bullish breakout a possibility in question.
Looking at the higher timeframe, the price is still trading within an extremely volatile structure, where the existing monthly candle closed as a gravestone doji, followed by a strong bearish breakout. The recent price has tested the February 2026 high but failed to hold momentum above it. Primarily, it is a sign of a strong buy-side liquidity grab, where more downside correction is pending.
The weekly price shows a different story: the recent weekly candle closed bullish after a nine-week corrective phase.
In the volume structure, the price is also favorable to bulls, as the highest activity level since January 2026 is at 33.57, below the current price.
In the main price chart, the price tested the 200-day simple moving average as resistance and failed to hold momentum above it. A candlestick has formed from the dynamic resistance, creating a pump-and-dump possibility.
On the other hand, the 50-day exponential moving average is still below the current price and acting as immediate support, followed by the mid Bollinger Band line.
In the secondary indicator window, the Relative Strength Index has rebounded from the 30.00 level and is currently hovering around the 60.00 level.
Based on this market structure, an immediate short opportunity is possible, as the immediate support level is at 33.57, which aligns with the mid Bollinger Band level. A break below the 33.57 level could be a challenging factor for bulls, as it might create a new swing low below the 29.89 key support level.
On the other hand, the price is still favorable to buyers, where additional bullish interest is pending from the near-term support area. Any strong bullish reversal from the 35.00 to 29.89 area, with a daily close above the 50-day EMA, could open a long opportunity targeting the 50.00 level. In the longer term, breaking above the 200-day SMA could create strong buying pressure, potentially pushing the price above the 80.00 area.
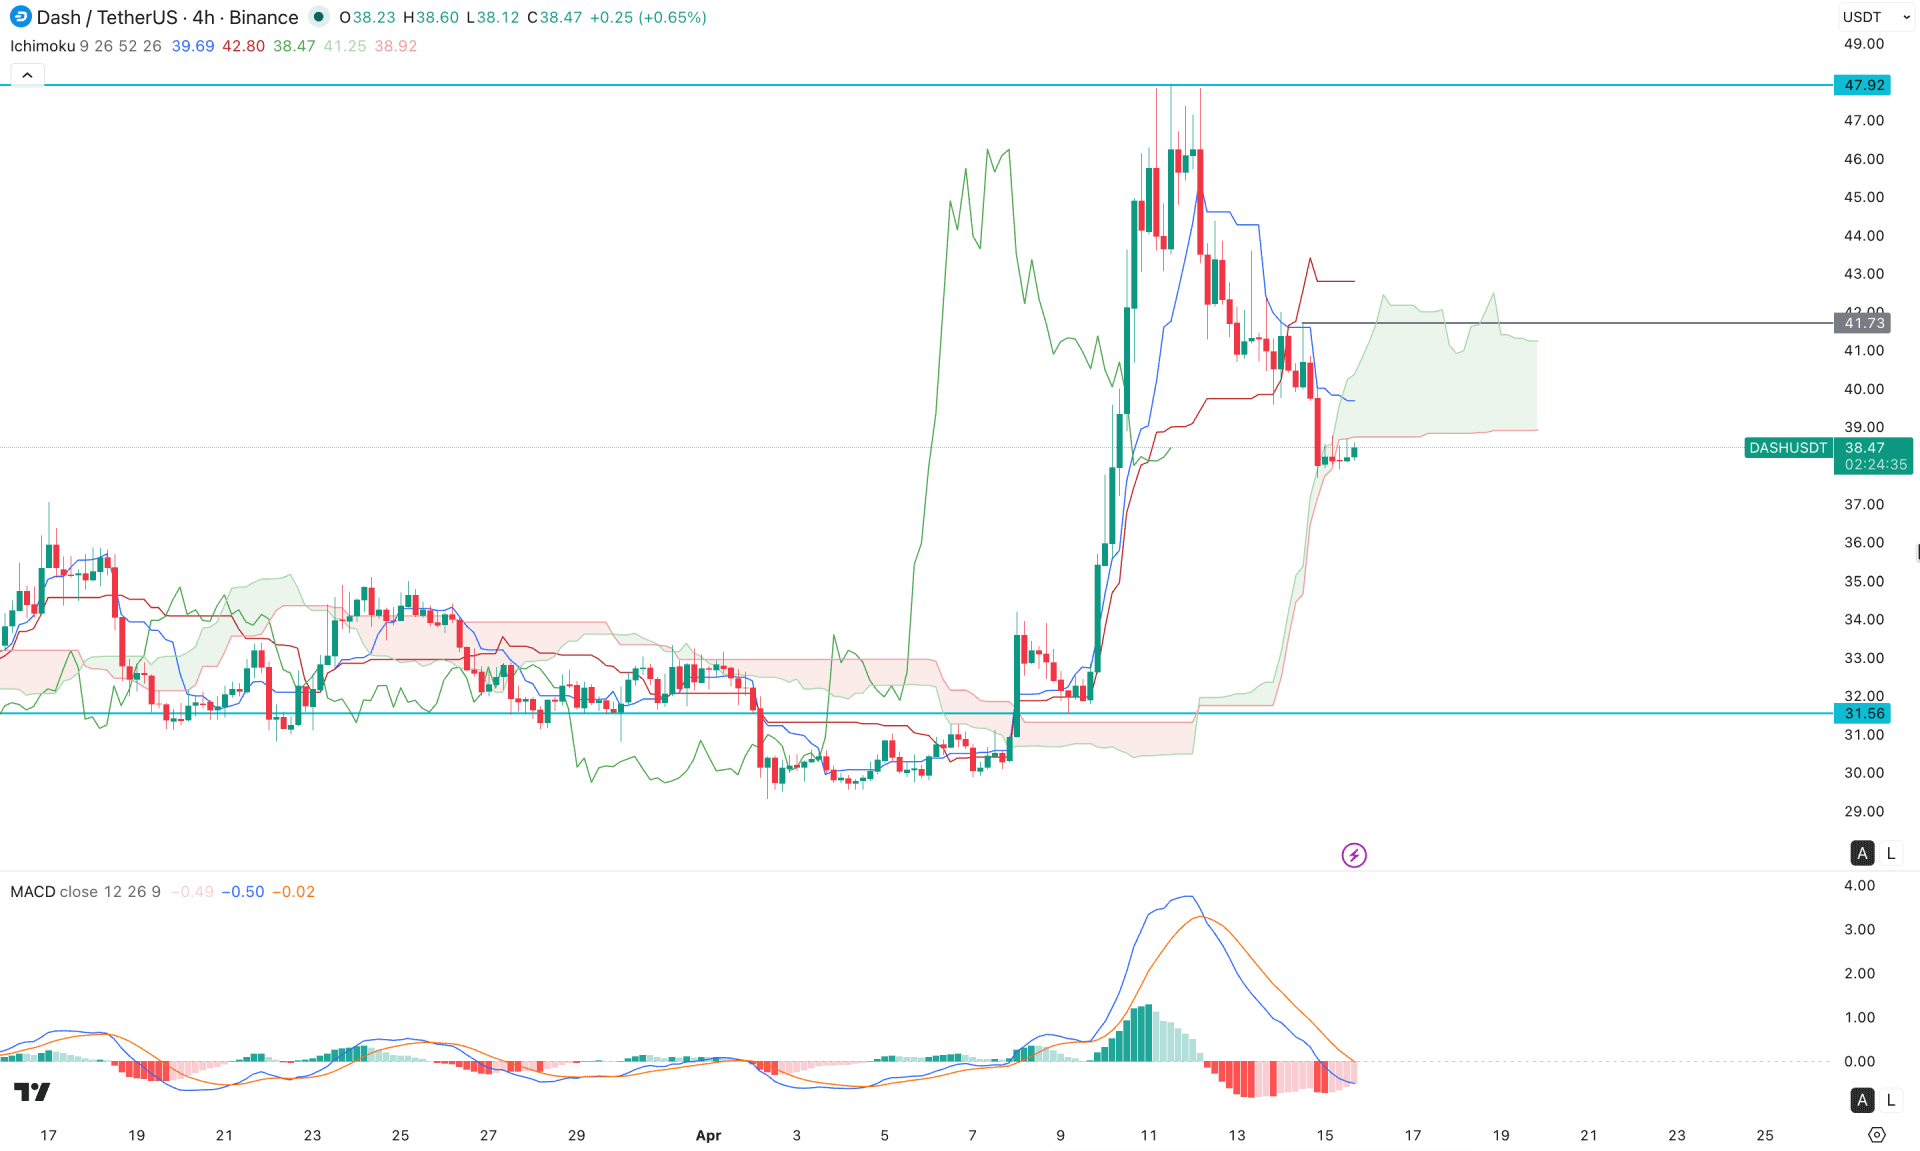
In the four-hour timeframe, the recent price shows counter impulsive bearish pressure from the 47.92 top, which makes the bullish momentum questionable.
In the most recent chart, the price is consolidating below the cloud area with a bearish breakout. However, the strength of the breakout is not solid, which signals an extended bullish correction possibility.
In the Ichimoku Cloud indicator, the future cloud is still solid as no crossover is seen between the Senkou Span lines. However, the Tenkan-sen and Kijun-sen are above the current price, working as resistance.
In the indicator window, the MACD histogram maintains selling pressure for the time being, signaling a continuation possibility.
Based on this outlook, a minor bullish pullback is possible, targeting the resistance at 47.57 level. As long as the price remains below this level, the main aim would be to test the 31.56 key support level.
On the other hand, any immediate buying pressure above the 41.70 level might invalidate the bearish outlook and push the price to retest the 47.92 level in the coming hours.
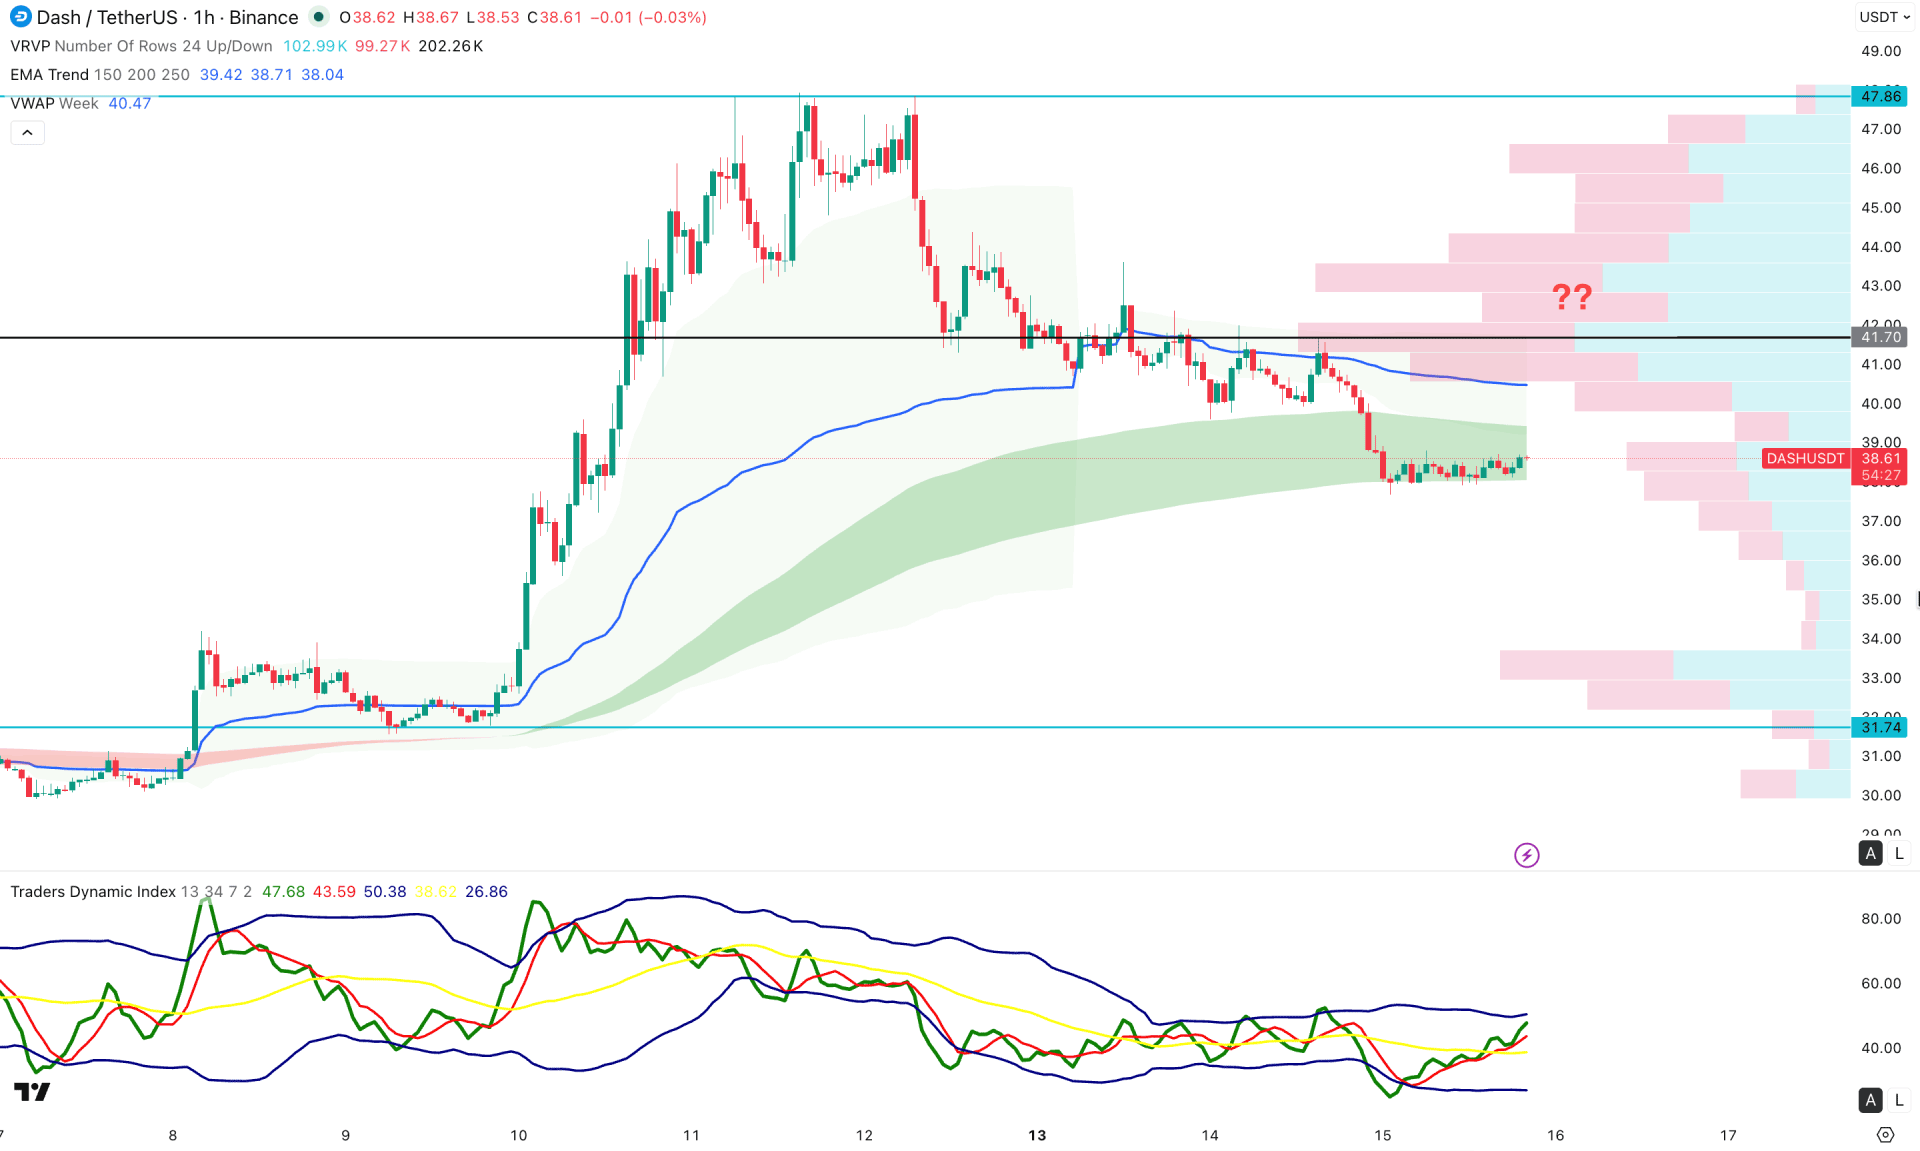
In the hourly timeframe, the DASH/USDT price is trading bearish, as multiple lower lows are seen from the 47.84 resistance level. Moreover, the intra-day high volume line is above the current price and working as a crucial resistance at 41.70.
In the main price chart, the price tested the weekly VWAP before creating a new low below the 39.00 level. However, the most recent price is holding within EMA wave consolidation.
In the indicator window, the Traders Dynamic Index shows a different story, where the recent line is aiming higher with stable momentum above the 50.00 neutral point.
In this outlook, the weekly VWAP level could work as a crucial resistance. As long as the price remains below this line, the main anticipation would be to look for short trades only.
On the bearish side, a failure to hold the price at the EMA wave area could push it lower to find support at the 31.74 level. On the other hand, a bullish recovery with a daily close above the 41.70 high volume line could open room for a move beyond the 47.84 level.
Based on the overall market momentum, DASH/USDT is facing selling pressure with a possible pump-and-dump formation. Primarily, the price is heading lower as no significant buying interest is seen at the top. In that case, the price has a higher possibility of testing the range low before forming another bull run.


