
Published: March 3rd, 2026
CrowdStrike, a cybersecurity company, will release its earnings report this week amid unrest in software stocks. Security software is becoming more and more consolidated, and CrowdStrike, like its rivals, is making strategic acquisitions to get ready for the emerging threats of the artificial intelligence era.
It is anticipated that sales will increase by 23%, reaching $1.3 billion. All commercial software companies have had a difficult year in 2026, and CrowdStrike is not an exception, with stocks down 18% so year. Eight days of the year have seen the stock decline by over 3 percent, with back-to-back losses just over a week ago serving as the high point.
The upcoming years are the main focus, not this quarter or the next. The idea that AI will interfere with software by taking over many of its features and upending existing subscription revenue structures has gained traction.
However, that is just one aspect of security. AI tools will also be available to hackers, and conventional attacks will become more sophisticated, potent, and pervasive. An enormous new security gap is created by the emergence of AI agents, which are programs that can carry out intricate tasks in response to straightforward instructions.
Let's see the complete price outlook from the CRWD technical analysis:
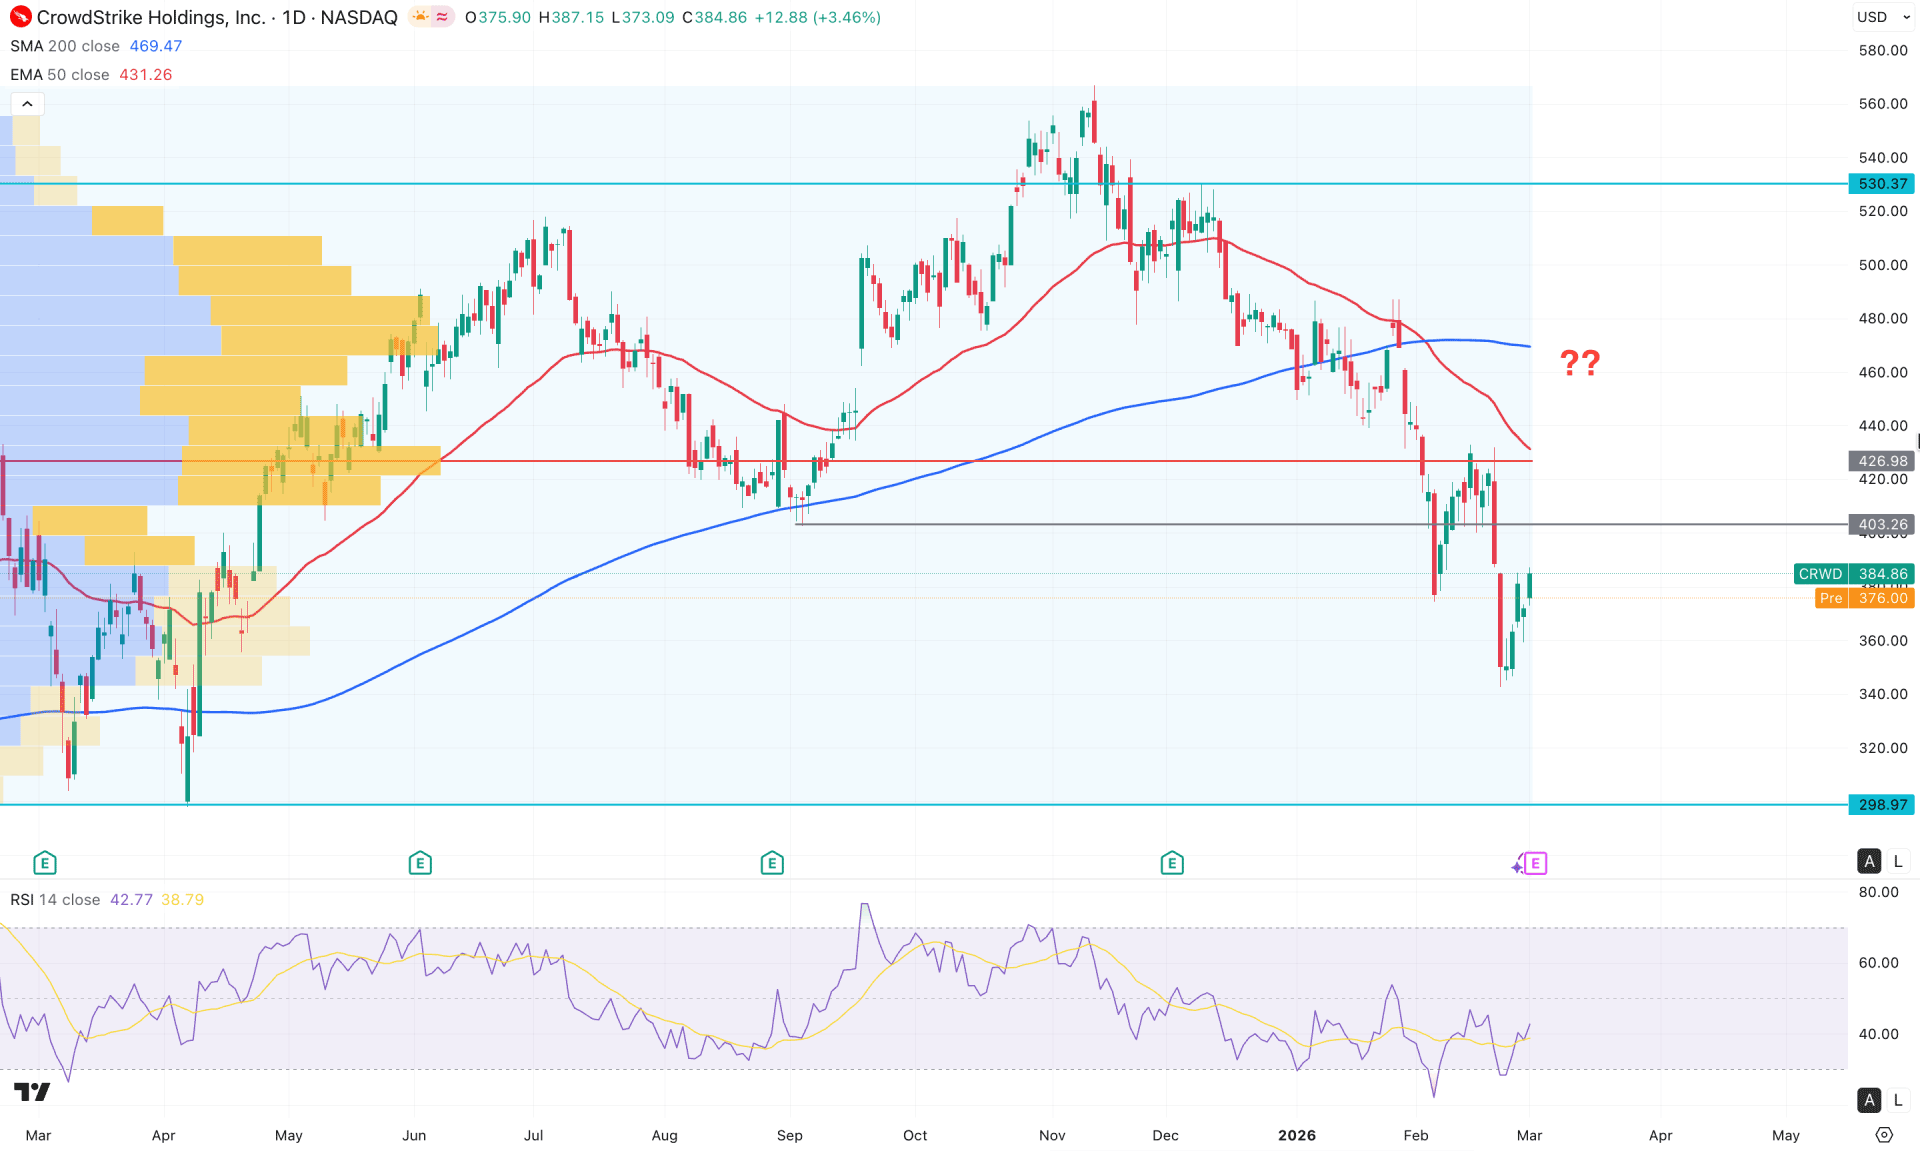
On the daily chart of CRWD, the ongoing price action is bearish, as the price continues to decline from the recent high. Overall, the asset remains strongly bearish on the higher timeframe, from where sufficient bullish signals are required before anticipating any sustainable long positions.
Looking at the higher timeframe, the price has been trading within a bearish trend for several consecutive months following the formation of an all-time high. Currently, the stock is trading in an extreme discounted zone, which may attract higher-timeframe investors seeking value entries. Furthermore, the weekly chart shows indecision near the bottom, signaling that sellers are struggling to extend downside pressure. A liquidity sweep below the existing swing low could potentially act as a bullish reversal signal.
On the primary price chart, the high-volume level indicates significant selling activity in the market, with the largest volume level since March 2025 positioned above the current price. Additionally, a new swing low has formed with a strong bearish daily candle below the high-volume line, signaling a potential continuation of the downtrend.
A death cross formation is visible, as the 50-day Exponential Moving Average has crossed below the 200-day Simple Moving Average. Moreover, both dynamic resistance lines remain above the current price with a downward slope, reinforcing the bearish outlook and suggesting further downside continuation.
However, the Relative Strength Index (RSI) presents a different perspective. A bullish divergence is visible, as the RSI failed to print a new swing low while price action did. This divergence may indicate the formation of a potential bottoming zone, though additional price confirmation is required.
Based on the overall market structure, momentum remains bearish as long as the price trades below the 426.98 high-volume level. The immediate support is located at 298.97, followed by the psychological 200.00 level.
On the other hand, the RSI divergence combined with corrective price action below the 400.00 psychological level could serve as an early bullish signal. A more confirmed bullish outlook would emerge after a decisive daily close above the 426.98 high. In that scenario, the price could retest the 530.37 level before potentially advancing toward the 560.00 to 580.00 area.
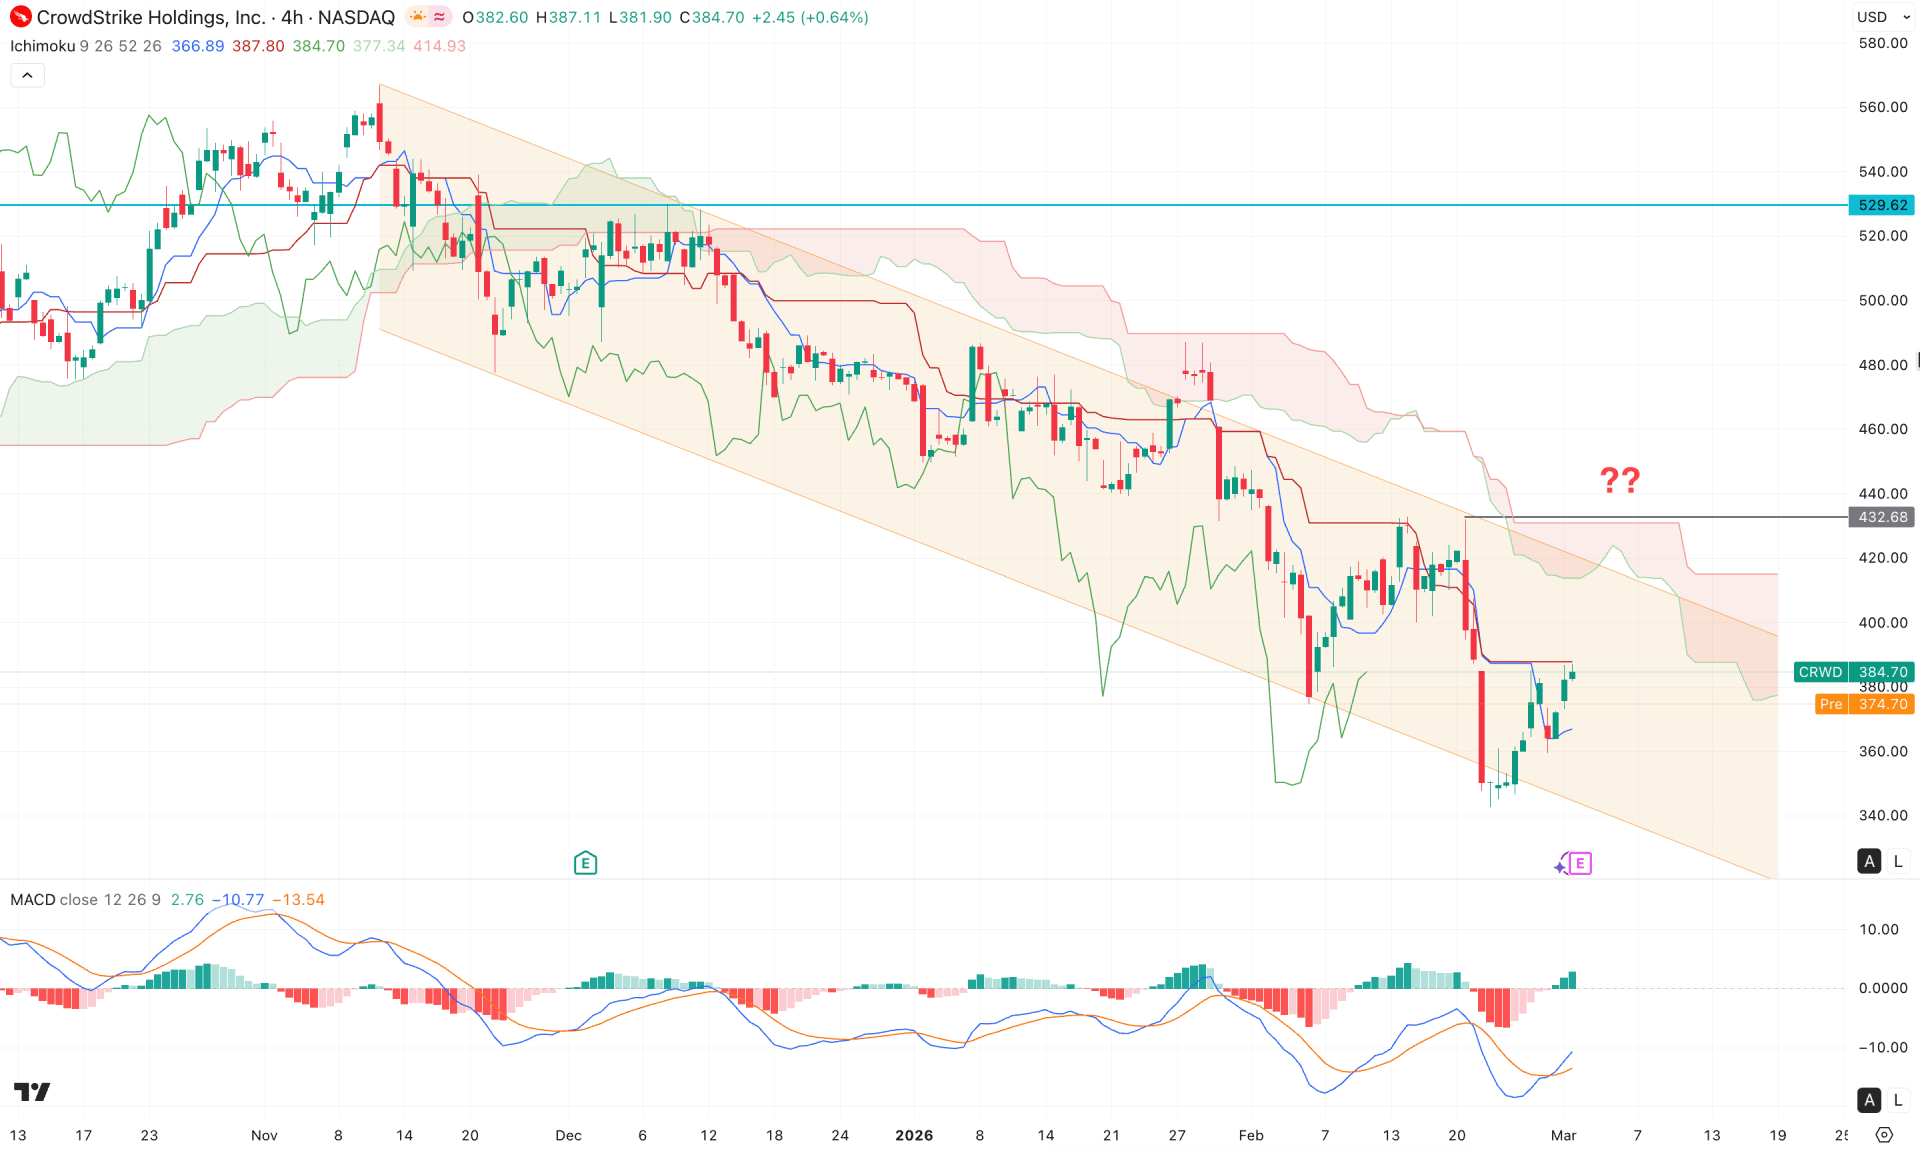
On the H4 timeframe, the price is trading within a descending channel, from which an efficient bullish correction may develop, even though the entire structure remains below the cloud area.
In the broader structure, both future lines are positioned above the current price with a bearish slope, signaling a potential downside continuation. However, the recent price rebound above the dynamic Kijun-sen level suggests emerging corrective market momentum.
In the indicator window, a potential bottom is forming, supported by a bullish crossover in the signal line. Additionally, the histogram has rebounded and moved higher into the positive territory, reinforcing short-term recovery prospects.
Based on the current structure, the downside trend remains valid as long as the price trades below the 432.68 resistance level. The immediate support is located at 344.02, followed by the 298.83 level.
On the bullish side, a break and consolidation above the 432.68 level could present a high-probability long opportunity, with the primary target being the 500.00 psychological level.
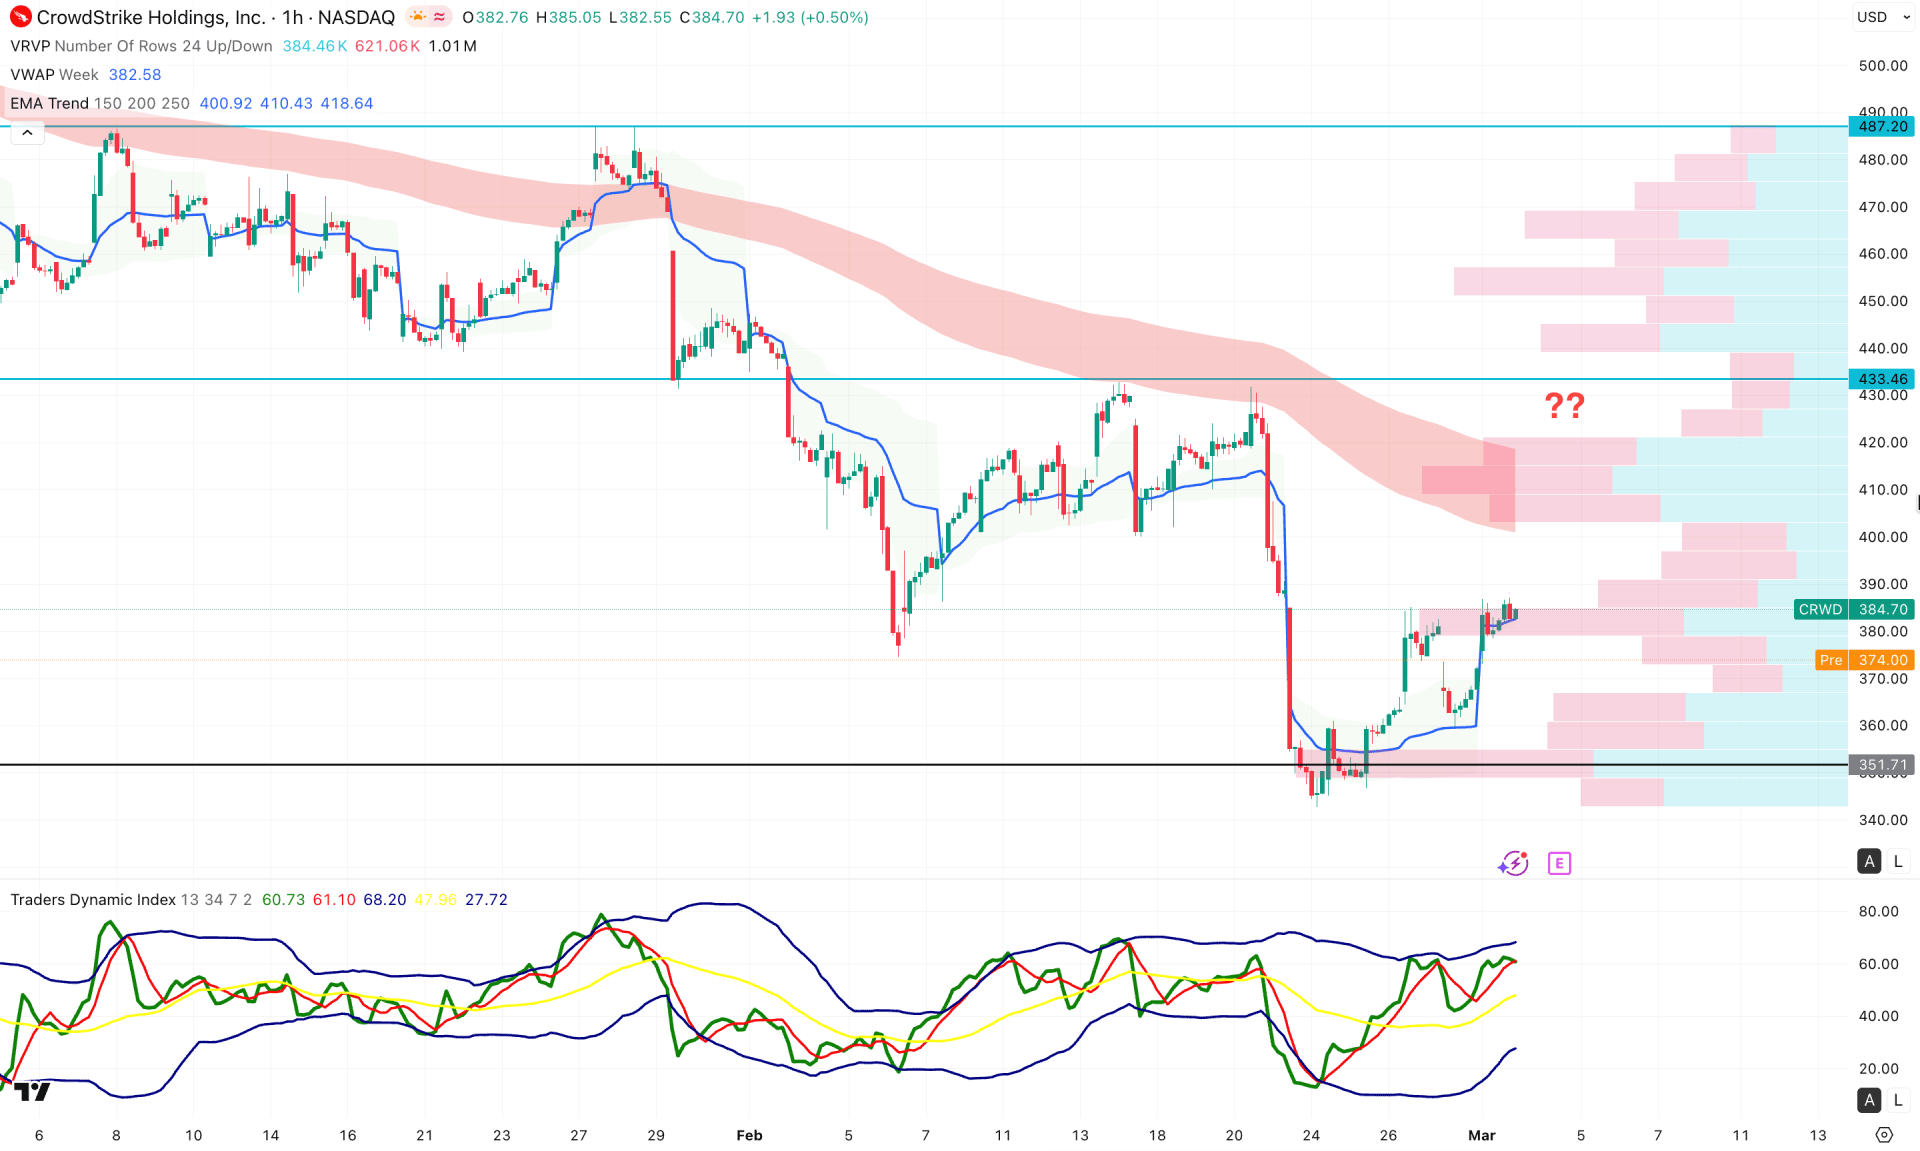
In the hourly timeframe, the ongoing price action is sideways as the price rebounded higher from the intraday high volume line but failed to sustain the buying pressure above the EMA wave.
In the secondary indicator window, the Traders Dynamic Index (TDI) reached the bullish peak area, suggesting an extreme bullish condition.
Based on this outlook, the intraday price is bullish, from where a failure to hold the upward momentum could resume the existing bearish trend. In that case, a bearish hourly close below the dynamic weekly VWAP line could be a potential short opportunity, targeting the 340.00 level.
Based on the overall market momentum, CRWD is trading within an intraday selling pressure, where the long-term market momentum is bearish. Investors should find a valid bottom in the near-term price action before validating the bottom.


