
Published: October 31st, 2023
The Year 2021 was a game-changer for altcoin projects. Following the trend, CRO/USDT showed rapid volatility by reaching near the $1.00 value per coin. However, the recent price action shows a bullish reversal possibility as it holds the momentum at a crucial resistance level.
Cronos is an open-source blockchain initiative developed by a financial services and trading organization. It operates as a decentralized platform offering various services, such as exchanges, brokerages, debit cards, DeFi, lending, and borrowing, among others.
The CRO coin, a native token of the Chain, is one of the products designed to facilitate the adoption of cryptocurrencies as a form of payment by emerging merchants. Cronos has ambitious intentions to expand its platform to other ecosystems, which could have a positive effect on the price of the CRO token.
On February 18, 2022, the Cronos team announced the rebranding of Crypto.com to "Cronos," signifying the ecosystem's dedication to decentralization. This rebranding is a significant step towards Web 3.0's widespread adoption by millions of users.
In recent weeks, the price of Cronos has increased significantly by approximately 10%. Key market indicators, such as the ten-day moving average, indicate imminent expansion. These positive indicators and growth trends are favorable signs for CRO, making it an attractive investment option for those seeking profitable cryptocurrency opportunities.
Let’s see the upcoming price direction of this coin from the CRO/USDT technical analysis:
In the daily chart, the broader market direction is corrective for the CRO/USDT price. However, the massive selling pressure since the beginning of 2023 with the approach of crypto winter could influence bulls to join the market at a lower price.
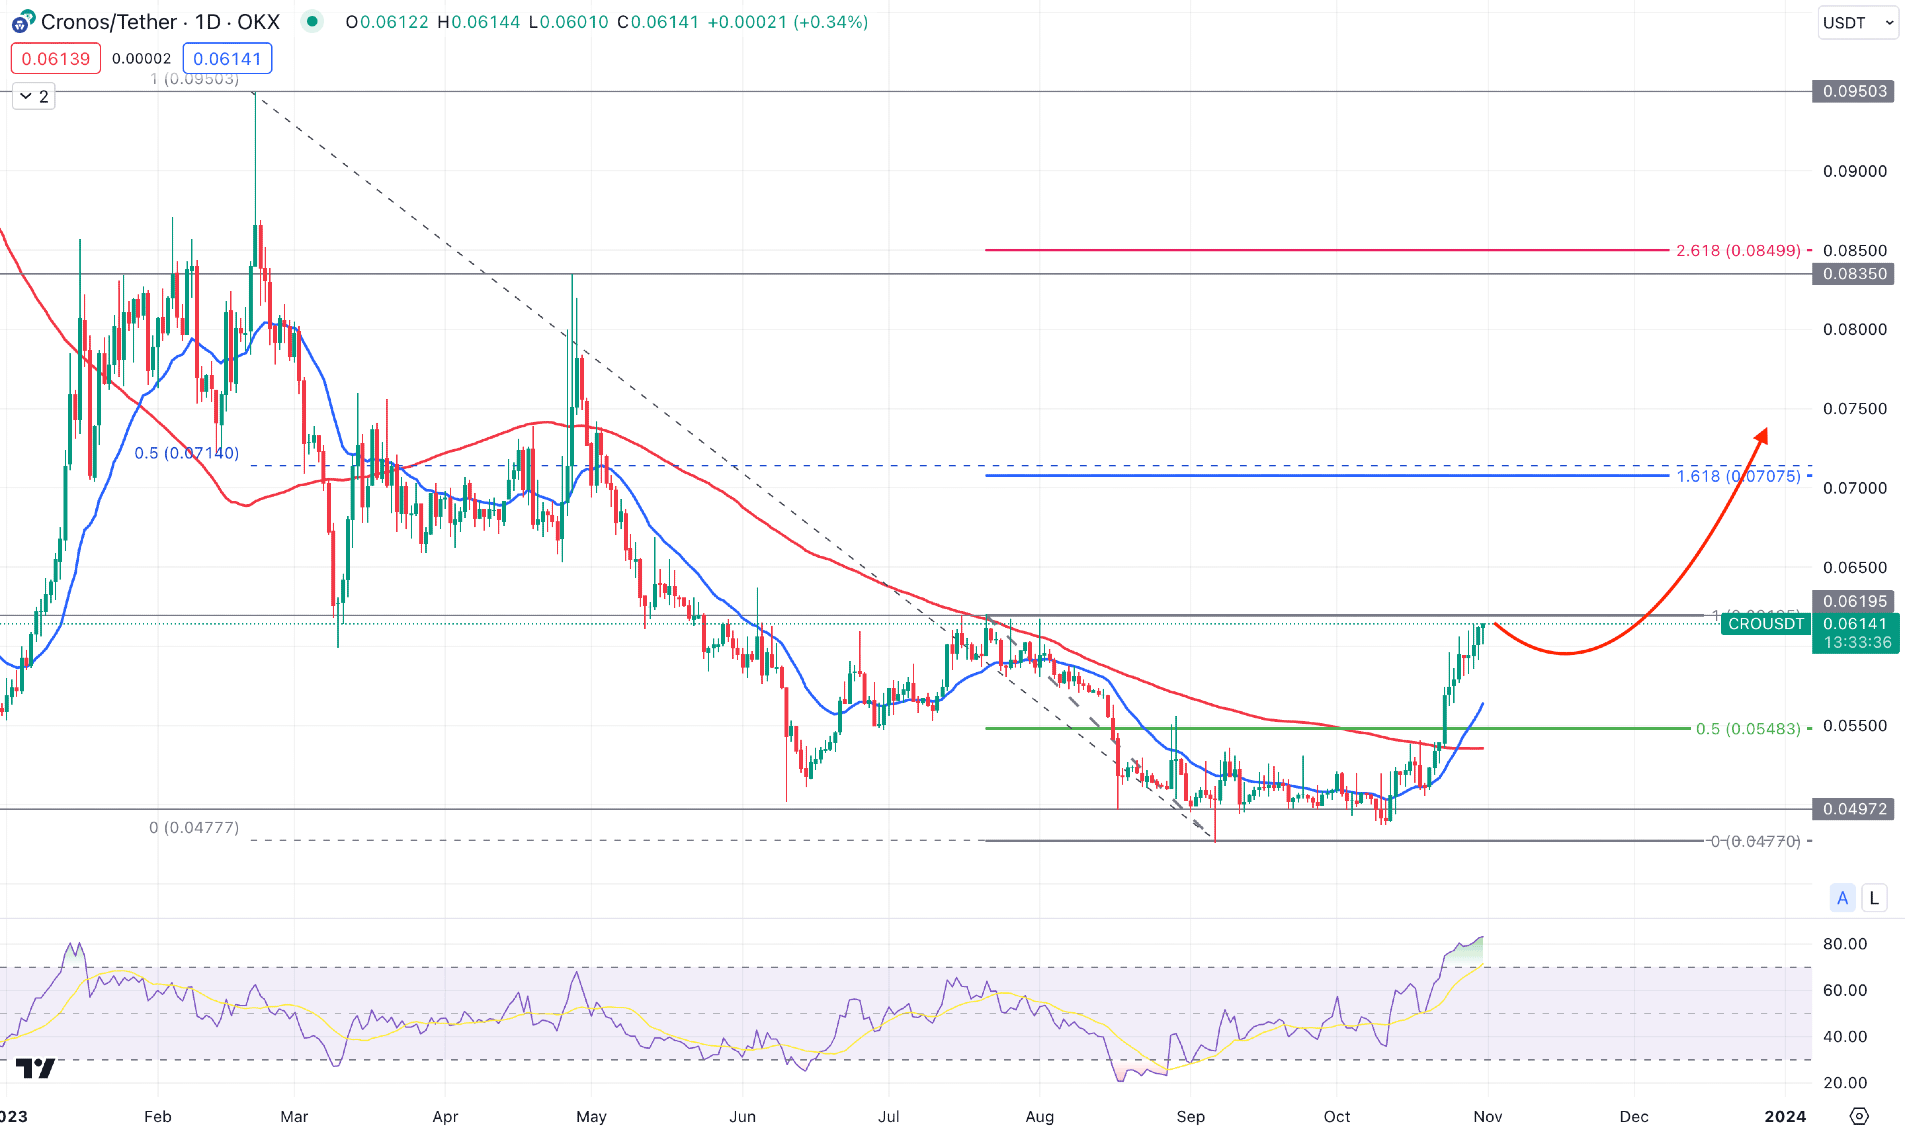
In 2023, the price topped the 0.0950 level on February 21, from where bears grabbed the wheel and made a significant low at the 0.0497 level. However, the August 2023 low has appeared as a strong support level from where the sell-side liquidity sweep has appeared. The new higher high formation above the 0.0554 swing high validated the sellers’ order grab and a bullish trend formation. Therefore, as long as the price trades above the 0.0550 psychological level, we may consider the upcoming price direction as bullish.
In the higher timeframe, the monthly candle suggests a bullish recovery as the October ended with a bullish engulfing candlestick formation. The weekly price shows the same momentum as a U-shape recovery is seen, which could result in a bullish breakout above the 0.0619 resistance level.
In the daily chart, the bullish recovery from the 0.0497 bottom became questionable from the 0.0619 resistance. As bulls struggle to overcome this price level, a downside correction may appear with a valid bearish rejection.
Within the March high to September low, the 50% Fibonacci Retracement level is at the 0.0714 level, which is above the current price. It indicates that the price is trading at the discounted zone, from where bulls can grab the wheel at a lower price.
Besides, the price moved above the 100 and 20-day Moving Averages, where a bullish crossover is visible in the above image. The 14-day Relative Strength Index (RSI) reached the overbought area, which is a signal of extreme buying pressure in the market.
Based on the daily market outlook of CRO/USDT, a bullish breakout with valid price action above the 0.0619 level would open a long opportunity for this coin. In that case, the primary target level would be the 0.0707 level, which is the 161.8% Fibonacci Extension level from the July high to the September low. Moreover, the violation of the 0.0700 psychological level could influence bulls to extend the pressure above the 0.0835 resistance level.
On the bearish side, a failure to break above the 0.0619 resistance level could be the primary sign of possible selling pressure. In that case, a bearish D1 candle below the 20 DMA could be a short opportunity targeting the 0.0450 level.
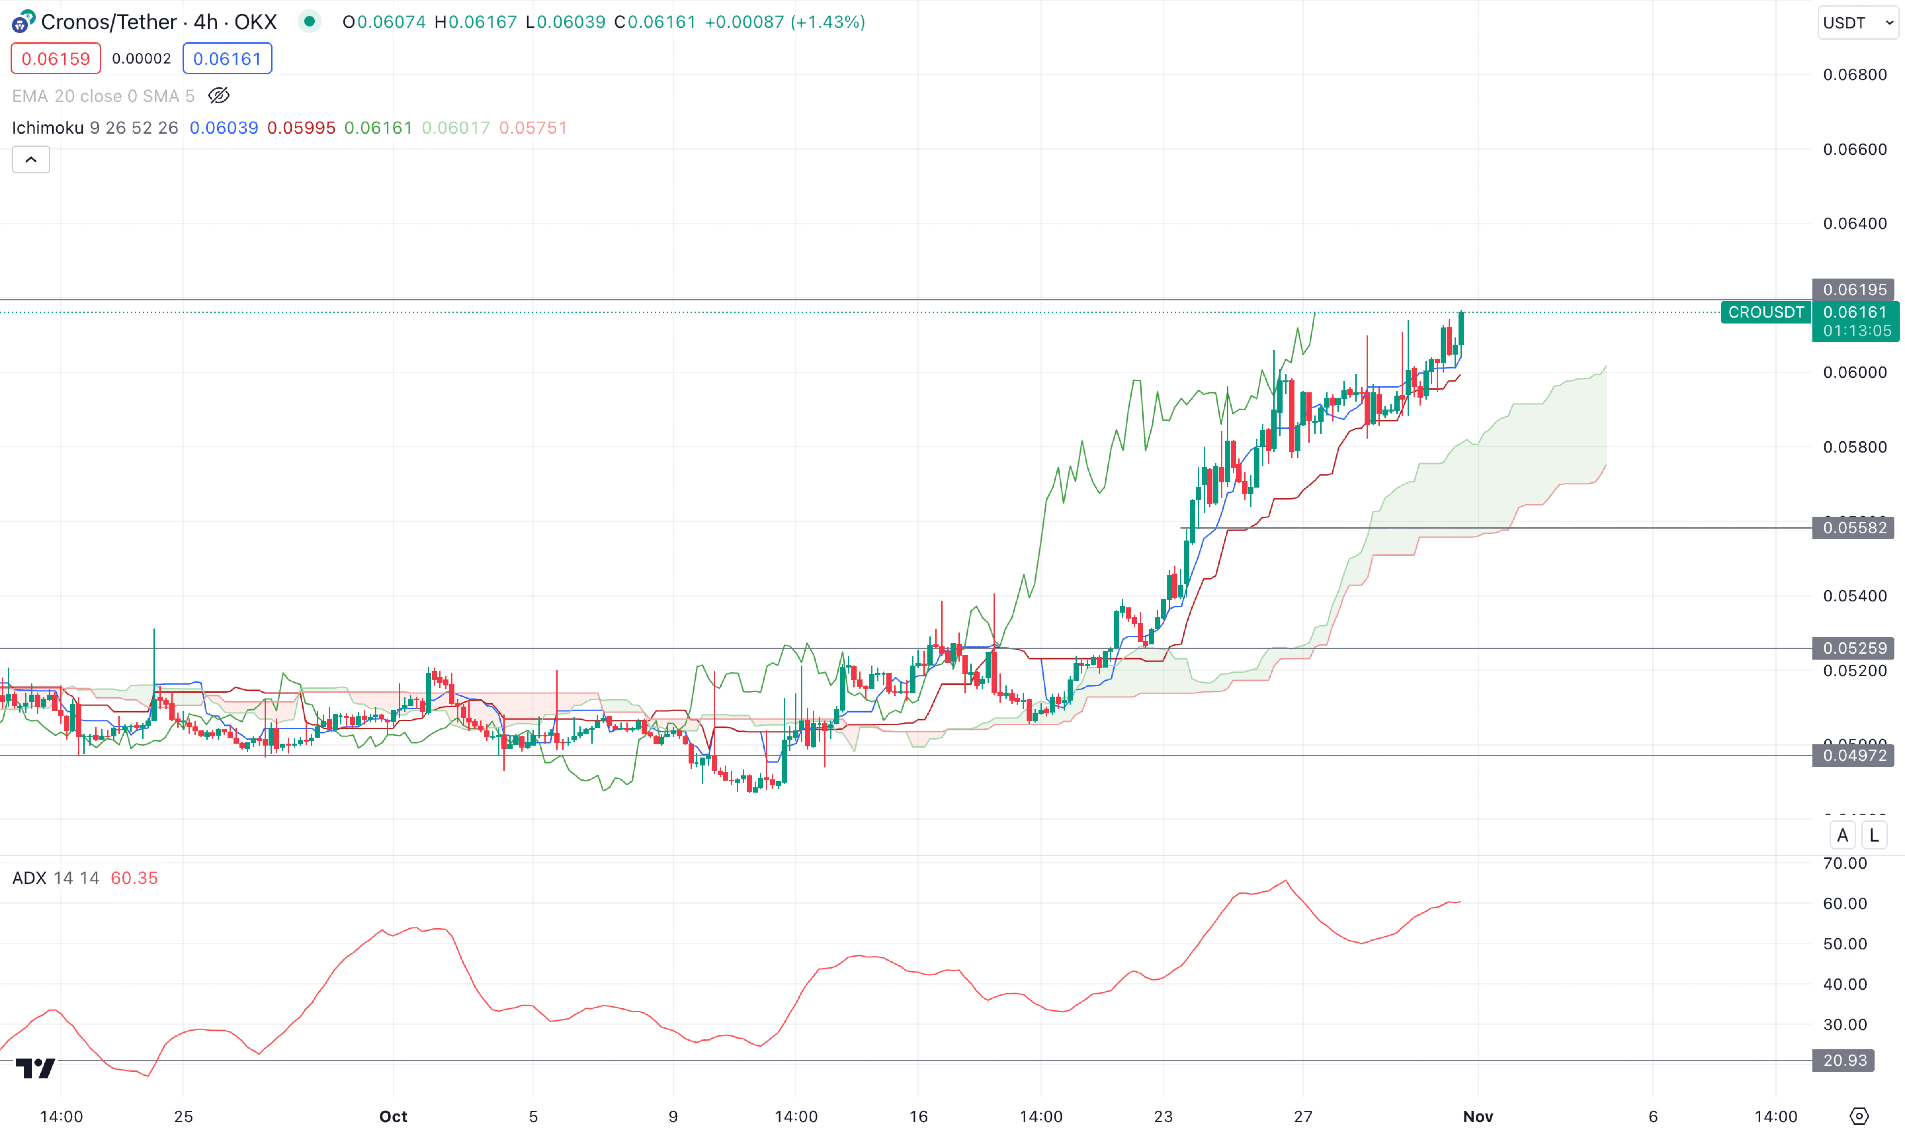
In the H4 chart, the broader market direction is bullish, as there is a stable trend above the Ichimoku Kumo Cloud. Therefore, as long as bulls hold the price above the crucial Ichimoku cloud zone, we may expect the bullish pressure to extend.
In the future cloud, the gap between the dynamic Senkou Span A and B suggests a strong bullish trend, which could result in a bullish continuation after a considerable correction.
In the secondary window, the ADX level suggests a trending market movement as it remains above the neutral 20.00 line.
Based on the H4 outlook, the bullish trend trading opportunity is present as the recent price shows a bullish rejection from the dynamic Kijun Sen level.
On the other hand, the gap between the 0.0525 bottom and the price has expanded, where a downside correction is pending. However, a sharp bearish H4 close below the 0.0500 psychological level could eliminate the bullish outlook for this coin and lower the price towards the 0.0400 area.
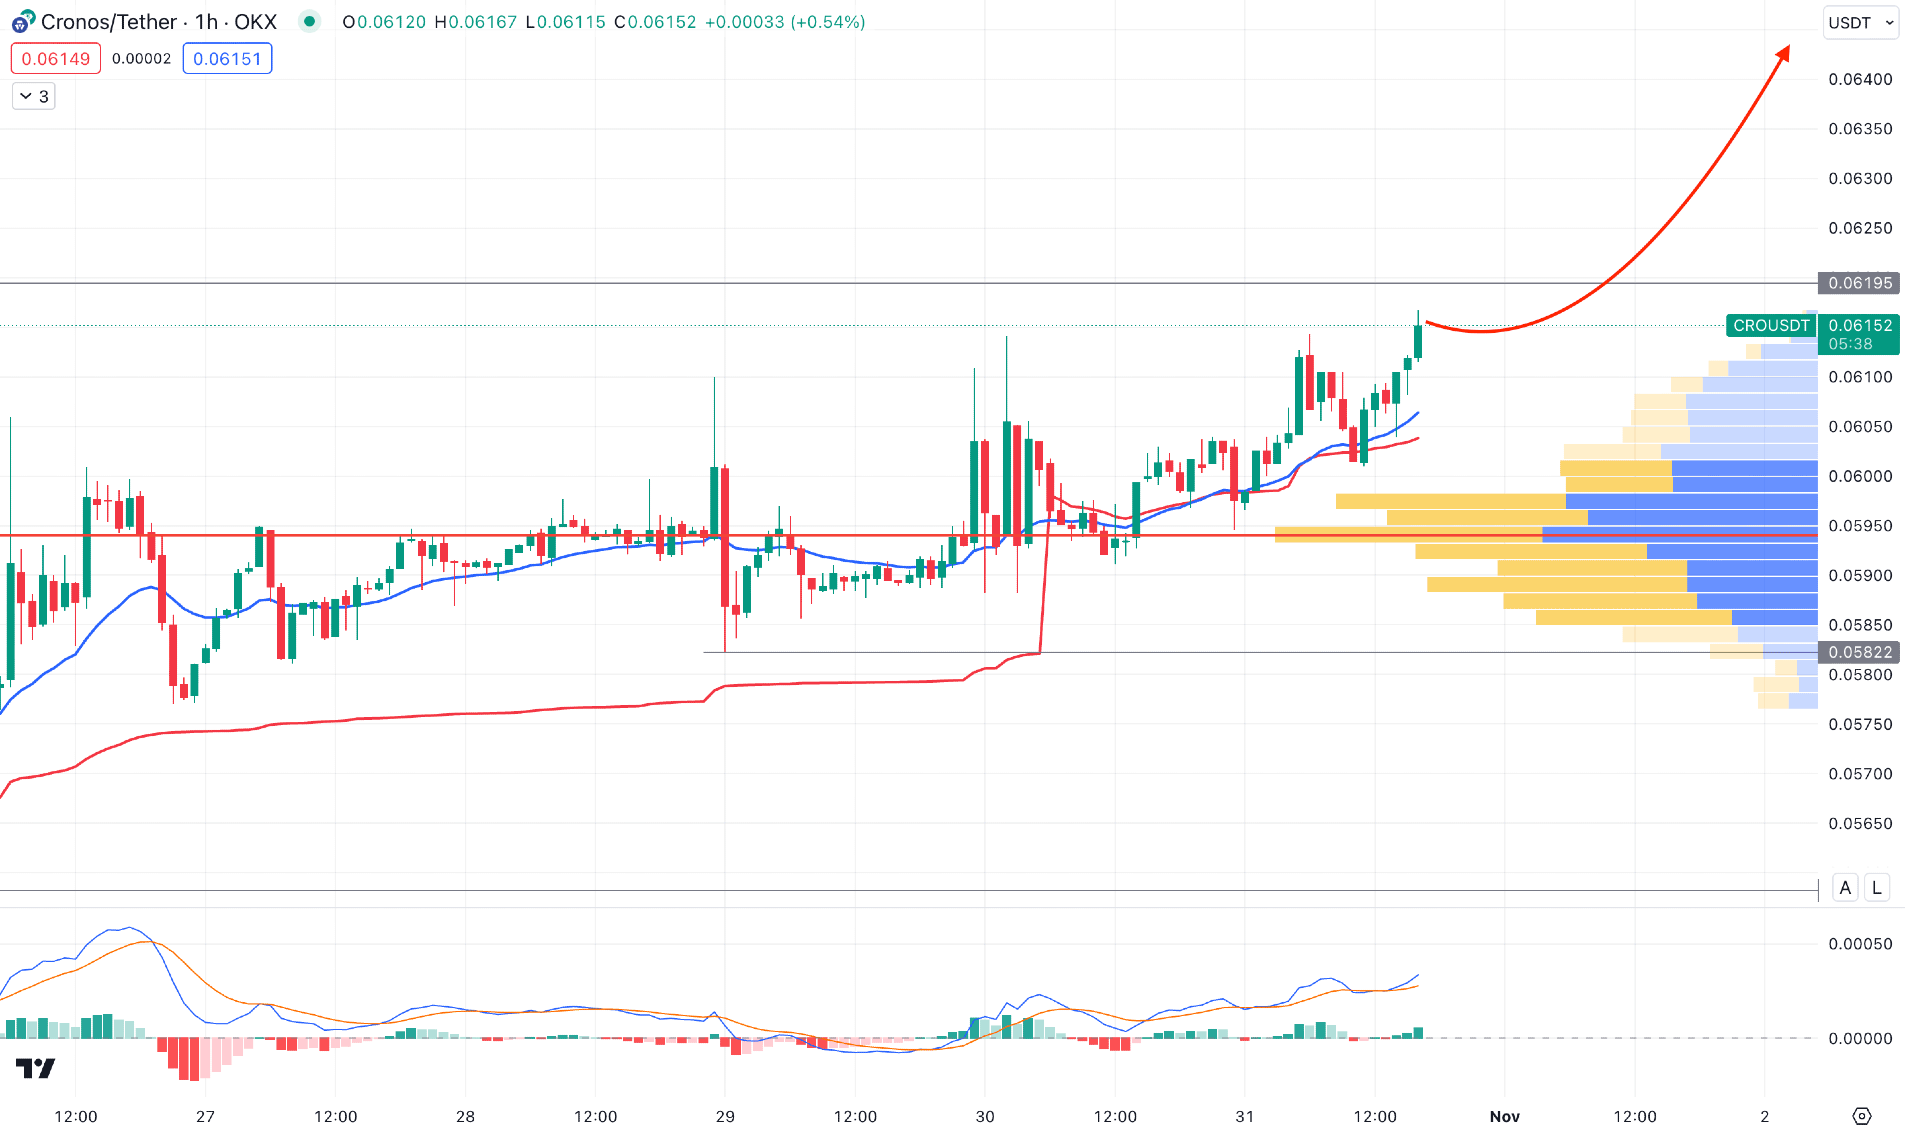
In the hourly chart of CRO/USDT, the overall market pressure is bullish as the recent visible range high volume level is working as a support level. Moreover, the dynamic 20 EMA and weekly VWAP showed a bullish rejection from the near-term swing level, which is a signal of a seller's rejection in the market.
Based on the h1 outlook, the bullish continuation is potent as long as the price trades above the 0.0594 high volume level. However, an impulsive bearish pressure with an H4 close below the 0.0580 level could eliminate the bullish structure and lower the price toward the 0.0500 area.
Based on the current multi-timeframe analysis, CRO/USDT could advance towards the 0.0900 area, where the 0.0619 resistance is the crucial level to look at. Investors should closely monitor the intraday chart, where stable breakout could be a strong buying opportunity.


