
Published: July 30th, 2025
The price of Cronos has increased this week following Crypto.com's announcement on Monday of a strategic partnership with Theta Network, which will utilize its institutional-grade custody service for managing THETA coins.
Gaining credibility through an authorized US custodian and managing fifteen million THETA coins that were recently re-staked in an Enterprise Validator Node are indications of increasing corporate trust in decentralized platforms.
In addition to these recent events, CoinGlass data shows that Futures' OI in CRO at exchanges increased from $29.49 million on July 8 to $49.32 million on Monday, setting a new record. The present CRO price hikes may be fueled by rising OI, which indicates fresh or extra cash hitting the market and additional buying.
CoinGlass data indicates that Cronos's long-to-short balance is 1.02 as of Wednesday. Since more traders are placing bets on the property price to rise, a ratio above one means that the markets are optimistic.
Let's see the further outlook from the CRO/USDT technical analysis:
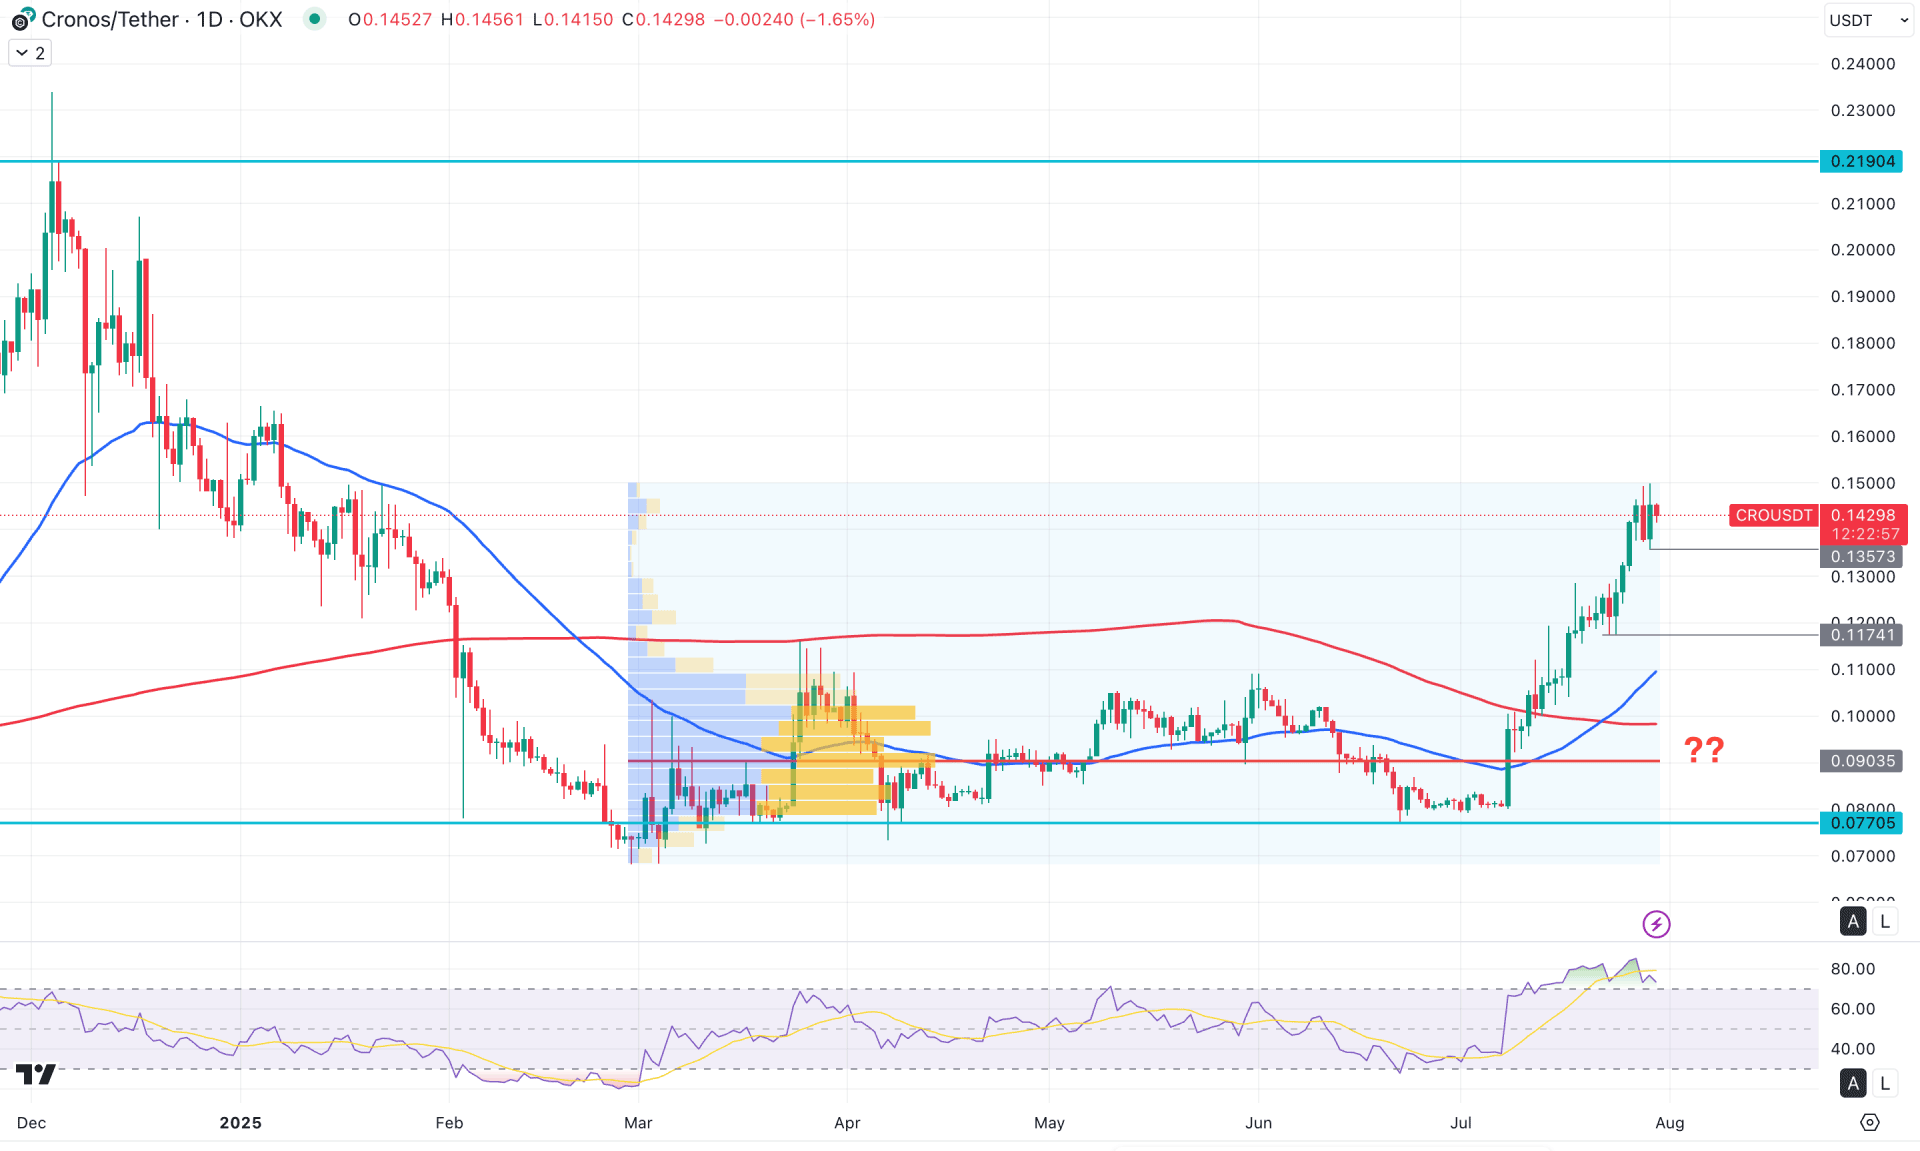
On the daily chart, CRO/USDT is trading in an established bullish trend, as the recent price action shows a strong rebound from the 0.0770 support level. After breaking out of a four-month consolidation phase, the price has formed a stable uptrend, suggesting a bullish continuation is highly likely.
On the higher timeframe, the monthly candlestick pattern reflects strong buyer presence, with the price trading above the four-month high. As the monthly candle appears likely to close successfully with a new swing high, a bullish breakout in the lower timeframe could provide additional confirmation.
In terms of volume structure, the bullish bias remains valid, as the largest activity level since March 2025 sits at 0.0903, well below the current price. However, the bullish rally from 0.0770 has already peaked with a 93% gain, suggesting a potential correction may be due. Still, a bullish rebound from a discounted price zone, supported by the high-volume area.
On the main price chart, the 50-day Exponential Moving Average has crossed above the 200-day Simple Moving Average, indicating a potential golden cross formation. As long as the price remains above these two dynamic support levels, continued buying pressure can be expected. However, the widening gap between the current price and the 50 EMA may signal a short-term bearish retracement.
Solid bullish momentum is indicated by the Relative Strength Index (RSI), which is currently reading 77 and heading upward over its excessive level of 70. Early in July, the daily chart's Moving Average Convergence Divergence (MACD) indicator displayed a bullish crossover, which is still in place today. A rising trend and growing bullish momentum are shown by the green histogram bars climbing above their neutral point.
Based on the current daily market outlook, the primary objective is to identify downside pressure before considering any long positions. Immediate support is seen at 0.1357—a breakdown below this level could trigger further losses toward 0.1174. Nevertheless, the overall trend remains bullish, and any liquidity sweep below near-term support could present a high-probability long opportunity.
A failure to break below the 0.1357 level, followed by an immediate recovery, may act as an early long signal, targeting the 0.1600 level. Alternatively, another bullish attempt could originate from the 0.1174 to 0.1100 zone, depending on price action in that area.
On the other hand, sustained selling pressure that pushes the price below the high-volume node at 0.0903 could invalidate the bullish structure and lead to a deeper correction below 0.0700.
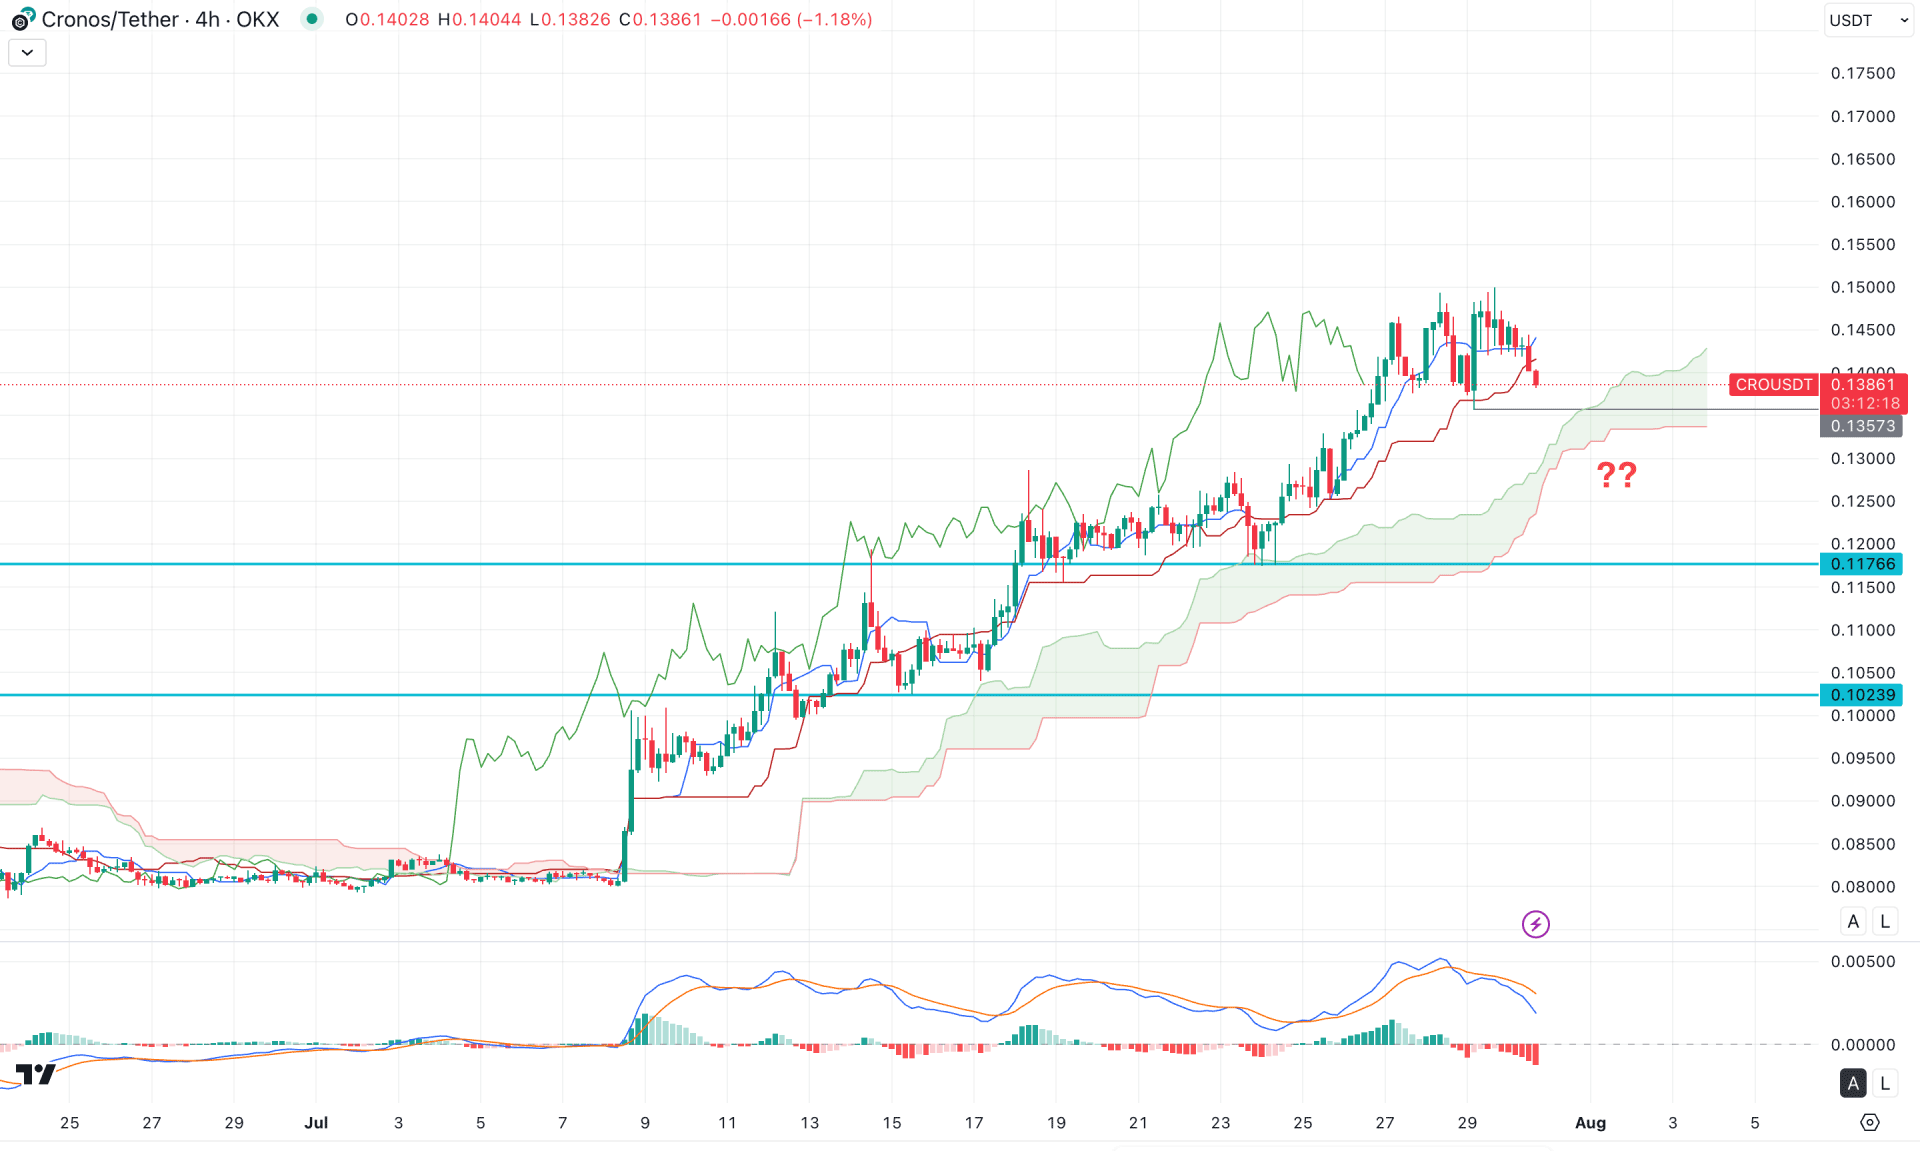
In the four-hour timeframe, the ongoing bullish momentum remains visible. However, the most recent price action is struggling to sustain buying pressure near the top, as the price has moved below the dynamic support area, creating downward pressure on the bulls.
In the Ichimoku cloud, both future lines are aiming higher, indicating a potential bullish continuation. However, the MACD histogram has failed to confirm this momentum, as it has moved below the neutral line.
Based on this outlook, the price is likely to dip lower and test the 0.1357 support level before resuming a bullish continuation.
A bullish rebound followed by a close above the Kijun-sen level could offer a long opportunity, with a target set at 0.1600. However, if further downside occurs, a deeper correction is also possible, where the ultimate support level for buyers to monitor is around 0.1200.
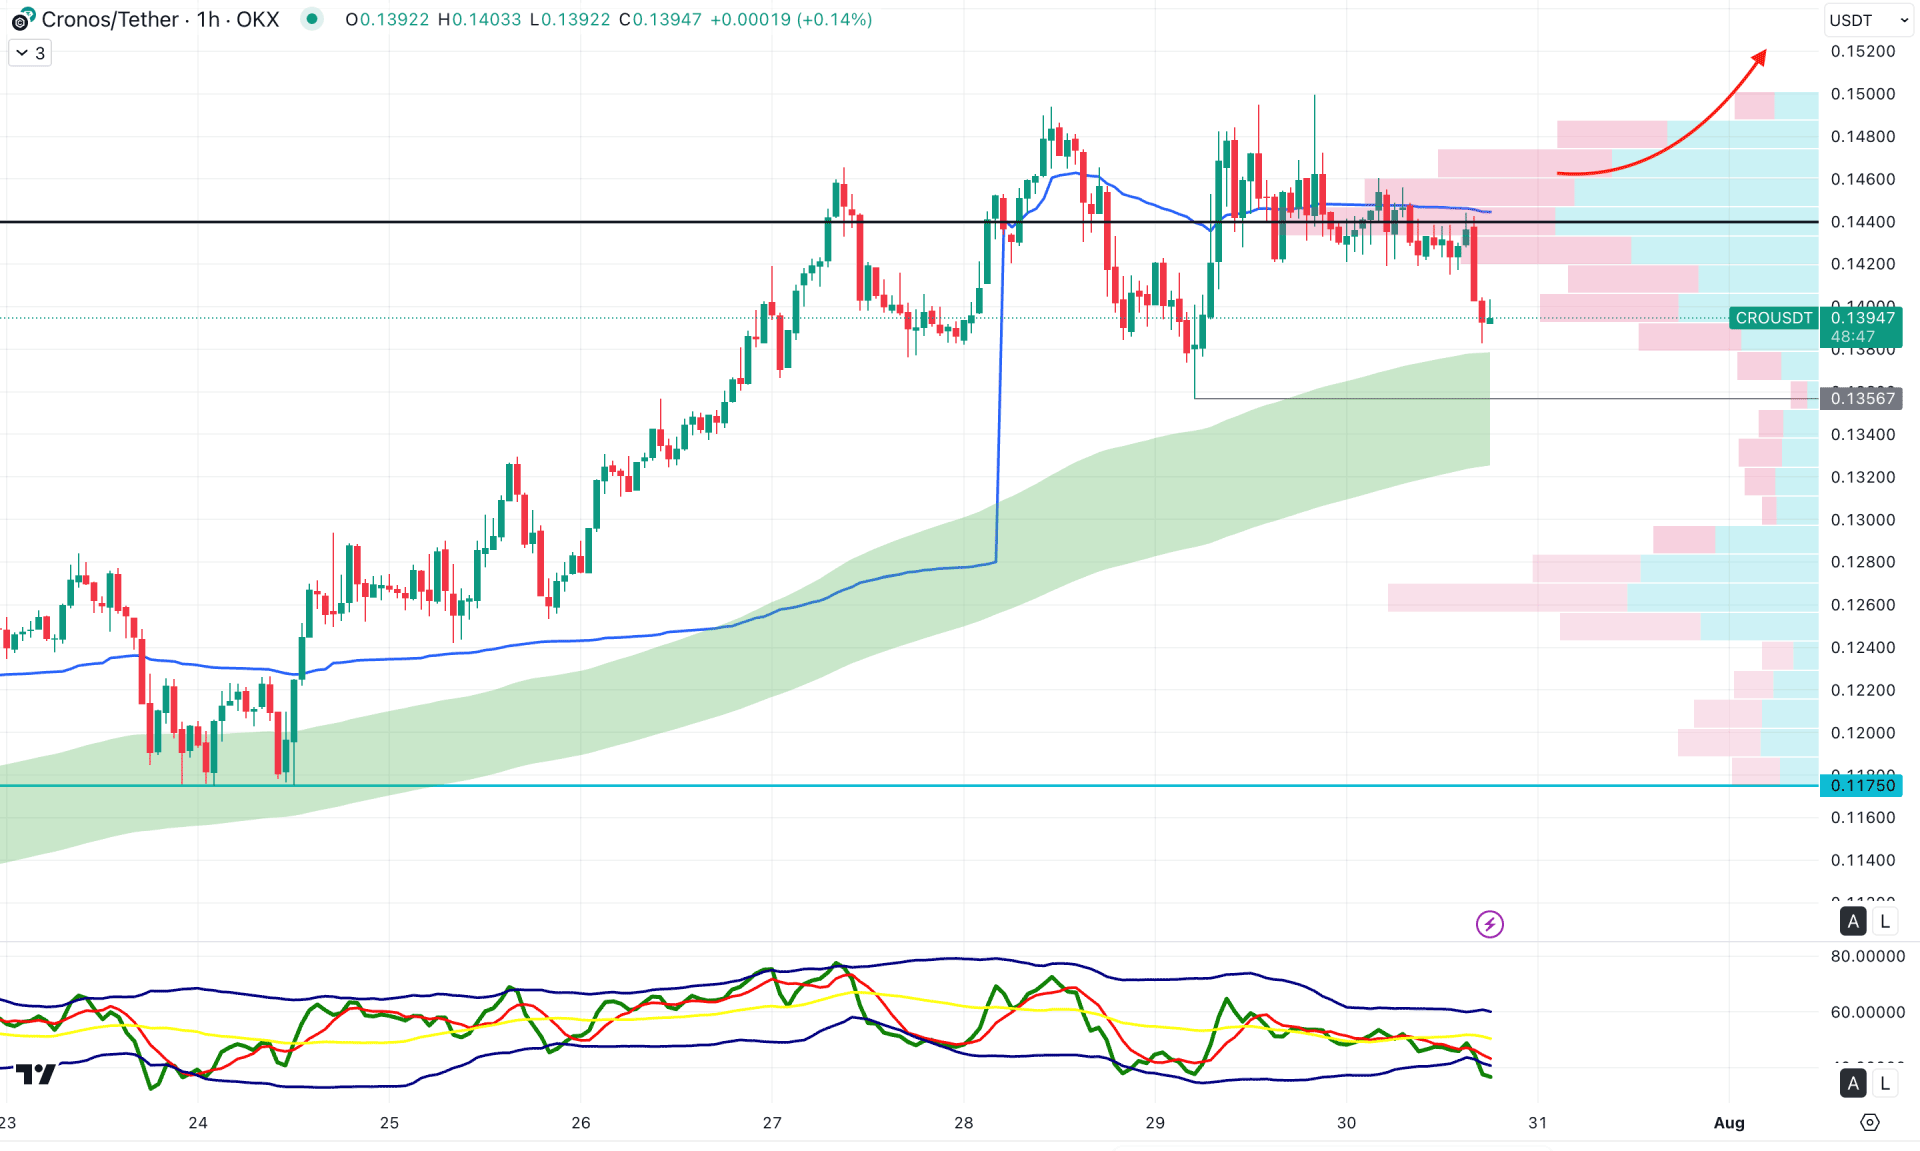
On the hourly timeframe, the current price is trading within a consolidation phase, as multiple violations of near-term levels have been observed. After forming a peak, the price moved toward the dynamic weekly VWAP line, while the Moving Average wave remained below the current price.
In the secondary indicator window, the Traders Dynamic Index (TDI) reached a recent low, suggesting active intraday selling pressure. As long as the TDI remains below the 50.00 neutral line, further downside pressure may be expected.
Based on this outlook, any bullish spike with a break above the VWAP level could be considered a long opportunity. However, the ongoing selling pressure may continue, especially if resistance forms around the moving average zone.
Based on the overall market structure, CRO/USDT is more likely to extend the buying pressure once the sufficient downside correction is over. As a long-term range breakout is in play, investors should monitor how the price retraces to the near-term support area before opening any long signal.


