
Published: March 10th, 2022
CRSP grabbed buyers’ interest after making a long downside move from 142.88 to 52.93 swing low. However, the price bucked a late-day reversal in Nasdaq stocks that finished Tuesday trading with more than 10% gain.
CRSP is one of the Cathie Wood stocks with a higher possibility of showing buying pressure, followed by the recent CRSP interview at Cowen’s Annual Health Care Conference. According to Cathie Wood, CRSP is one of the stocks that started fighting with the bearish pressure. In addition, it is one of the excellent business names with the hype of the genomics revolution.
In Cowen’s conference, Kulkarni updated the beta-thalassemia disease treatment, CTX101 with malignant tumor treatment, CTX110. According to Kulkarni, the CTX001 performed better in the clinical trial, while the CTX110 includes the use of gene-editing antigen receptors. Despite the positive outlook, CRSP is still 71% down from the January 2021 high, where the current EPS is at $4.70. The P/E ratio remains at 13.28, where the challenging factor is 5 years monthly beta, representing higher volatility.
The future potentiality with a lower price made this stock attractive to investors. Let’s see the upcoming price direction from the CRISPR Therapeutics AG (CRSP) technical analysis:
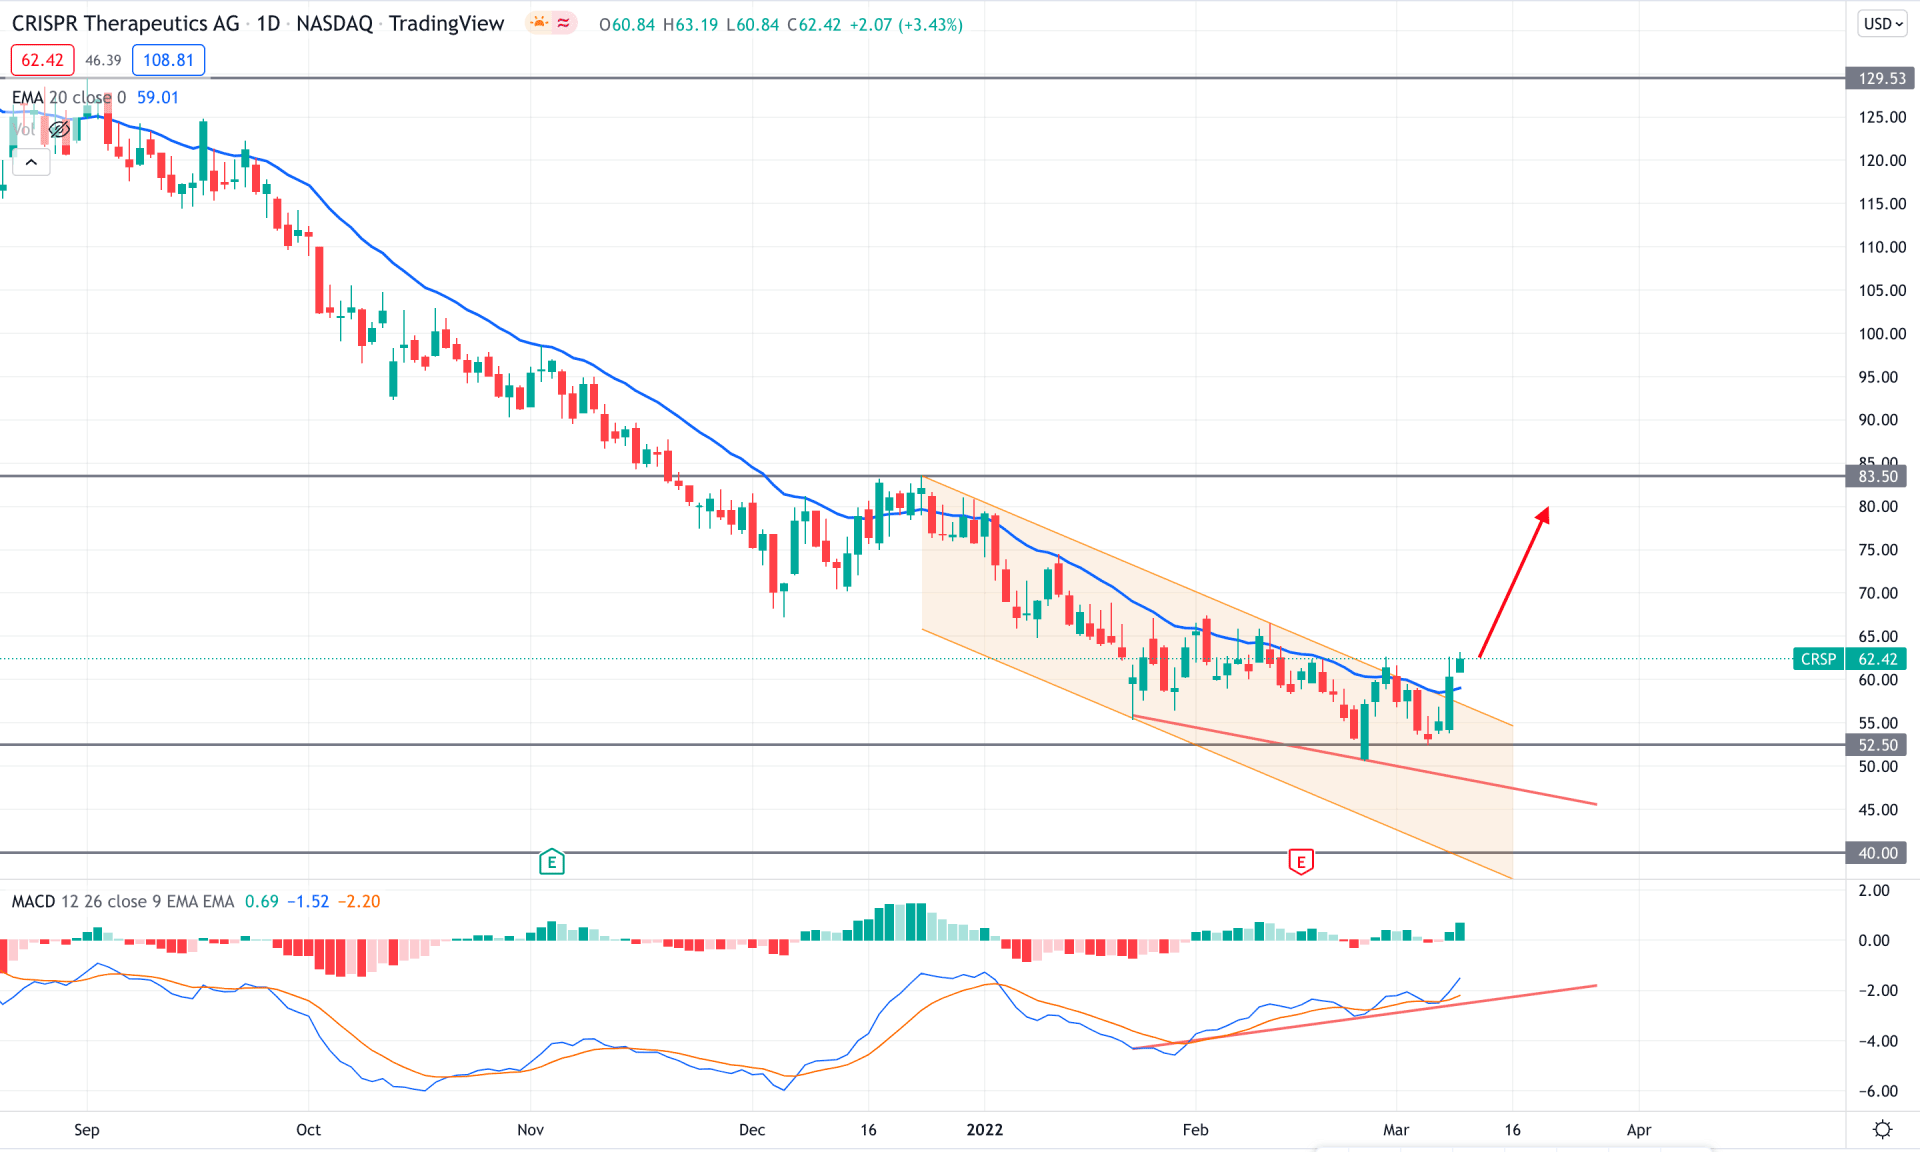
In the daily chart, CRSP is trading within a bearish trend where the recent bullish breakout from the bearish channel raised a question regarding the effectiveness of the existing selling pressure. On the other hand, the bullish daily close above the dynamic 20 EMA on the daily chart indicates that short-term bulls became active for the first time in the last two months.
The above image represents how the price grabs buyers’ attention where the divergence with the MACD line signifies a possible reversal. Moreover, the MACD Histogram remained corrective for a considerable time and formed a new high this week after Tuesday’s 10% gain.
In this context, investors should closely monitor how the price trades above the dynamic level where any buying pressure from 62.00 to 55.00 area has a higher possibility of taking the price up towards the 83.50 resistance level.
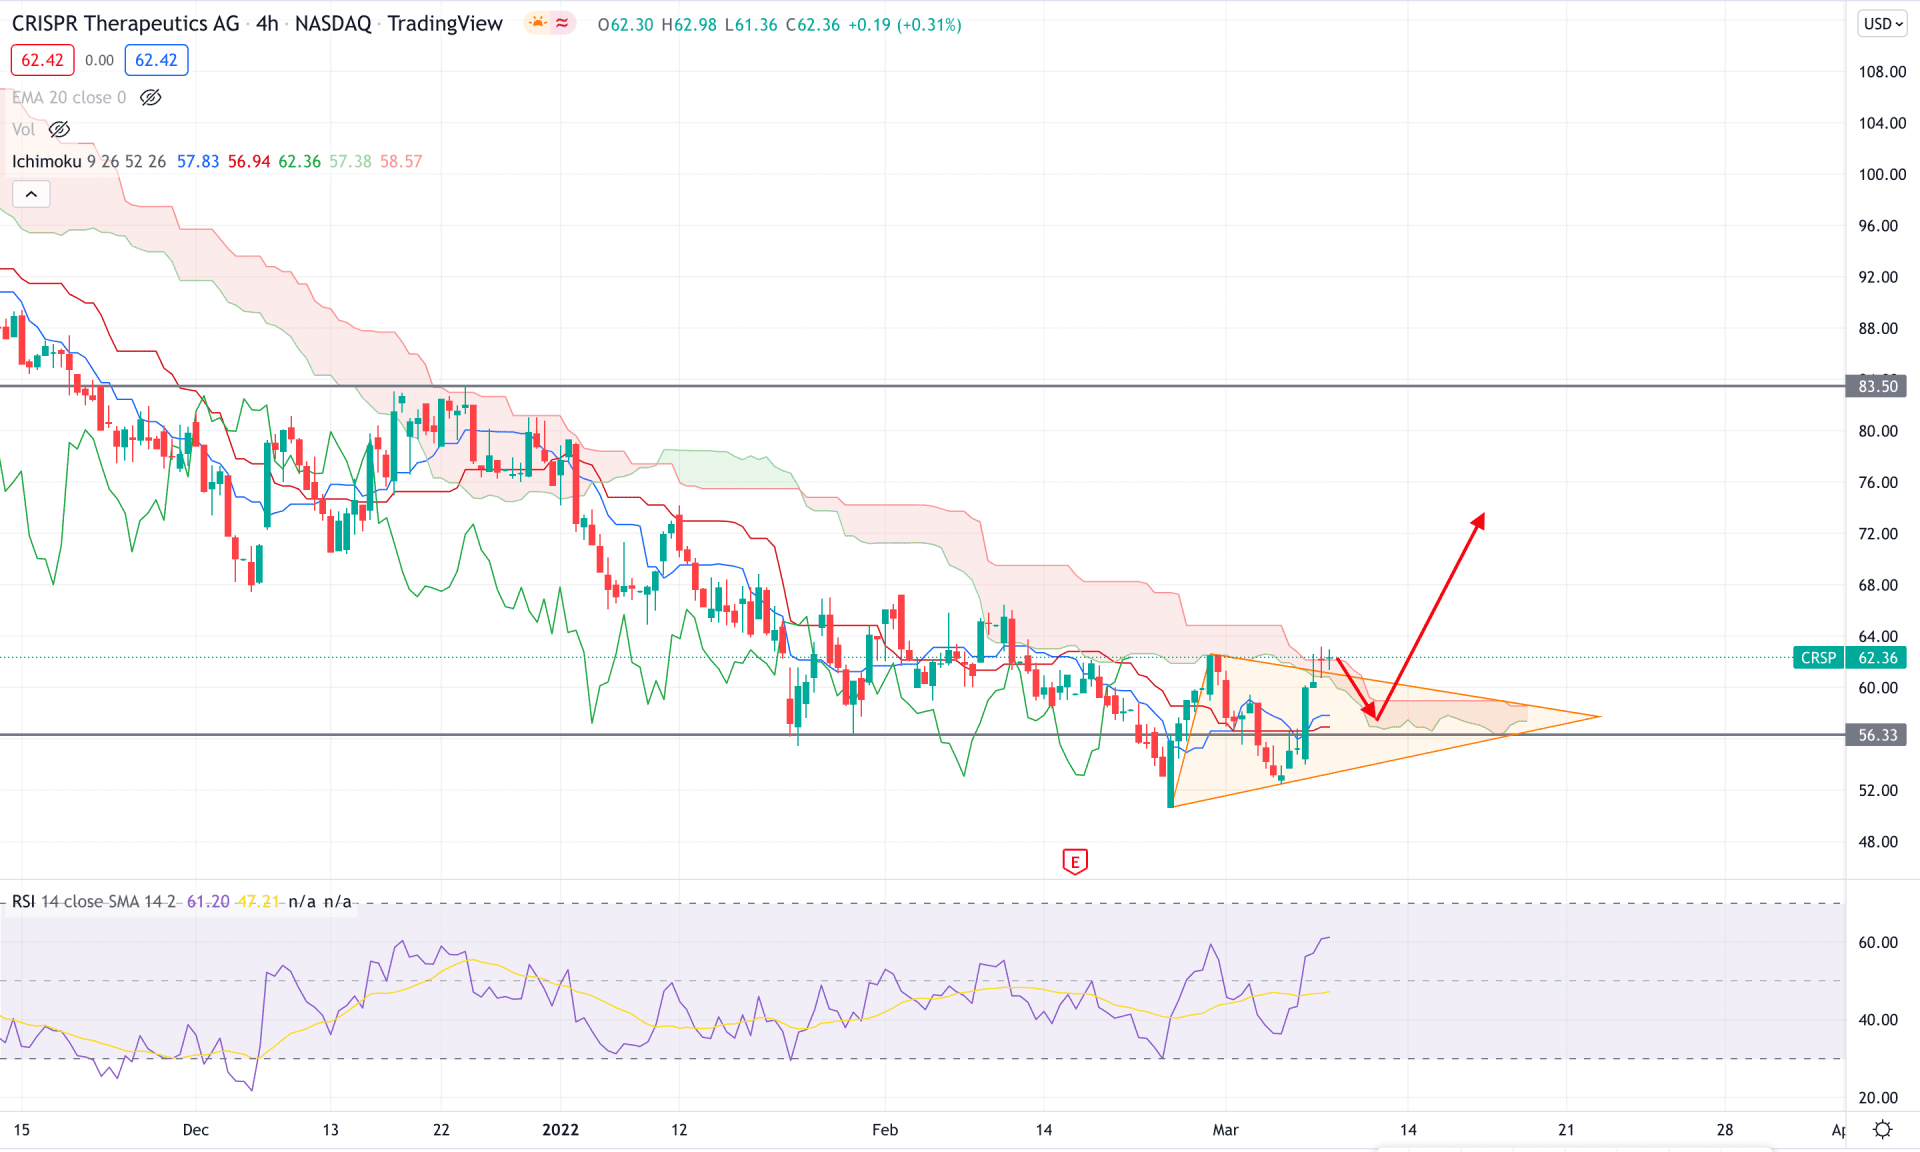
According to the Ichimoku Cloud, the current bearish trend in the CRSP h4 chart has become volatile as the price failed to make a new swing low below the 52.50 key support level. As a result, the price corrected higher within the symmetrical triangle where any bullish pressure from dynamic Kijun Sen has a higher possibility of extending the upside towards the 83.50 level. The Senkou Span A is still below the Senkou Span B with corrective pressure in the future cloud.
The above image shows how the price trades above the dynamic Kijun Sen, whereas the RSI is bullish. However, the price became indecisive above the Cloud resistance, pending a bearish correction.
In this context, investors should find a bullish rejection from the dynamic Kijun Sen area, where a bullish H4 candle above the 65.00 high has a higher possibility of taking the price up towards the 84.00 level. Conversely, a break below the 55.00 level with a red H4 close would be an alarming sign for bulls. In that case, another selling pressure may come where the primary target would be 40.00 psychological support.
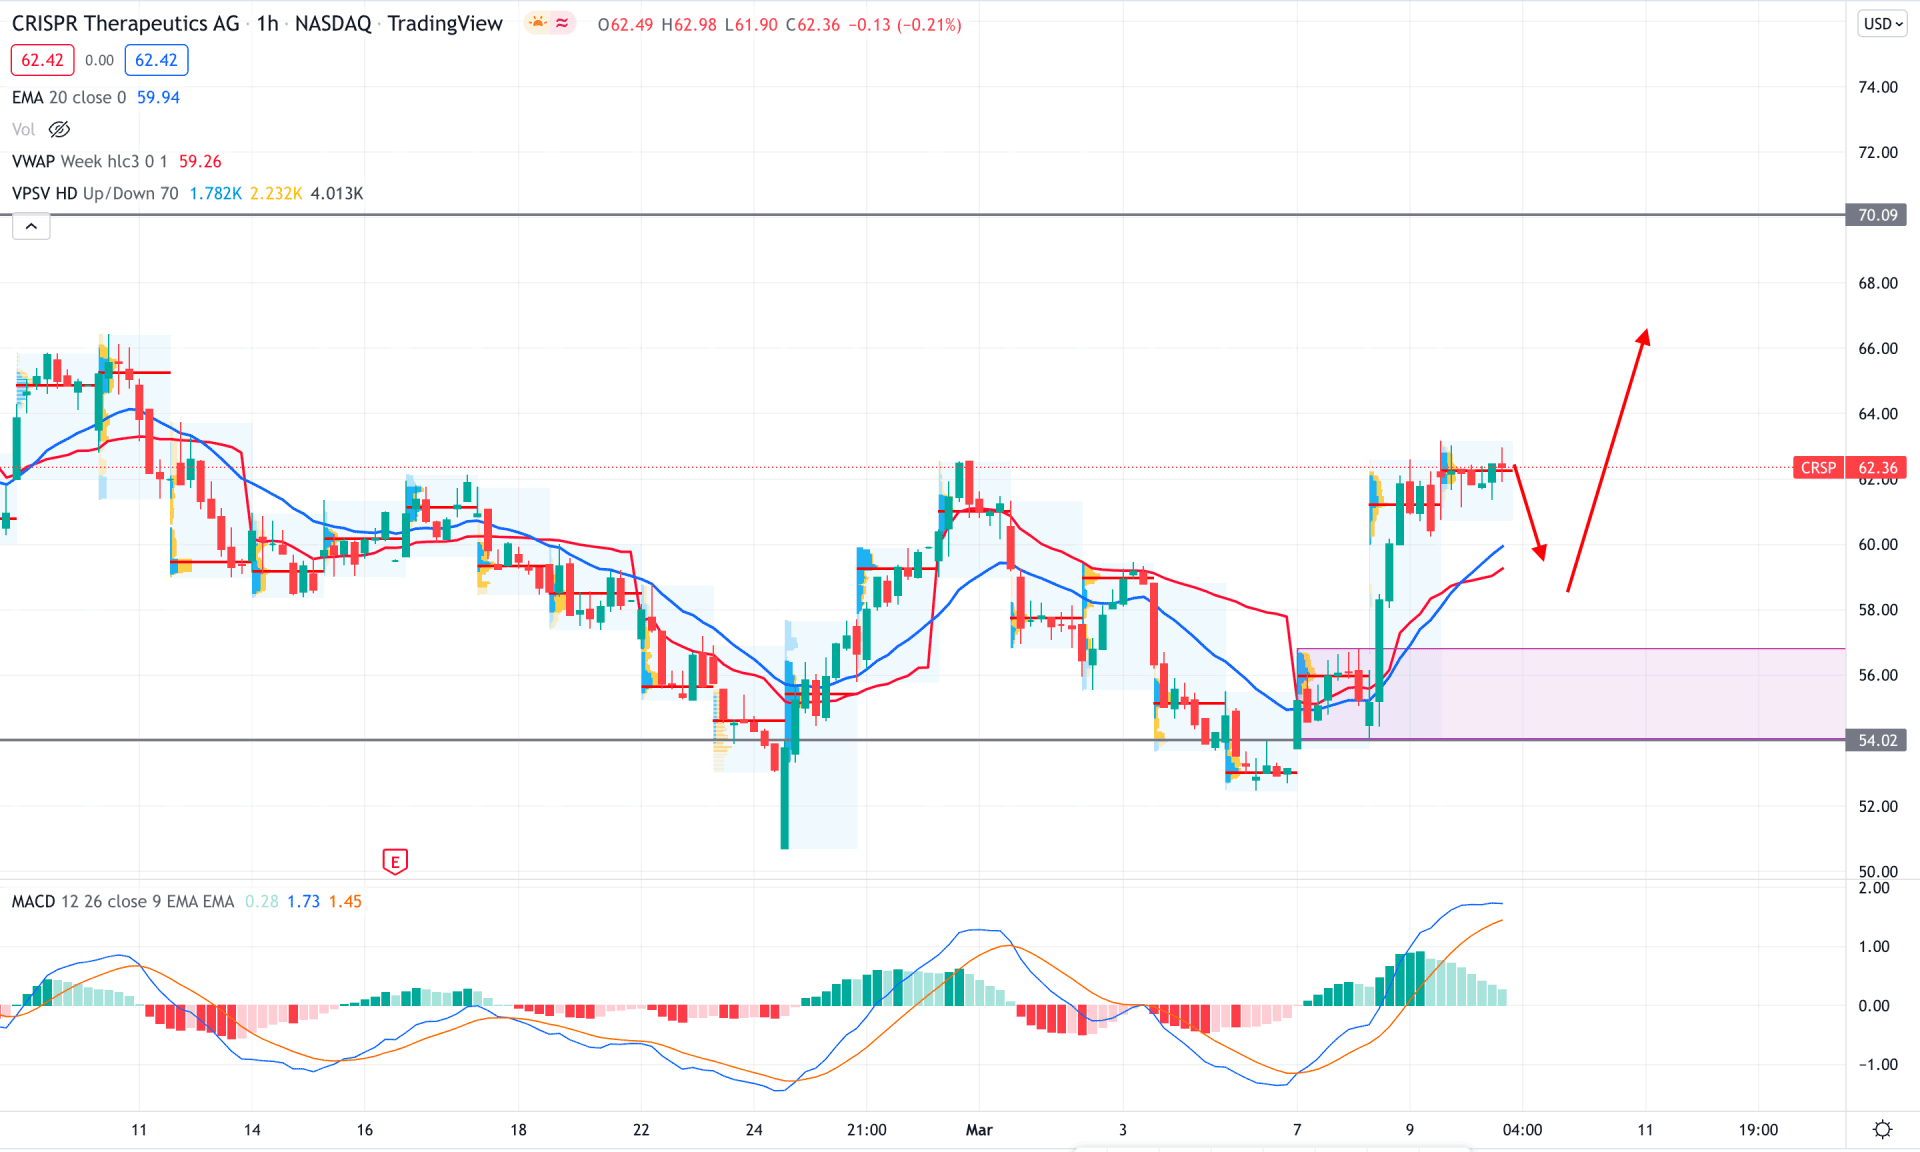
In the SRSP intraday chart, the broader market context is corrective as the recent bullish and bearish swings represent a ranging market. However, as the long-term price found a bottom at 52.50 level and showed a buyers’ interest, investors should find buying opportunities in the H1 chart.
The above image shows how the price moved above the dynamic 20 EMA with a bullish H1 close where the MACD Histogram remained bullish. On the other hand, the Bullish MACD Histogram showed a selling momentum towards the neutral zone, indicating a possible bearish correction.
In this context, investors should find a bullish rejection candle in the H1 chart from dynamic weekly VWAP before taking any long trade. Overall, any buying sign from 58.00- 54.00 will likely provide a higher success rate. However, the buying pressure is valid as long as the price trades above the 52.50 key support level.
Based on the current multi-timeframe analysis, CRSP is more likely to show a buying pressure where the primary target would be 83.50 level. On the other hand, investors should closely monitor how the price holds its bullish momentum above the 52.50 level, where any bearish daily candle below the 52.00 would be an alarming sign for bulls.


