
Published: June 16th, 2022
Coterra Energy Inc. showed a stable business while major stock indices showed a selling pressure due to the higher interest rate. The main reason behind the optimistic outlook of CTRA is its focus on US-based assets. The company has six rigs in the Permian Basin and another two in the Anadarko Basin, running with full force. The company has allocated $1.4 to $1.5 billion to these assets, intending to produce 625 million barrels of oil equivalent a day. Therefore, if the US energy production returns with full force, it might help the company grow with the stock price appreciation.
Coterra Energy Inc. currently offers a 45 cents dividend-yielding 1.76%, which makes it a valuable stock. Moreover, the current P/E ratio and a current ratio of the company show a stable value, while the 0.18 dividend payout ratio indicates a low-risk investment.
Let’s see the future price direction from the Coterra Energy (CTRA) technical analysis:
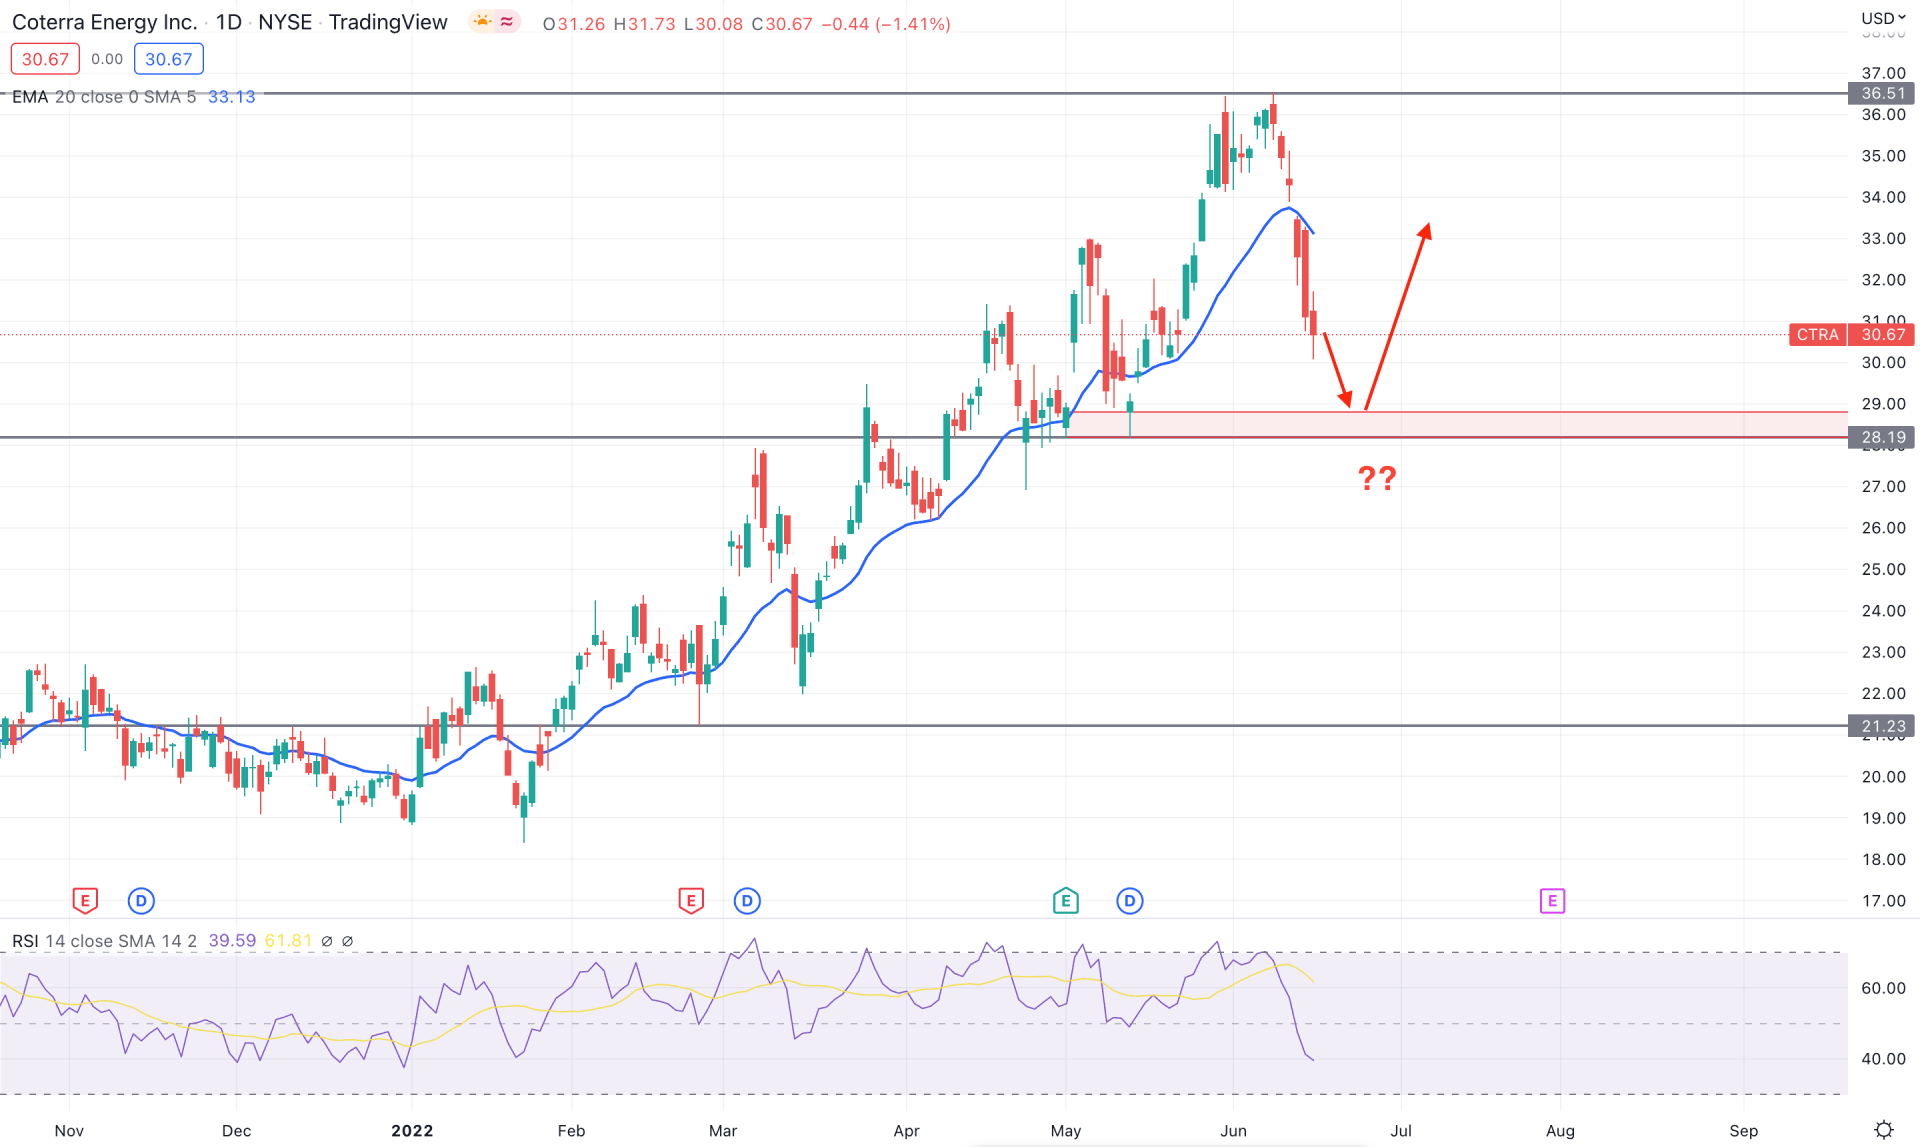
In the daily chart, CRTA trades within a solid bullish trend, although the recent bearish pressure below the dynamic 20 EMA is intense. However, the price structure in the daily chart is still steady as bears failed to take the price below the previous swing low. Moreover, the previous bullish pressure from the 28.19 support level left the 29.00 to 28.18 area untouched. Therefore, if the current selling pressure shows any bullish rejection from the 29.00 to 27.00 area, it would create a potential bullish opportunity.
The above image shows how the RSI level moved lower below the neutral 50 levels and reached the potential reversal zone. Since January 2022, it is the first time to see the RSI moving to the 40 level. On the other hand, the price made a solid bearish pressure below the dynamic support where the dynamic 20 EMA is working as minor resistance.
Based on the daily structure, investors should monitor how the price trades between 30.00 to 27.00 area from where a strong rebound may happen. In that case, any bullish daily candle above the dynamic 20 EMA would be a buying opportunity that may extend the price towards the 36.51 level. On the other hand, the break below the 27.00 level with a bearish daily candle would alter the current market structure and initiate a broader correction.
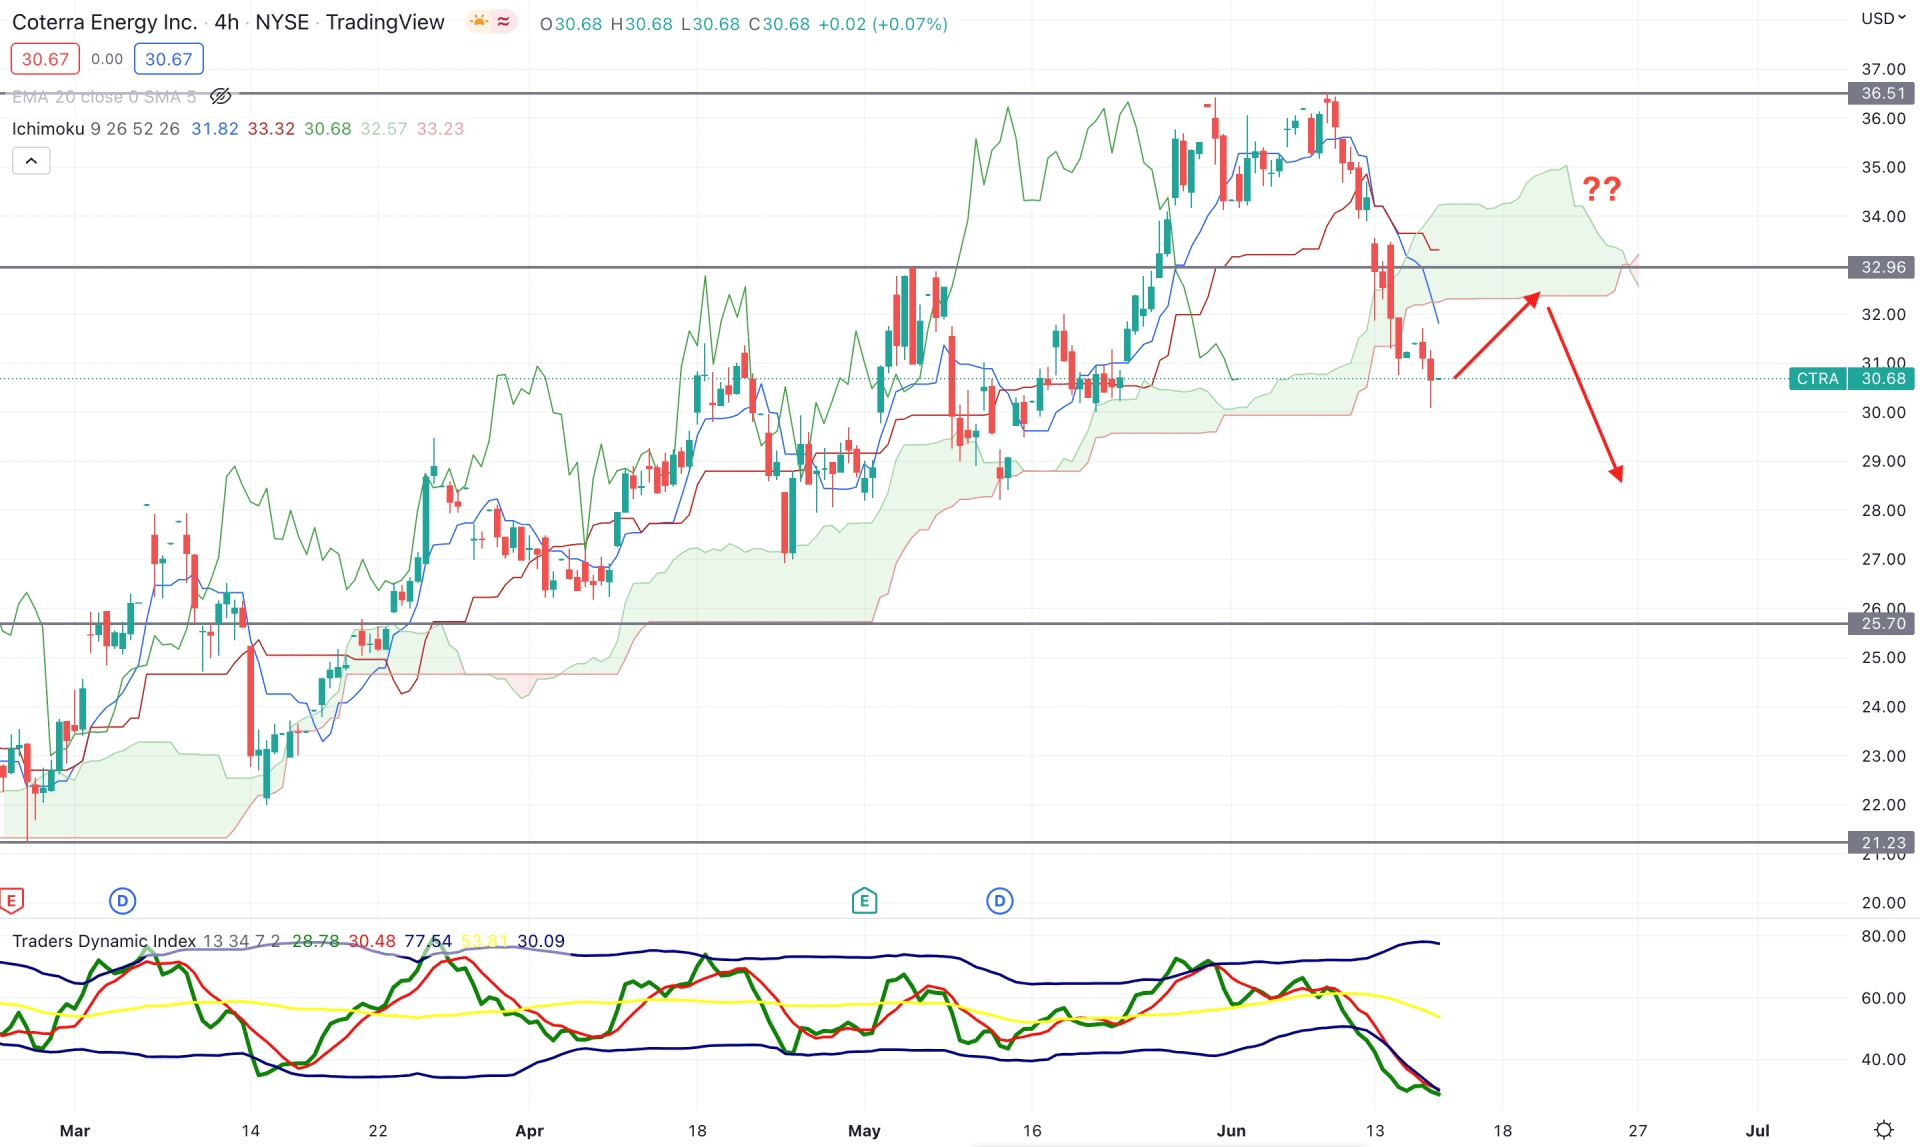
According to the Ichimoku Cloud, the buying pressure in the CRTA was intense, with multiple bullish rejections from cloud support. However, after testing the 36.51 level, bears became aggressive in the market and pushed the price below the Cloud area for the first time since March. On the other hand, the future cloud flipped the direction where the Senkou Span A moved below the Senkou Span B while the Lagging Span remained below the price.
The above image shows how the Traders Dynamic Index reached the lower band, indicating that bears dominate the bulls in the current market. Therefore, the selling pressure may extend until the TDI level moves above the neutral 50 area. On the other hand, the dynamic Tenkan Sen and Kijun Sen are above the price and working as minor resistances. The recent selling pressure extended the gap between the price and dynamic Kijun Sen, which might work as a bullish mean reversion.
Based on the H4 context, any selling pressure from dynamic Kijun Sen or static 32.96 level is more likely to take the price down towards the 25.70 area. On the other hand, an intense buying pressure is needed to see above the 33.00 level to consider it as a buy above the 36.51 level.
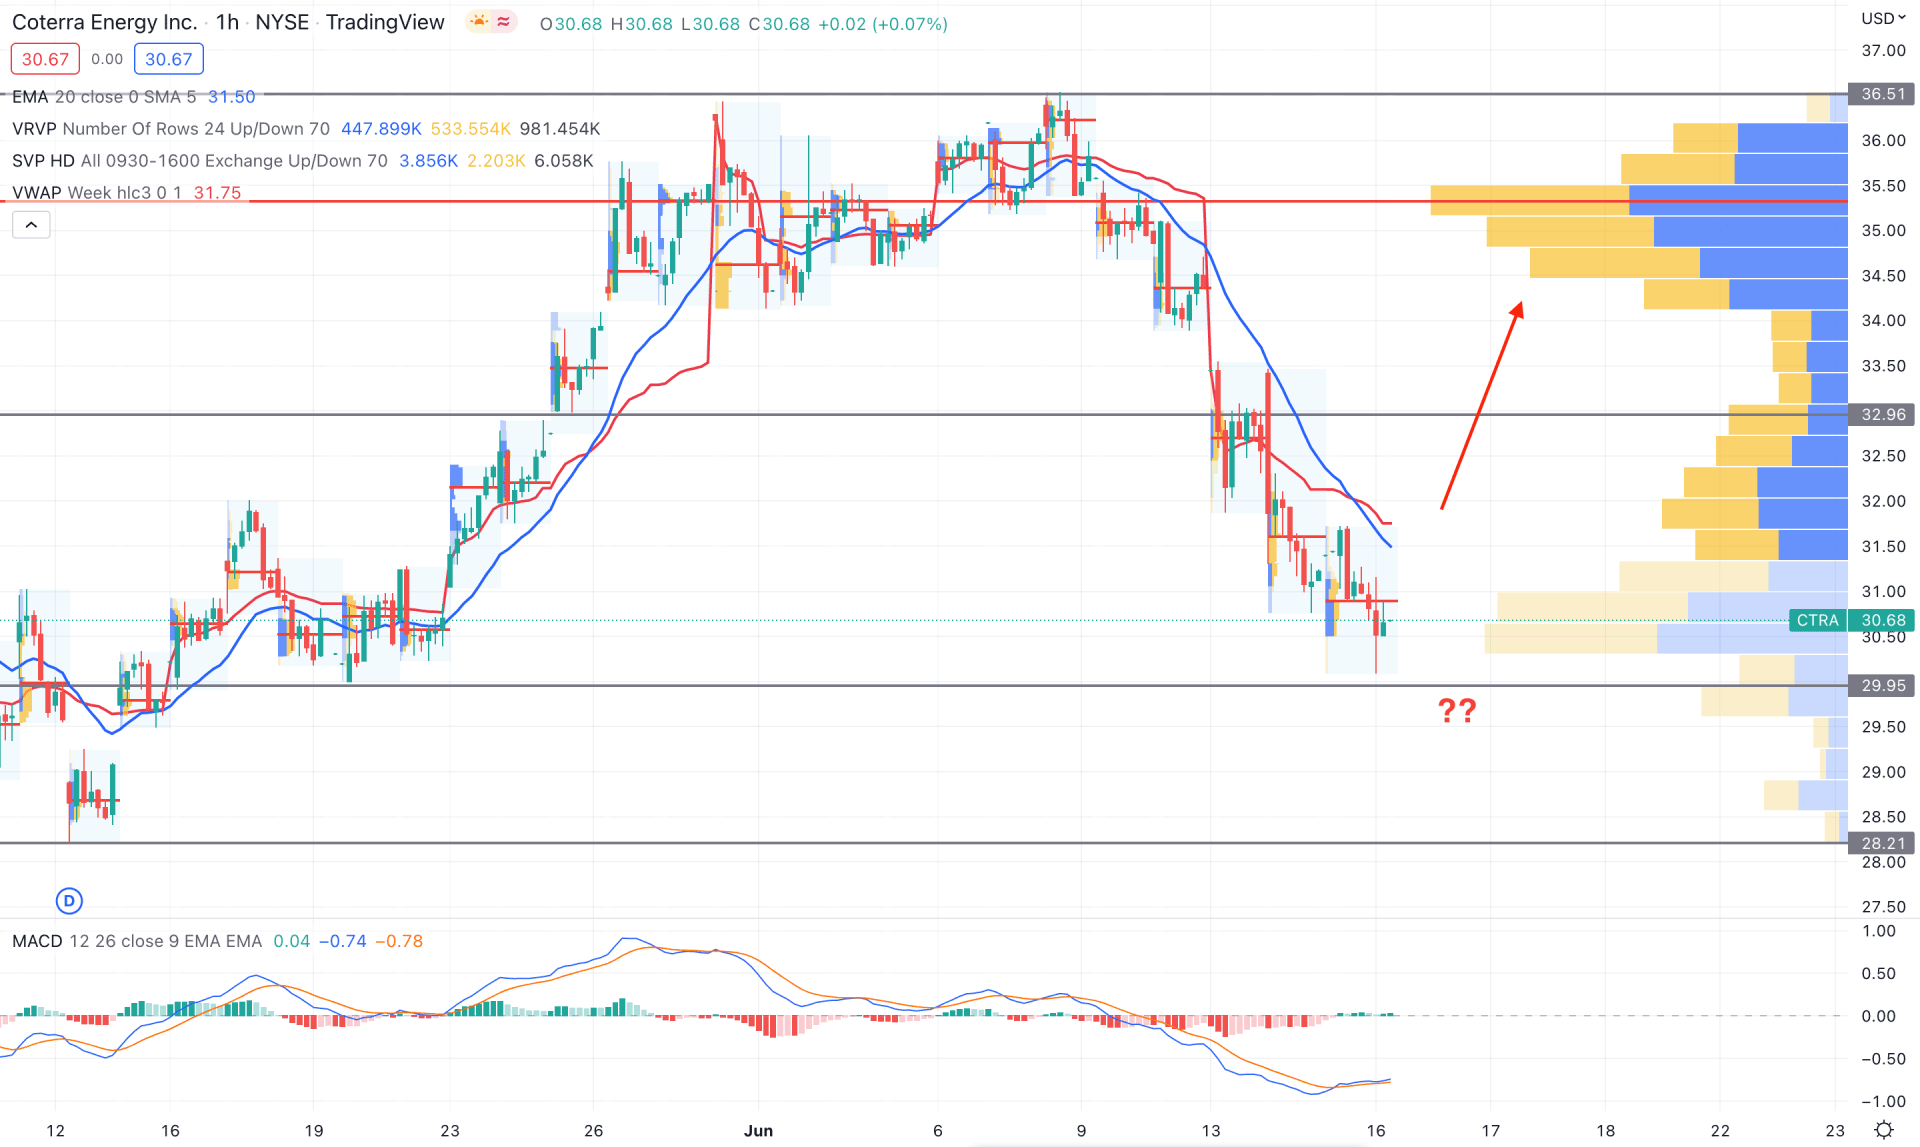
In the CRTA intraday chart, the current price remained bearish as it is trading below the dynamic 20 EMA on the H1 timeframe. Moreover, the highest trading volume from the visible range was at the 35.40 level, indicating that selling pressure from that area is potent. However, the gap between the high volume level and the current price is high, where a minor bullish correction is pending.
The above image shows how the MACD Histogram remains corrective at the neutral zone while the dynamic weekly VWAP is above the current price. In that case, investors should monitor how the price reacts to the dynamic weekly VWAP level where H1 close above the VWAP would extend the buying pressure towards the 35.00 area. On the other hand, the break below the 29.90 level would open another bullish opportunity from the 28.21 support level, depending on the price action.
As per the current market context, the intraday market momentum in the Coterra Energy Stock (CTRA) is bearish and needs to rebound to match the higher timeframe’s direction. On the other hand, any selling pressure from the H4 dynamic level would open a bullish opportunity in this instrument.


