
Published: March 22nd, 2022
Costco Wholesale Ltd. is one of the US companies with a stable position in generating revenues. Moreover, its unique bulk-sized product sells and membership method helps the company grow. In the latest quarterly earnings report, the company showed a 16% gain in revenue while the EPS moved higher from $2.15 to $2.93. Moreover, the company uses higher negotiations with suppliers that might help it to grow even if costs are higher due to supply-demand constraints.
Moreover, the company showed intense activity in the business expansion, where 828 stores are active in the world. Furthermore, the management showed a possibility of extending the store number as the pandemic-driven situation is over. In the plan, new warehouses in China, France, Japan, and other continents in the US are in line that might work as a key revenue generator for investors.
Based on the current business outlooks and activity with new warehouses influenced investors, to have a 6.3% gain in the previous week ending 18 March 2022. Let’s see the upcoming price direction from the Costco Share (COST) technical analysis:
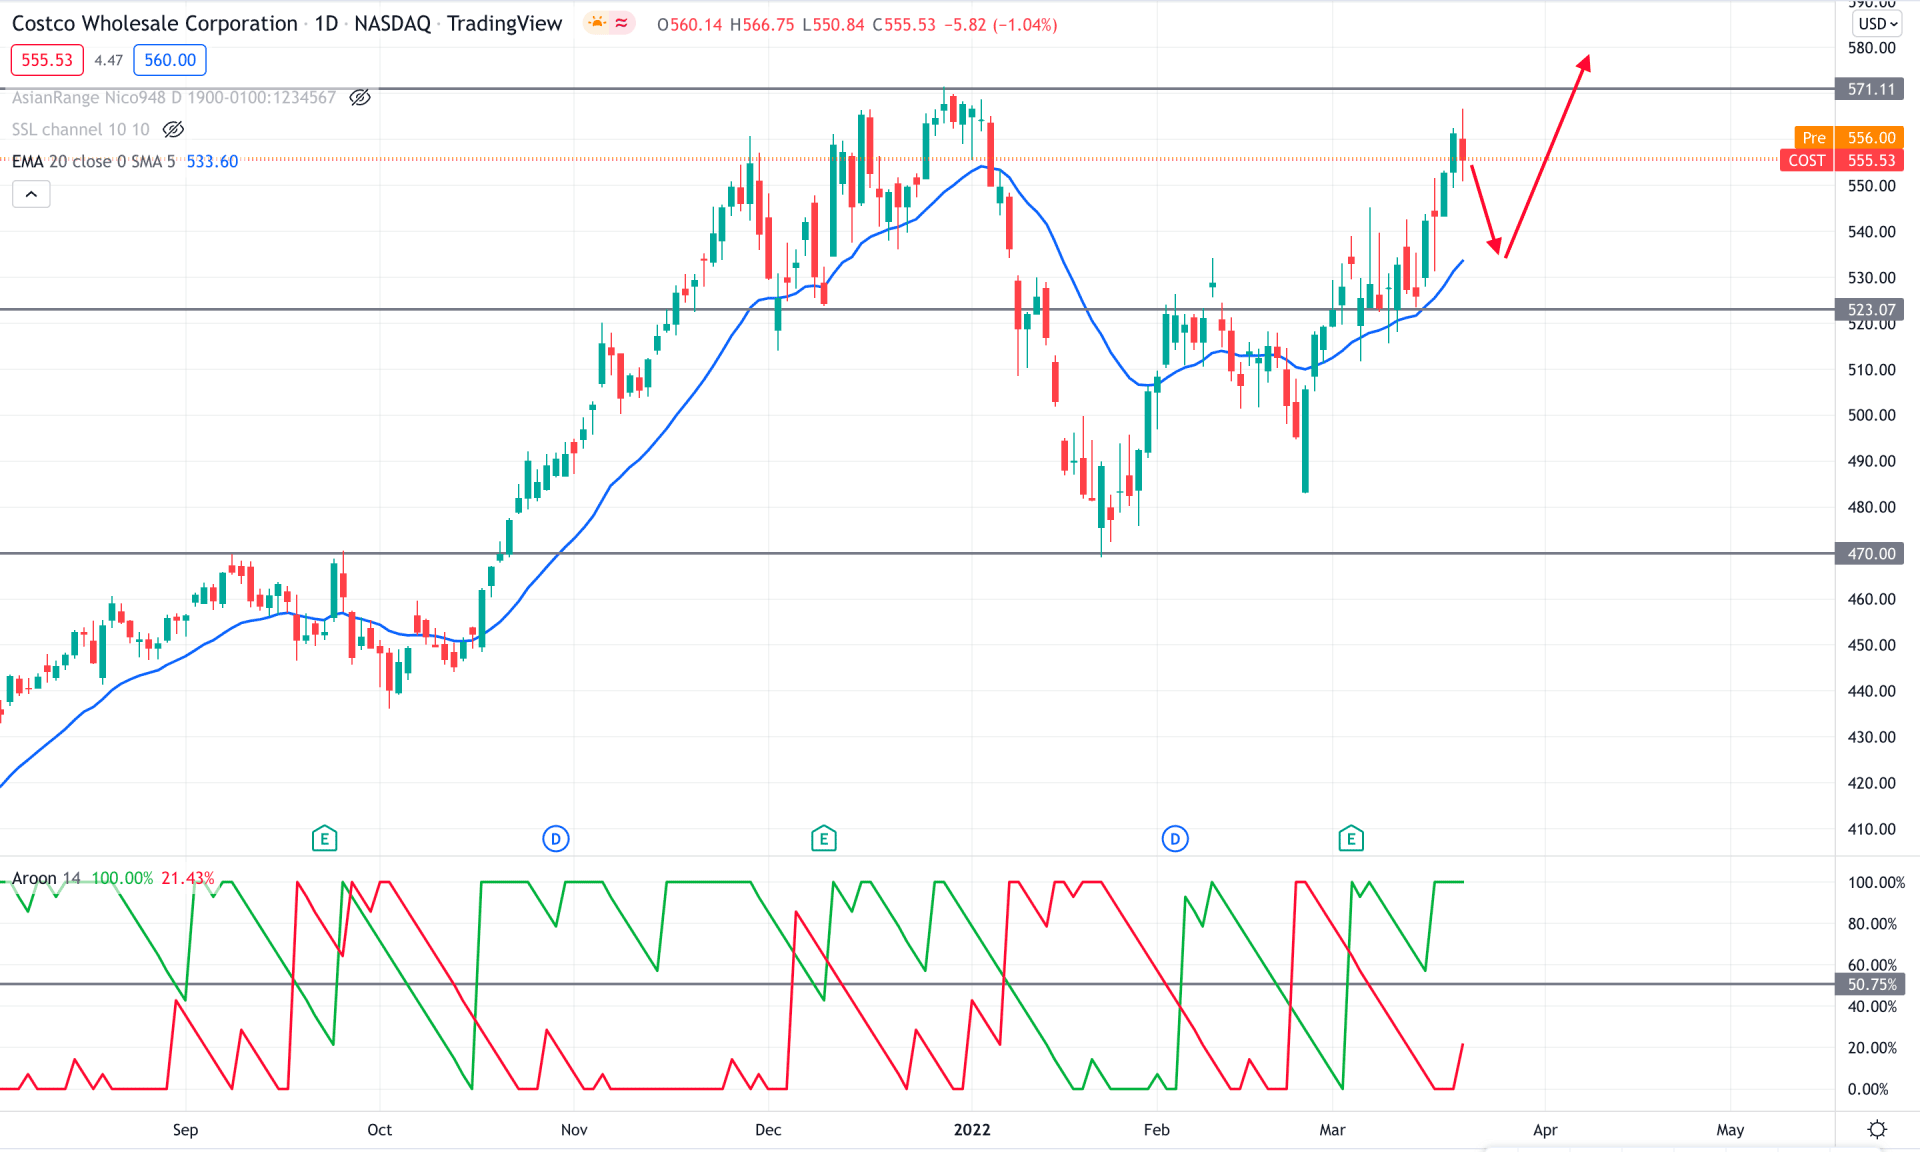
In the Costco stock daily chart, the price continued the broader bullish trend where the recent failure to break below the 470.00 weekly support influenced investors to consider it a buy. After forming bullish rejections at the 470.00 bottom, the price accumulated at the 523.00 level before showing a false break below the dynamic 20 EMA. However, as bulls overtook the 523.00 resistance level, the market sentiment changed from bearish to bullish.
The above image shows how the early trend shifted its direction from bearish to bullish with the crossover in the Aroon indicator. The Aroon Up ( green line) moved higher above the Aroon Down (red line) and reached the 100% level, indicating that the market trend changed its momentum from bearish to bullish. Moreover, the current Aroon Up level is at 100% area, which indicates intense buying pressure.
Based on the current price structure, the market trend has reached the top as the Aroon Up touched the 100% level. Therefore, a minor correction is pending where the price may come down towards the dynamic 20 EMA support. In that case, any bullish sign from 550.00 to 530.00 area has a higher possibility of increasing the buying pressure in the coming days.
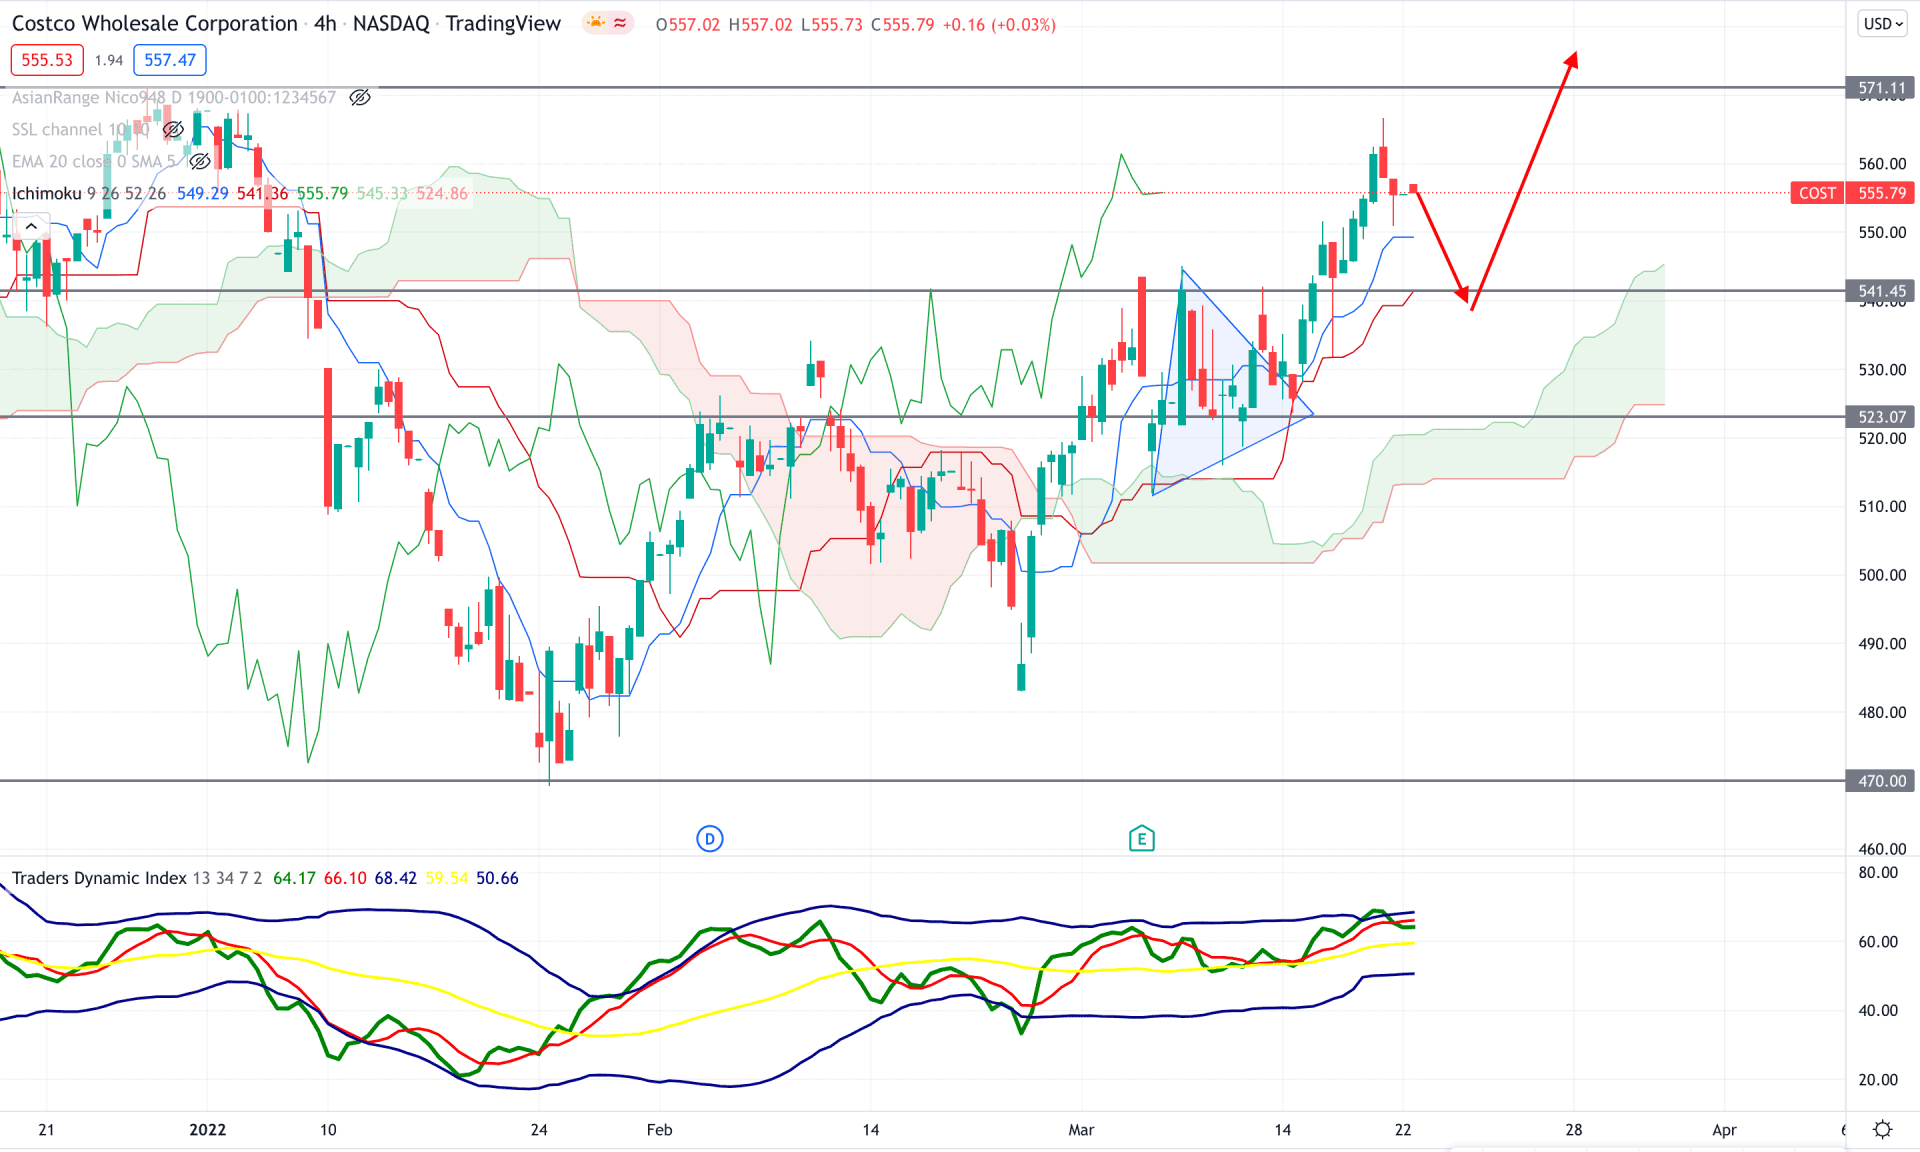
According to the Ichimoku Cloud analysis, the Costco Stock (COST) is trading within a bullish momentum as the current price is above the Cloud support with a symmetrical triangle breakout. Moreover, the future cloud is bullish as the Senkou Span A is above the Senkou Span B and moving upwards. Meanwhile, the Lagging Span is also above the price showing bullish pressure.
In the indicator window, the Traders Dynamic Index, which represents the average traders' activity in the price, is above the 50 neutral lines. It is a sign that bulls are more aggressive in price than bears. On the other hand, the current price is above Tenkan Sen and Kijun Sen, which indicates that short-term and medium-term traders are bullish on this stock.
Investors should find buying opportunities after a minor correction in this context, where bullish rejections from 550.00 to 540.00 may take the price up towards the 571.00 resistance level. On the other hand, a break below the 523.00 weekly level may eliminate the buying pressure and increase the bearish possibility towards the 500.00 area.
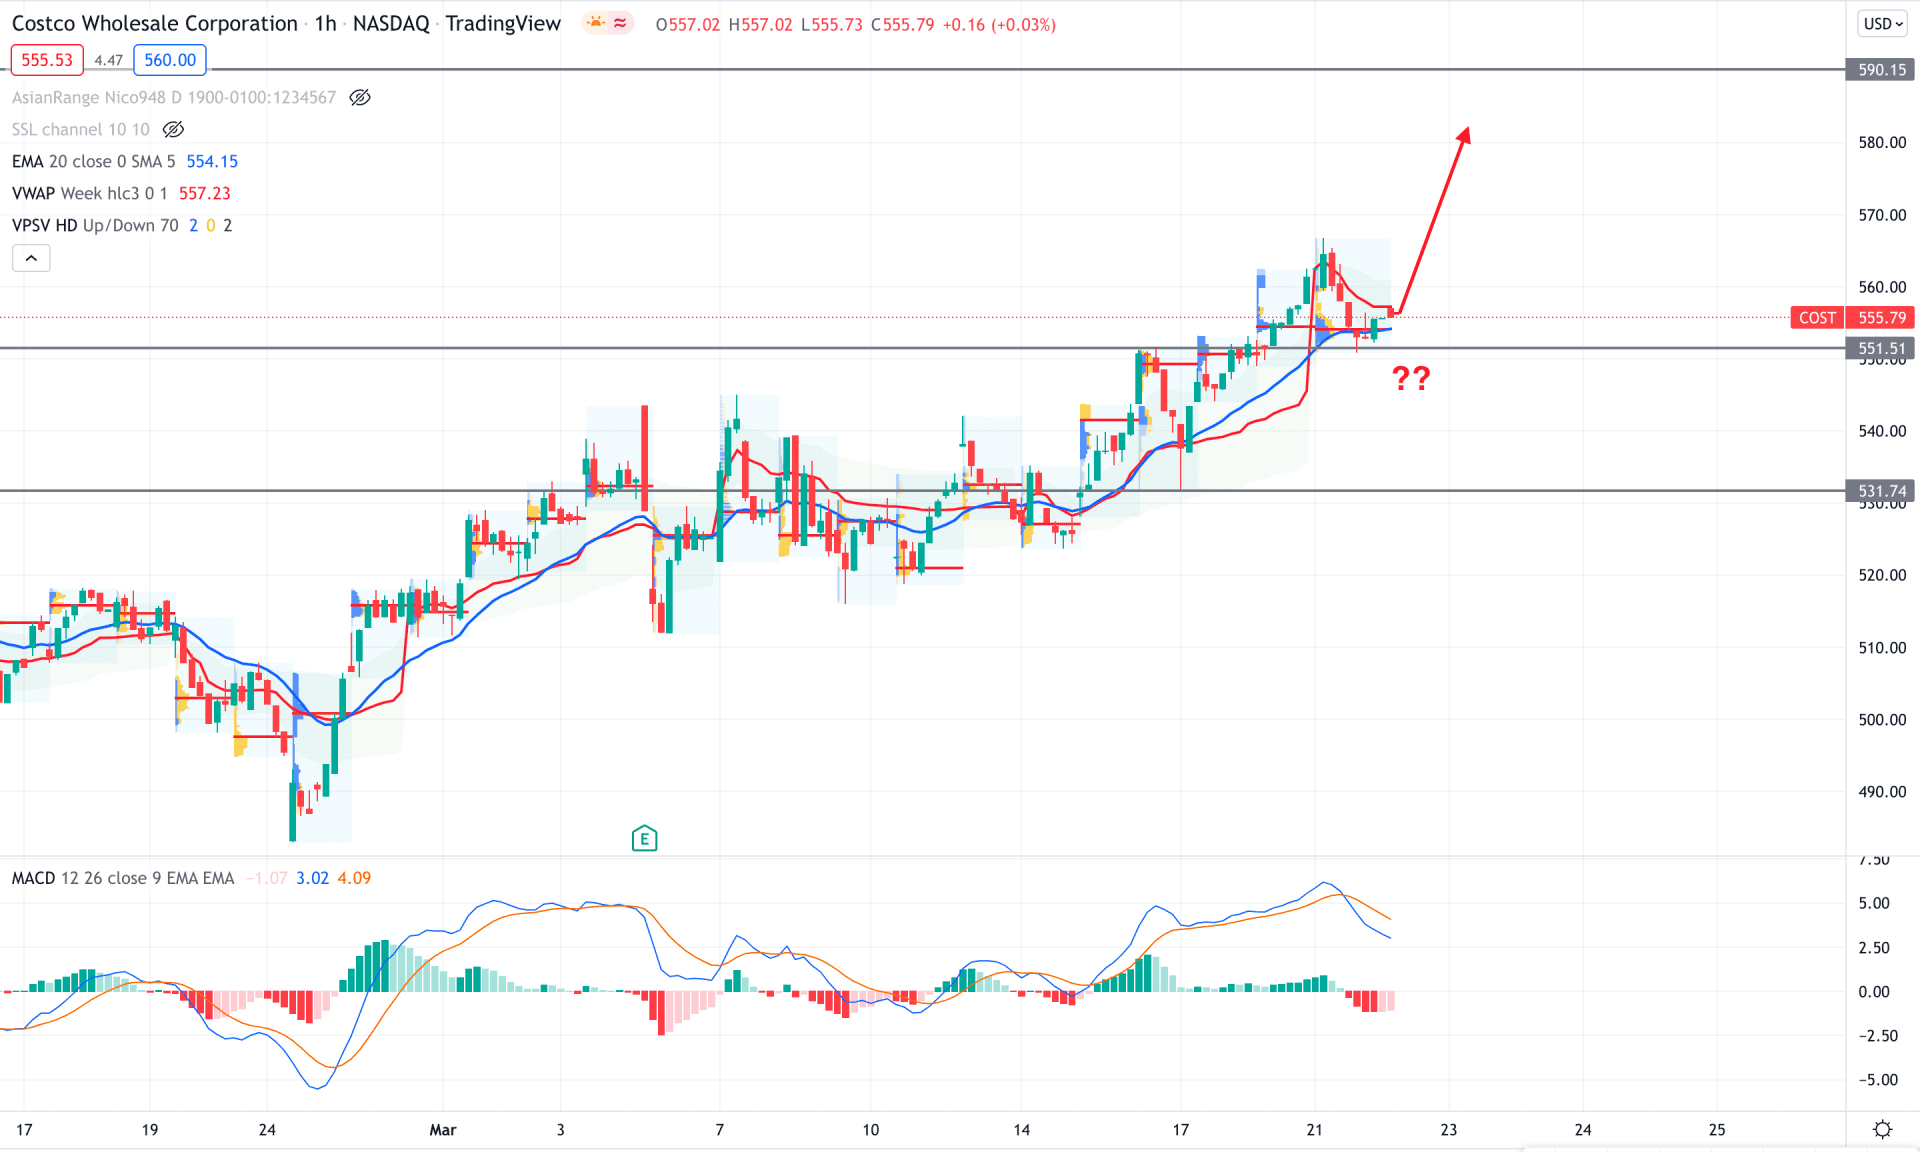
In the intraday chart, COST trades within a buying pressure where the current price trades above the dynamic 20 EMA. Moreover, the most recent intraday high volume level is at 554.21, which is below the current market price. Therefore, as long as the price trades above the static 551.51 support level, we may expect another bullish leg in the intraday chart.
The above image shows how the MACD Histogram moved to the bearish zone, indicating a selling pressure in the price. Moreover, the current price moved below the dynamic weekly VWAP level. Therefore, bulls should wait for a rebound where a bullish H1 candle above the dynamic weekly VWAP with the MACD Histogram above the neutral level would increase the buying pressure. On the other hand, a break below the 551.51 level with a strong bearish H1 candle may initiate a deeper correction towards the 531.73 level.
As per the current market context, COST investors should find buying opportunities in the intraday chart to join the long-term bullish rally. As the company's business structure is strong with a possibility of extending warehouses in different counties, it might be the best option to buy the stock from the dip and hold for long-term gains.


