
Published: March 4th, 2025
Costco has successfully traversed the market thanks to its strategic investments, customer-focused strategy, merchandise campaigns, and emphasis on membership expansion. Due to these advantages, COST is now positioned as a strong consumer defensive investment with respectable earnings and revenue growth.
According to analysts, the outlook for Costco's future earnings is positive. The Analysts' Consensus Estimate for second-quarter earnings is $63.2 billion, an 8.2% rise over the reported amount from the previous year. Regarding earnings, over the last 30 days, the consensus expectation has risen by three cents to $4.09 per share, indicating a 10.2% increase year over year.
Costco's long-term success has been largely attributed to its membership-driven business structure, competitive pricing, and expansion initiatives. The business attracts customers looking for convenience and value by providing goods at a discount. These elements are anticipated to positively affect the final outcomes.
The corporation maintains low costs because of its effective inventory management and large purchasing power. Because of this aggressive price policy, Costco is able to sustain consistent shop visitation and strong sales volumes. Comparable revenue growth is projected to be 4.3% in the second quarter, with increases of 4.3%, 4.2%, and 4.1% anticipated in the US, Canada, and other international regions, respectively.
Additionally, Costco's high renewal of membership rates – which frequently exceed 90% – reflect its devoted client base and provide a reliable source of income. Regardless of general changes in the economy, membership fees provide a consistent source of revenue. During the reviewed quarter, we anticipate an 8.1% rise in membership fees.
At the moment, Costco is valued higher than its competitors in the same industry. The company's price-to-earnings (P/E) ratio for the next 12 months is 55.59, which is more than the S&P 500's 21.96 and the marketplace average of 33.05. Additionally, over the past year, the company has been trading over its median P/E ratio of 49.57. This high valuation raises the possibility that investors are paying more than the company's expected rate of revenue growth.
Let's see the future price direction of this stock from the COST technical analysis:
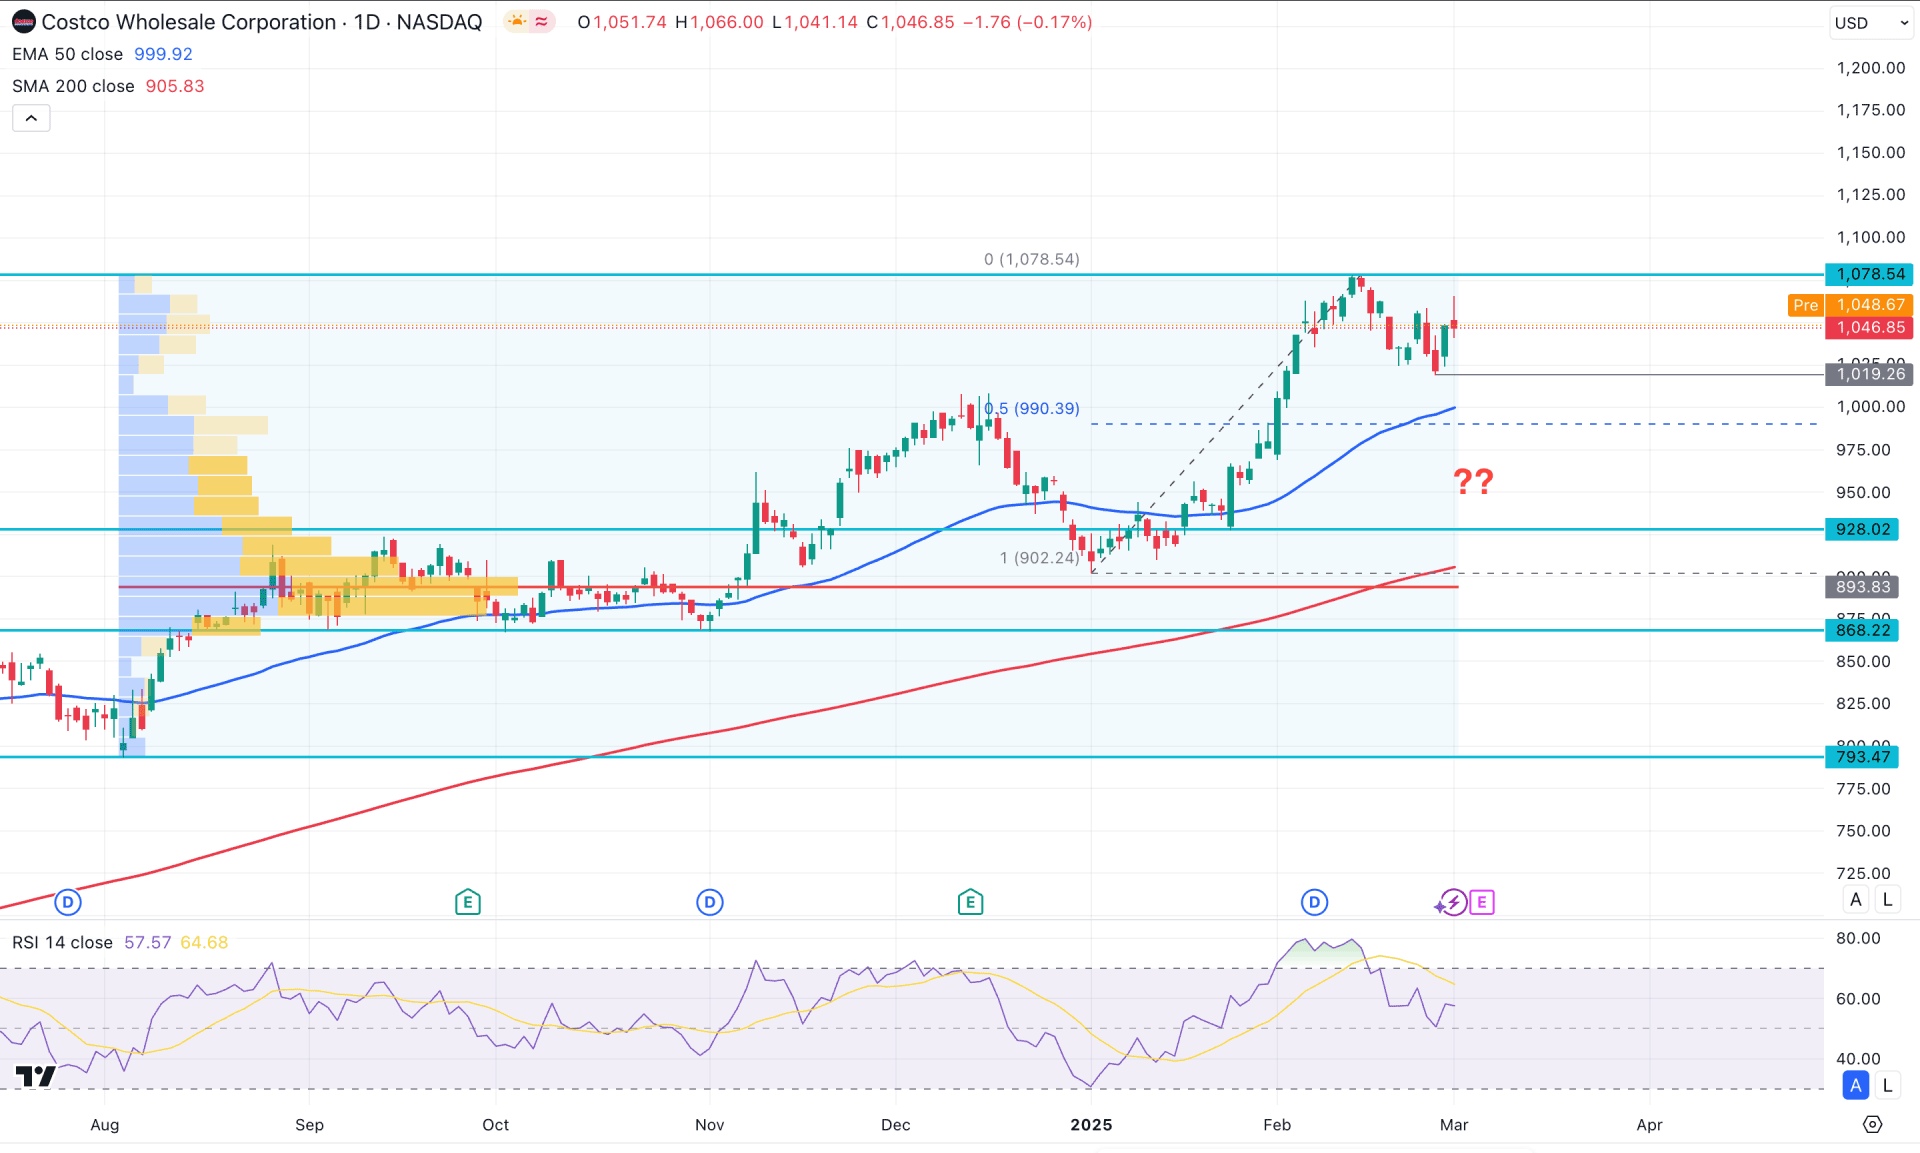
The ongoing bullish trend of Costco stock is clear in the daily chart. A stable market is visible above the 1000.00 psychological level, creating a new multi-year high price. Investors should primarily monitor how the price holds its momentum, as a bullish reversal could extend the current market trend.
In the higher time frames, the latest monthly candle closed bullishly with two consecutive positive months. However, the current price is trading indecisively, and a valid rebound is expected on the bullish side. The weekly chart shows a similar story, with a top formed at the 1078.54 level. A recent recovery is pending before the existing market trend can extend further.
In terms of volume structure, the most active level seen since August 2024 is at the 893.83 level, which is 14.59% down from the current price. Since the price is currently extended above the high-volume line with no significant volume activity at the top, we may expect a downside correction as a mean reversion.
Looking at the main price chart, the 200-day Simple Moving Average has had a bullish crossover with the high volume line. This is a sign of a strong bullish trend, from which a valid rebound is possible near the support area. The 50-day Exponential Moving Average, just below the current price, is acting as minor support. Given the market context, the downside possibility for mean reversion could test the 50-day Exponential Moving Average before any price direction is confirmed.
In the indicator window, the Relative Strength Index (RSI) has rebounded from the overbought level and is now in the neutral area. However, it failed to breach the 70.00 line and is still hovering above it.
Based on the daily market outlook for Costco stock, the immediate swing low is at the 1019.26 level, which could be a crucial price to watch. Breaching this line could take the price below the 50-day Exponential Moving Average. In that case, the 1000.00 to 992.8 level would be a valid buy point, depending on the price action. On the bullish side, overcoming the 1078.54 level could open the room for a move towards the 1200.00 psychological level.
On the bearish side, failure to hold the price above the 200-day Simple Moving Average could initiate a deeper decline toward the 793.47 support level.
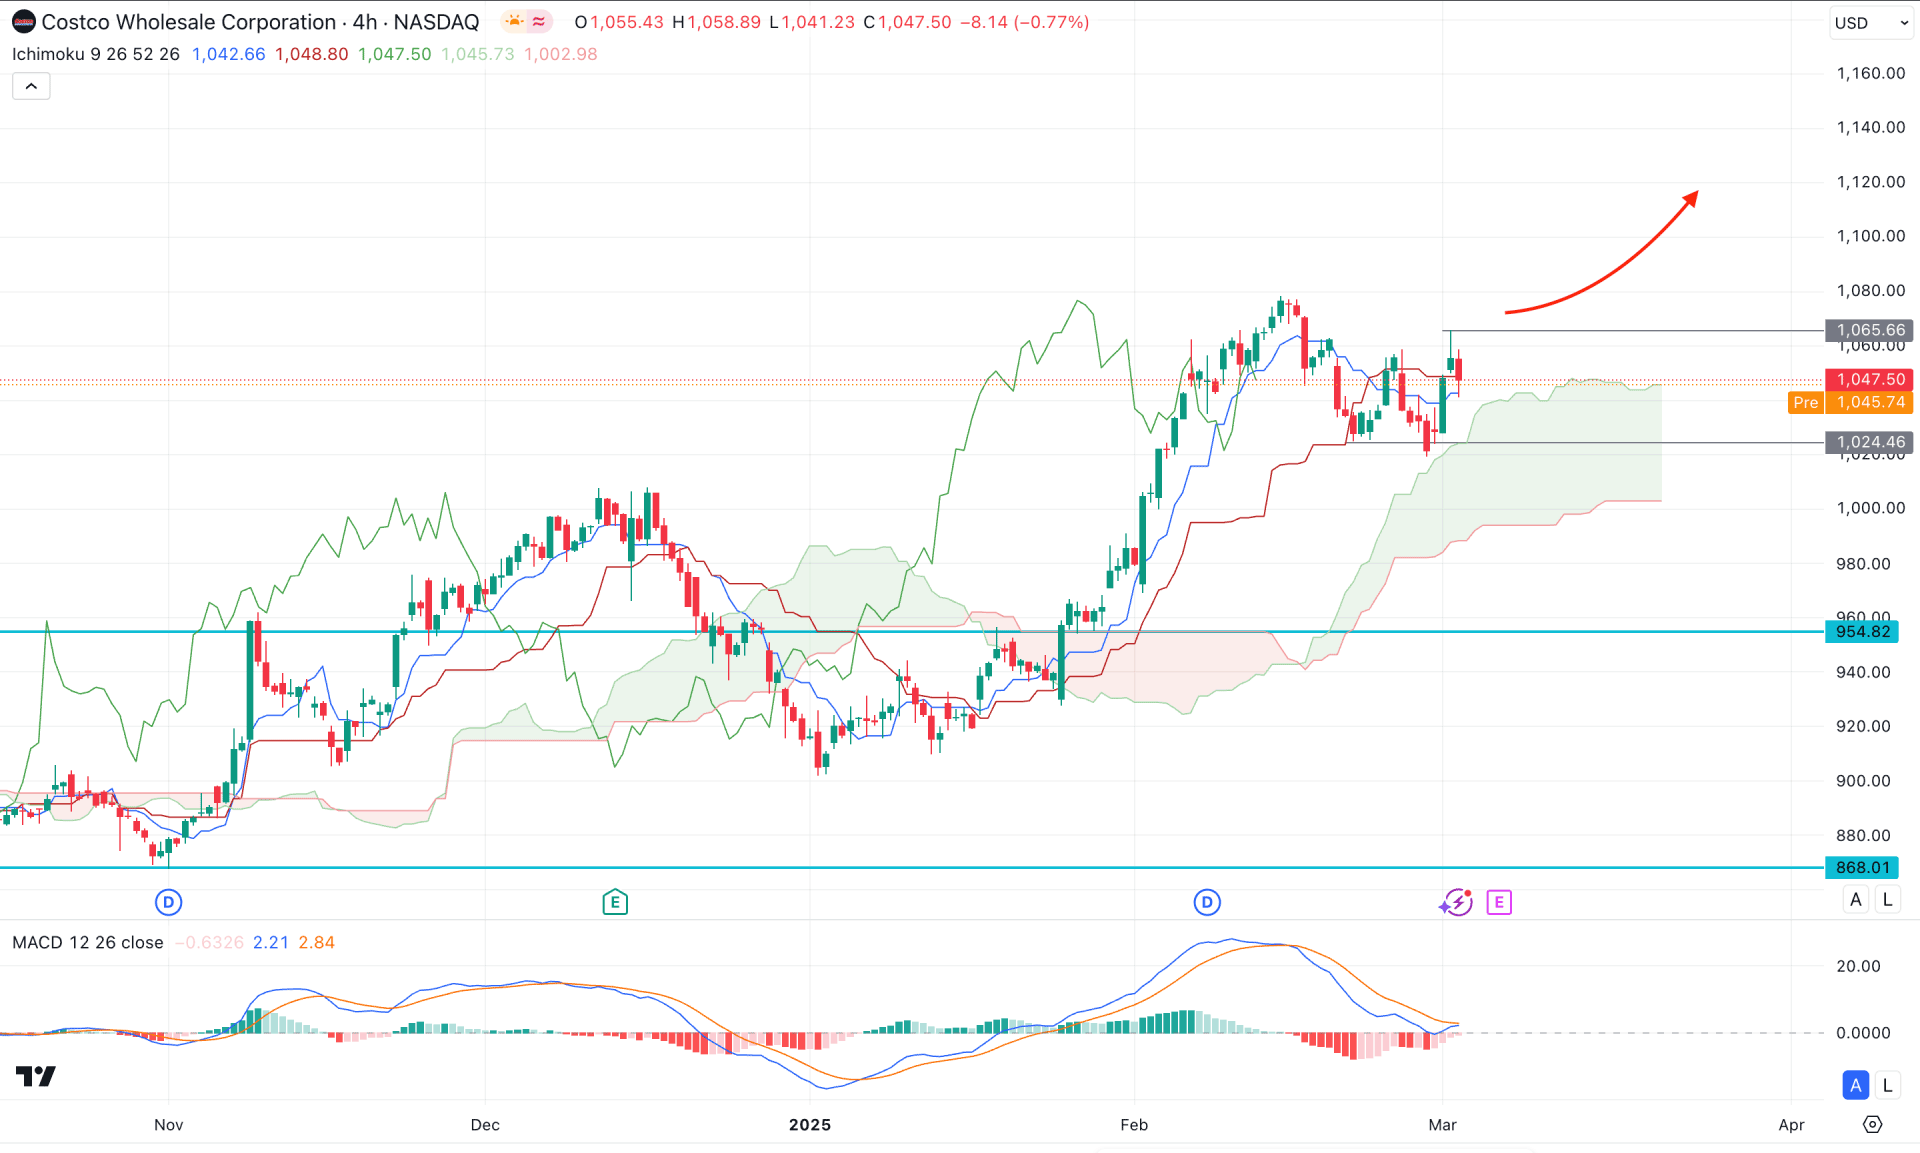
In the four-hour timeframe, Costco stock (COST) is trading above the Ichimoku Cloud area, where strong support is visible from the cloud zone. Moreover, the future cloud looks positive, as both lines are heading upwards. The main aim of this stock is to look for long trades with a valid bullish rejection.
In the indicator window, the MACD histogram has reached the neutral point, losing bullish momentum, while the signal line has yet to form a bullish crossover.
Based on the H4 outlook, the price is facing minor support from the dynamic line. In that case, any bullish candle above the 1055.66 level could initiate an immediate bullish opportunity, targeting the 1150.00 level.
On the other hand, downside pressure below the 1024.46 low could extend the loss toward the 1000.00 psychological level before forming another bullish signal. However, a valid bearish cloud breakout could extend the loss up to the 925.00–900.00 zone.
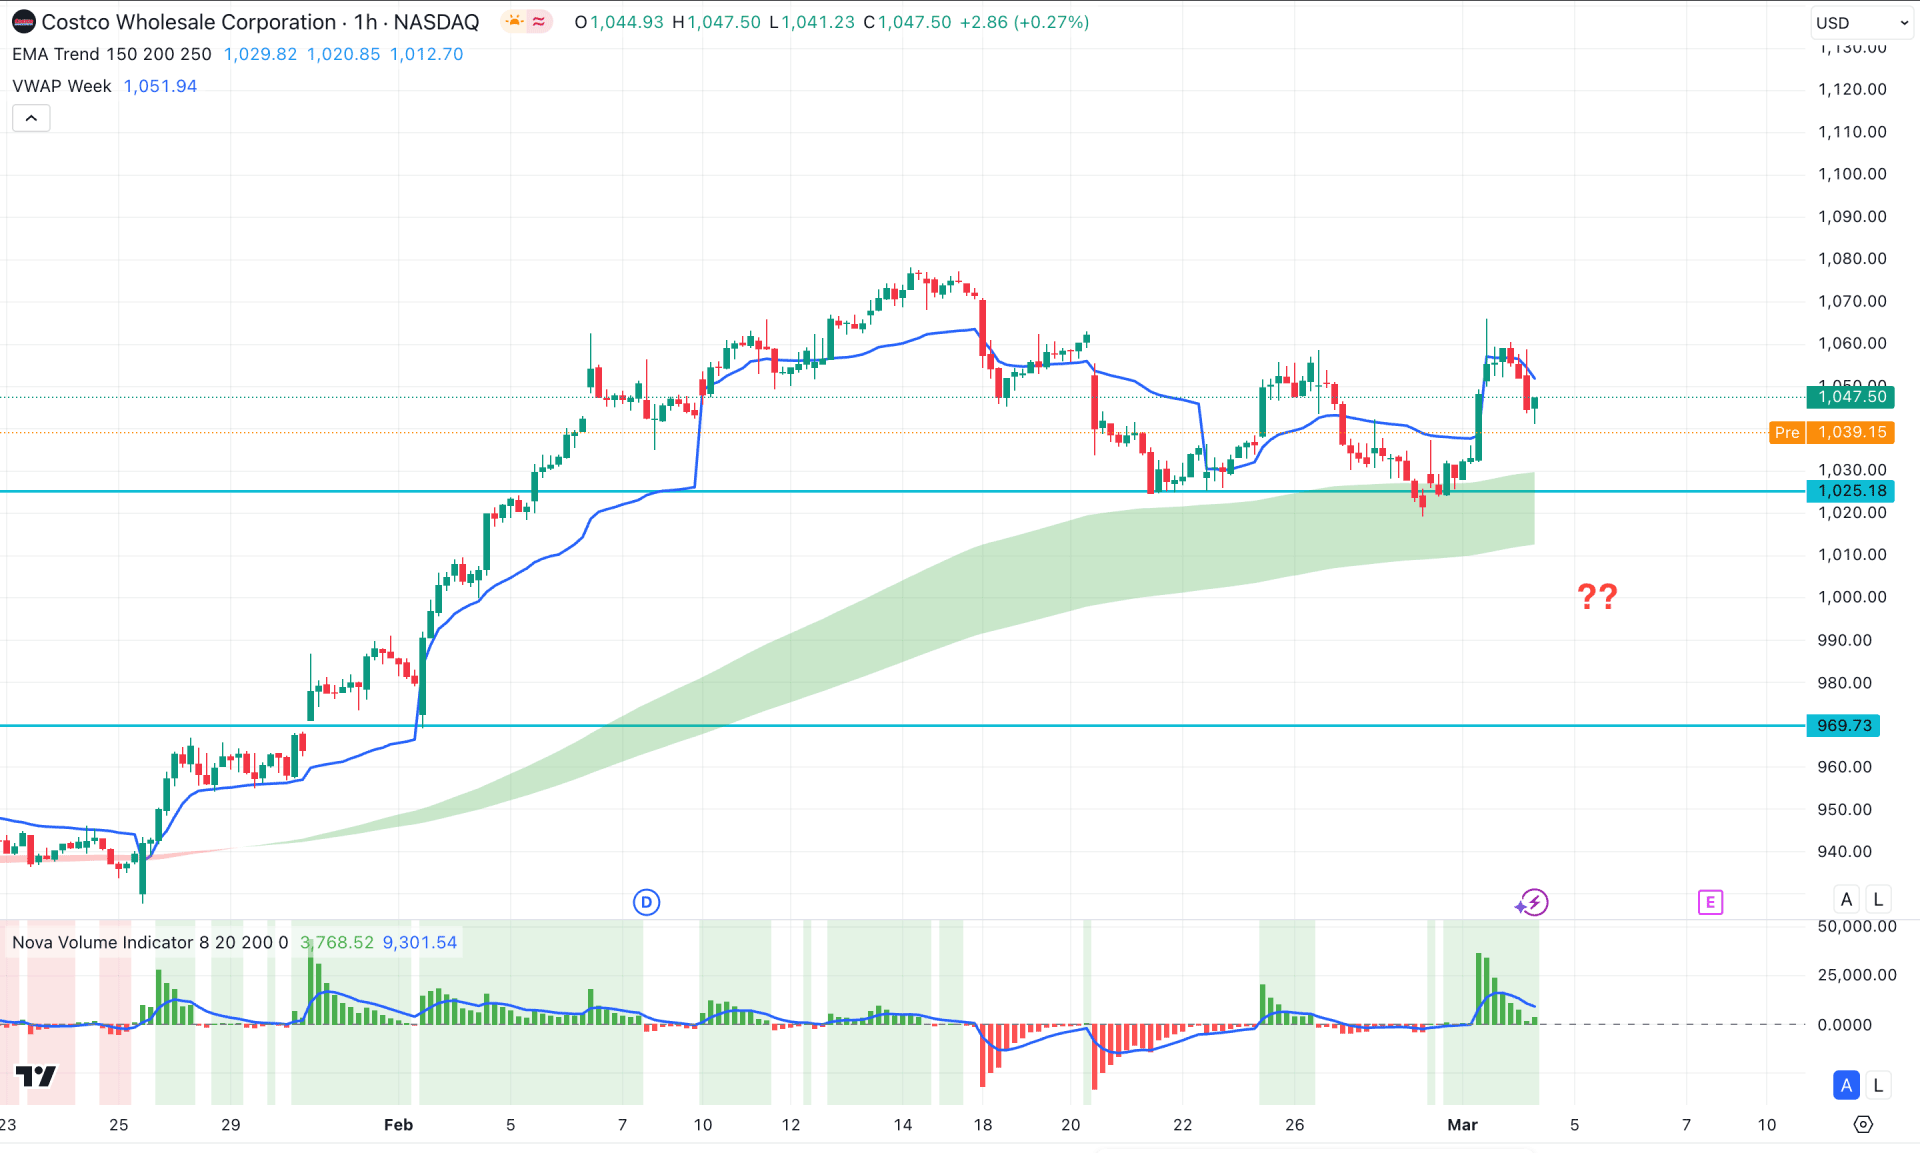
In the hourly timeframe, the price is facing bullish pressure from the moving average wave support, which signals a major bullish trend. Moreover, the weekly VWAP is currently below the current price and is acting as an immediate barrier to sellers.
In the indicator window, the volume histogram shows lower activity after reaching a peak at the 1070.00 level. In this case, a further downside correction is likely, with the 1025.18 level acting as a key support. Any bullish rebound could present a long opportunity, targeting the 1100.00 psychological level.
On the bearish side, extended selling pressure with consolidation below the moving average wave area could push the price toward the 969.73 support level.
Based on the current multi-timeframe analysis, Costco stock is more likely to extend the ongoing bullish trend. Although the price is at a record high, there are no signs of high-volume selling pressure at the top. In this case, investors might consider opening a long position once a daily bottom is formed with a valid bullish reversal candlestick pattern.


