
Published: September 21st, 2022
Costco Wholesale Corporation (NASDAQ: COST) will show its fourth-quarterly earnings report Thursday, and investors are keen to see whether the warehouse club will increase the membership fee.
A huge profit comes from the membership model, and its strong position over discount rivals could keep costs down for consumers during these high inflation days. Moreover, Costco customers get a better price than a typical discount from other shops. Therefore, any sign of good deals, better earnings reports, and less hurt from the higher inflation could be a bullish factor for this stock.
In May, the company met Wall Street Expectations, and the EPS increased by 11% to $3.04 while the Net revenue was up by 16% to $52.6 billion. The current quarter's revenue could come at $70.8 billion or $4.17 a share.
Costco Is a prominent company with a market cap of $221.26 billion. It is located in 830 places in eight countries with nearly 117 million cardholders.
Let’s see the price projection for Costco Wholesale stock from Costco Stock (COST) technical analysis:
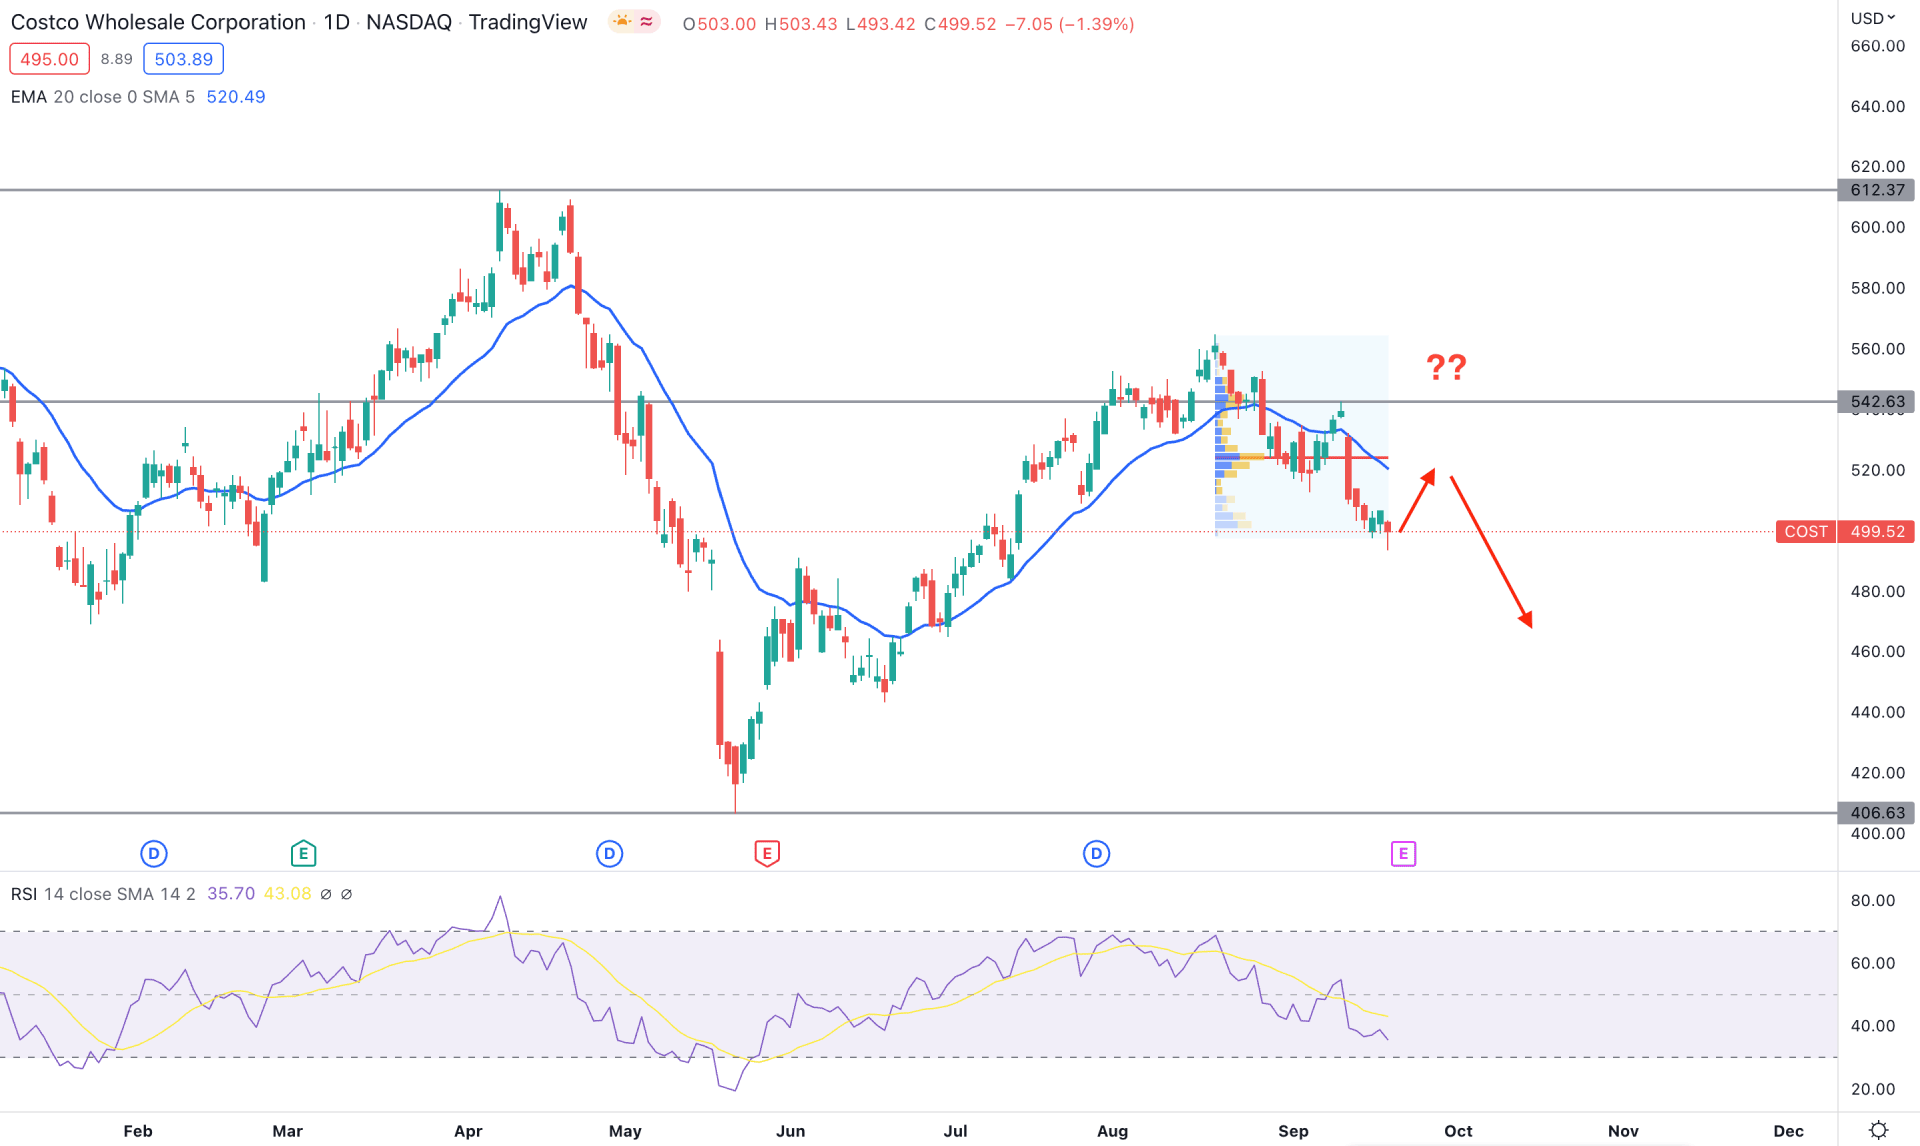
Costco Stock (COST) is trading under bearish pressure as the recent price remained below the dynamic 20 DMA. Moreover, the broader stock market context is still bearish, where any lower-than-expected revenue report could influence bears to extend the momentum.
Based on the daily chart of COST, the buying pressure from 406.63 low to 564.30 high came with a Quasimodo rejection, which is the current trading range. As the current price is at a premium area from the zone, any bearish opportunity will likely provide a higher return. However, investors should monitor how the earnings report is coming, where a better report with bullish price action above the 542.63 level would work as a bullish factor.
Based on the high volume level from August 2022 high to September 2022 low, the most active level was at 524.50, above the current market price. In that case, any corrective buying pressure towards this level might open another opportunity for bears to join the rally.
The indicator window shows a bearish trend, and the current RSI level is below the 50% area, aiming for the 30% oversold zone.
Based on the daily chart, the broader outlook is bearish, and any selling pressure could lower the price to the 406.63 support level. On the other hand, a bullish recovery with a daily close above the 542.63 level should come with a better earnings report that can increase the price towards the 620.00 Fibonacci Extension level.
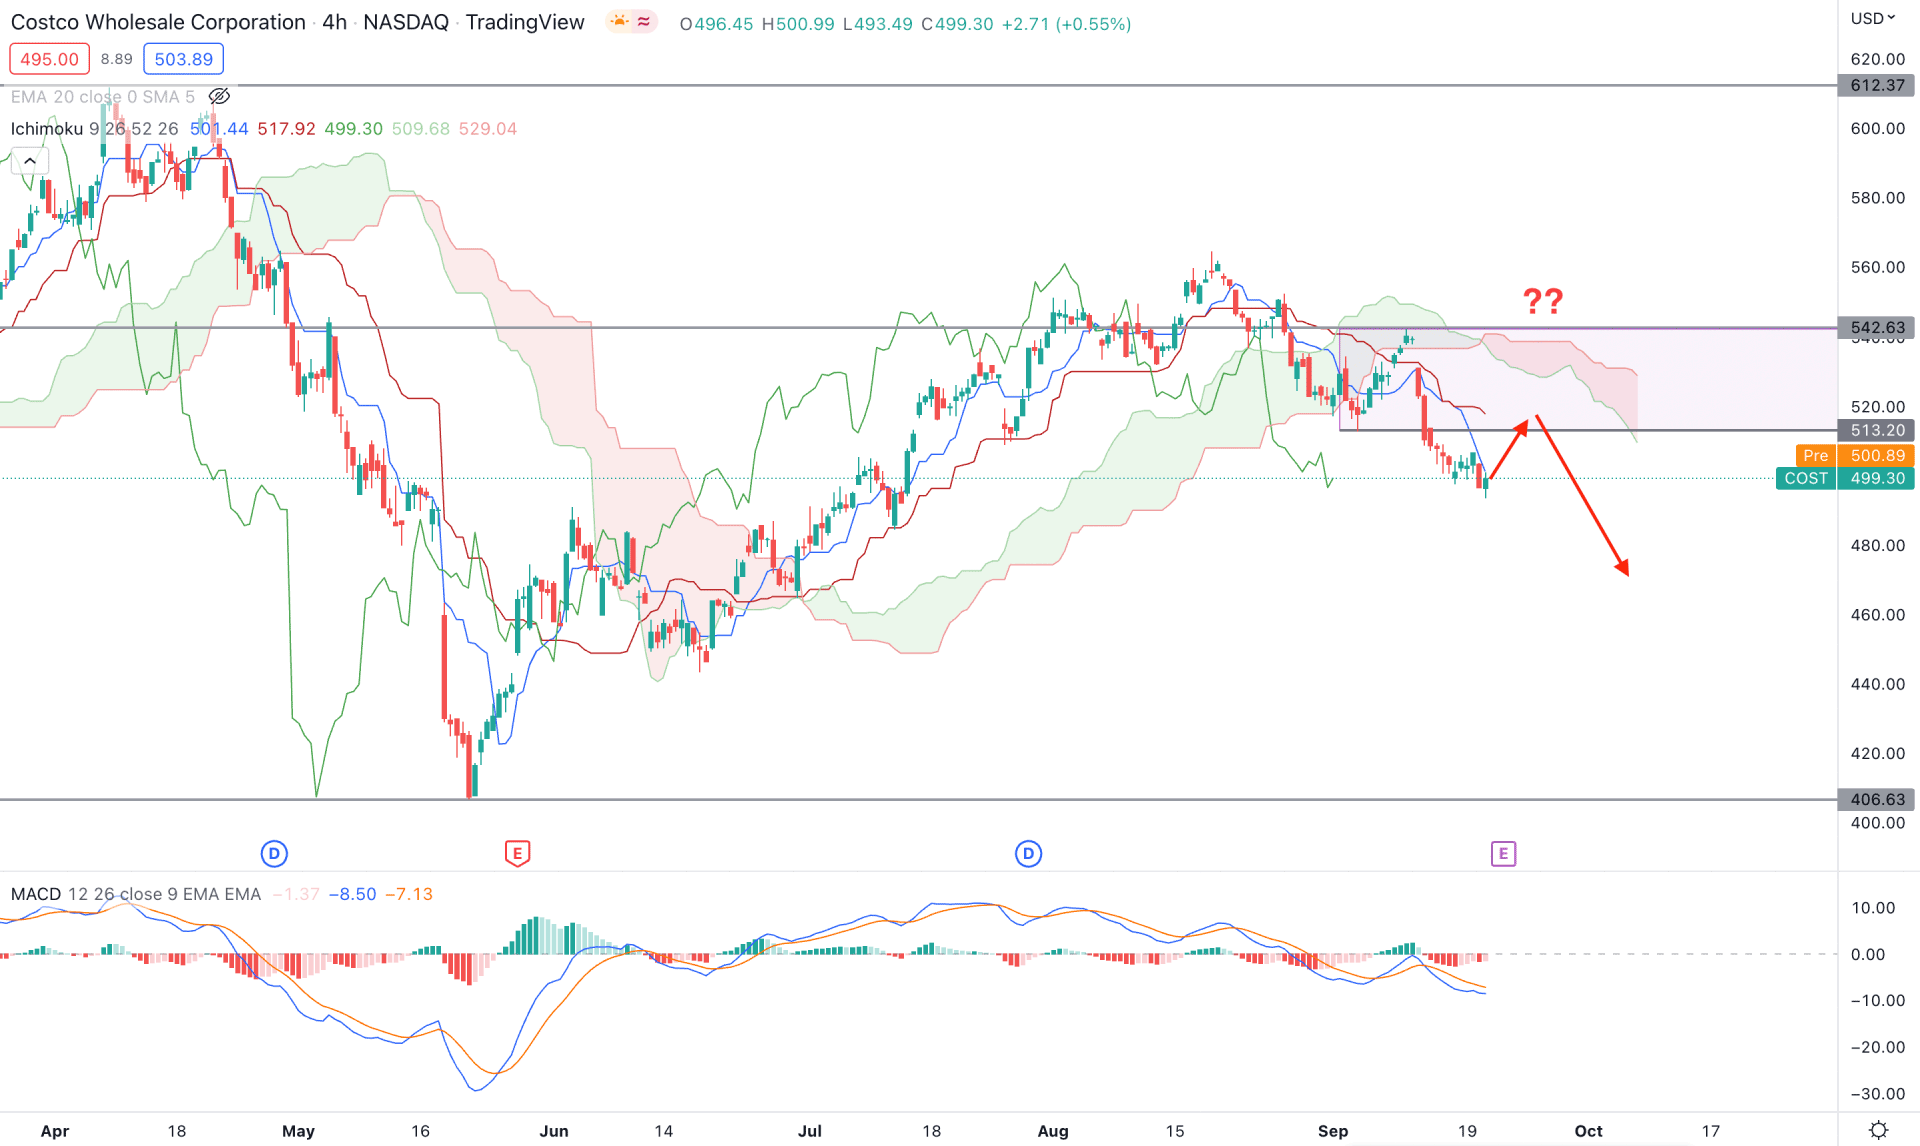
The Costco Stock H4 chart shows that the current price has traded below the Ichimoku Cloud since 2 September 2022. After the bearish breakout, the price showed a bullish correction and tested the cloud resistance before making another swing low. Moreover, the future cloud is solid for sellers where the thickness of Senkou Span A and B has become wider.
In the indicator window, the MACD histogram is still bearish, moving to the neutral zone while MACD lines are moving down. Moreover, Tenkan Sen and Kijun Sen are above the current price, aiming for lower as an immediate resistance level.
Based on the H4 structure of Costco Stock (COST), the last bullish pressure before making the new swing low would be the area to look at. If the price reaches the 542.00- 513.00 zone and forms a bearish rejection, it may resume the trend towards the 406.63 level.
On the other hand, the bullish breakout above the 542.63 level with an H4 close could alter the current market momentum and increase the price towards the 612.37 level.
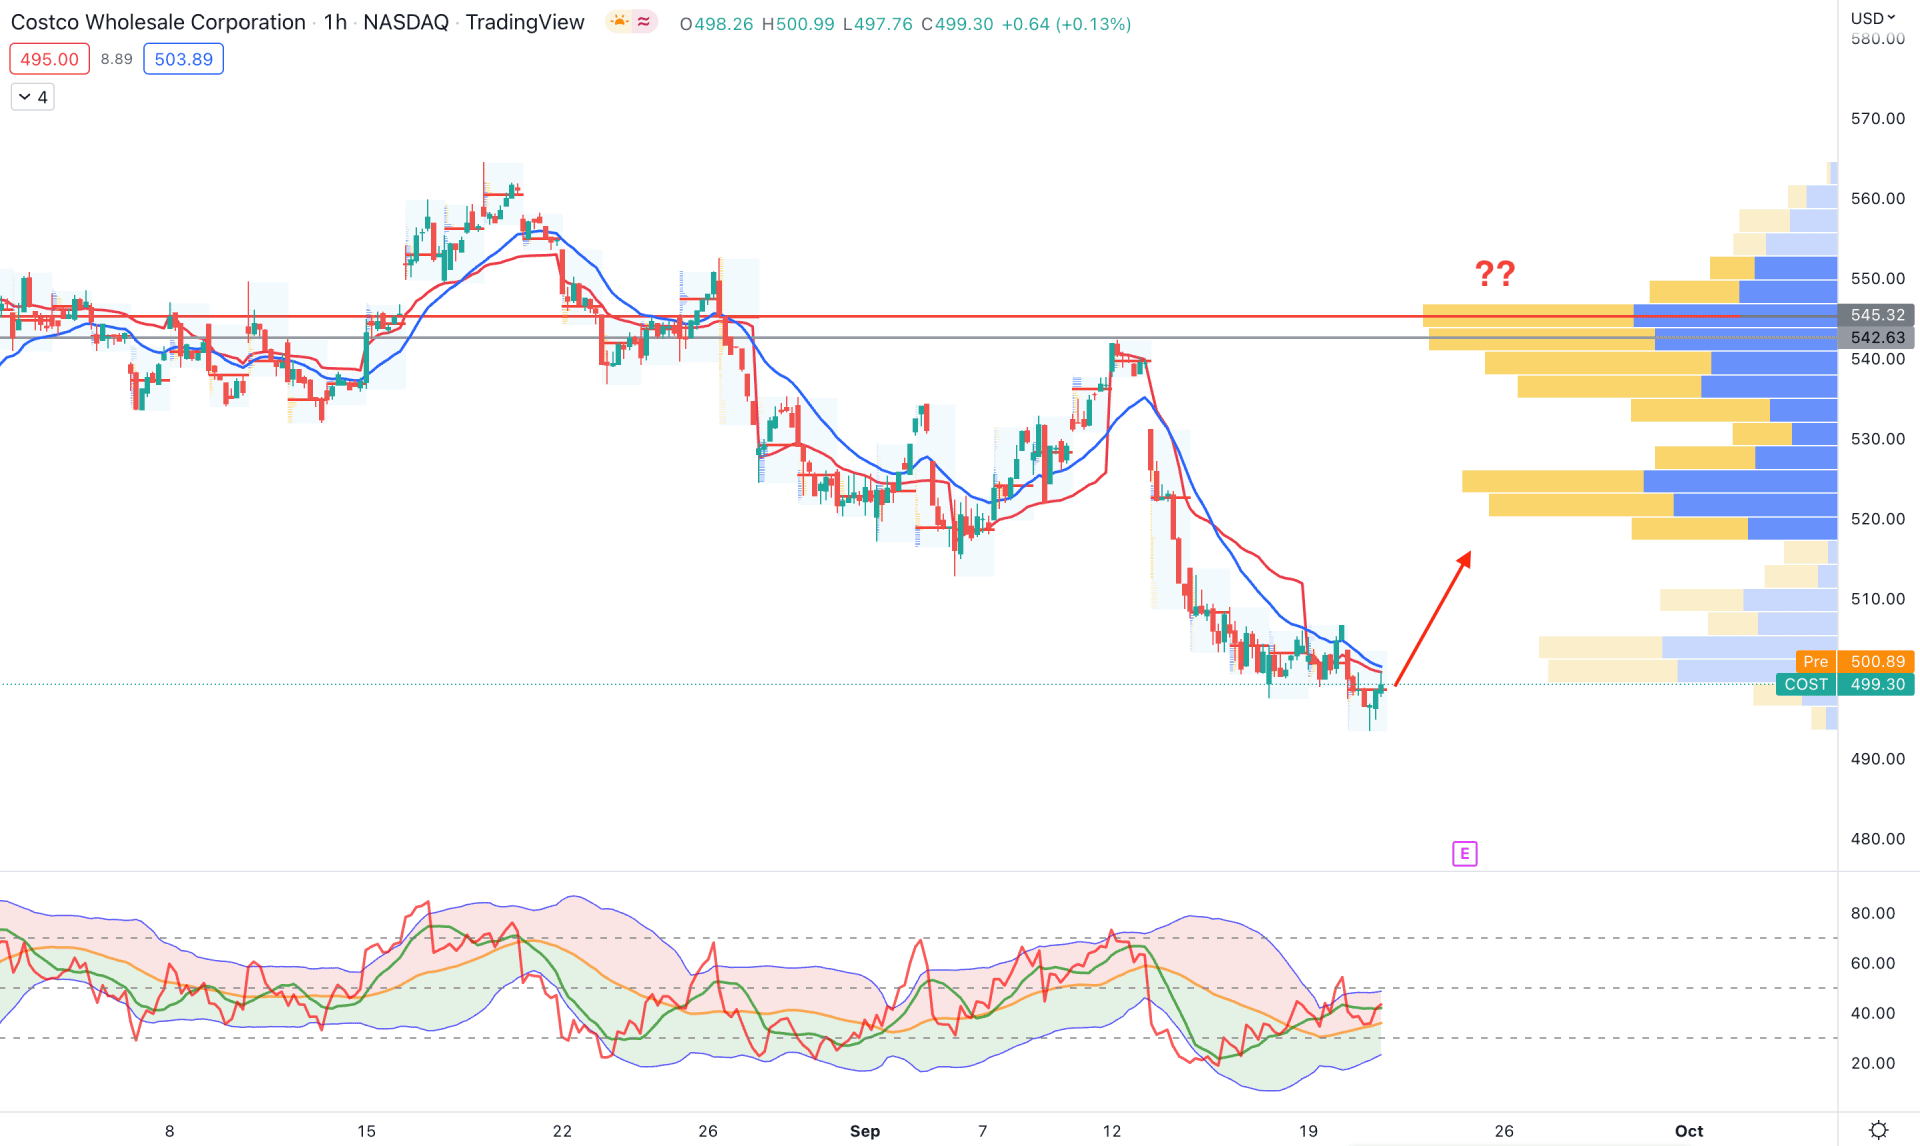
In the Costco Stock Intraday H1 chart, the selling pressure is active where the current price already showed an 8% downside move from the high volume 545.32 level. Moreover, the dynamic 20 EMA and weekly VWAP are still above the price but have become corrective.
The intraday high volume level made consecutive lower lows while the latest level was below the price. The indicator window shows a pending bullish correction as the current TDI level moved above the 40% area after testing the oversold band.
Although the broader trend is bearish, a minor bullish correction is pending for this instrument in the H1 timeframe. However, bears may regain momentum at any time until bulls recover the 545.32 level with a strong volume.
Based on the current Costco Stock (COST) price prediction, the daily price is at the premium level, while a minor bullish correction is pending in the intraday chart. However, investors should monitor how the price trades at the near-term resistance level, where a bullish breakout with a better-than-expected earnings report could provide a long opportunity.


