
Published: March 16th, 2023
After the “replicated security (RS)” update, Cosmos Hub's Replicated Security feature can transfer a percentage of token inflation, revenue streams, and up to 25% of consumer chain fees to ATOM holders. The introduction of Inter-Blockchain Communication Standards (ICS) permits consumer chains to concentrate on network expansion. Cosmos Hub validators guarantee security against 51% assaults and double-spending, increasing returns for ATOM stakers.
After adjusting for inflation, the return on investment for ATOM is 6.82%, with yearly returns of 24.37%. Moreover, the deployment of RS will increase annual dividends for ATOM holders, with an increase in purchasing and staking activity in the ecosystem.
Neutron, a platform for smart contracts, will likely be the first retailer to implement the new ICS functionality. Using RS will eliminate the need for constant inflation of the Neutron supply. Instead, Neutron will employ a fixed supply, on-chain activity-indexed release timetable, and ongoing buy-and-burn pressure from its three revenue streams.
However, the ATOM/USDT price showed downside pressure during the update, but the broader outlook remained bullish. Let’s see the upcoming price direction of Cosmos (ATOM) from the ATOM/USDT technical analysis:
In the weekly timeframe, the overall outlook of ATOM/USDT is corrective as the price is trading sideways within a symmetrical triangle formation. Moreover, the corrective price action is backed by a strong downside pressure started from the 33.09 key supply area.
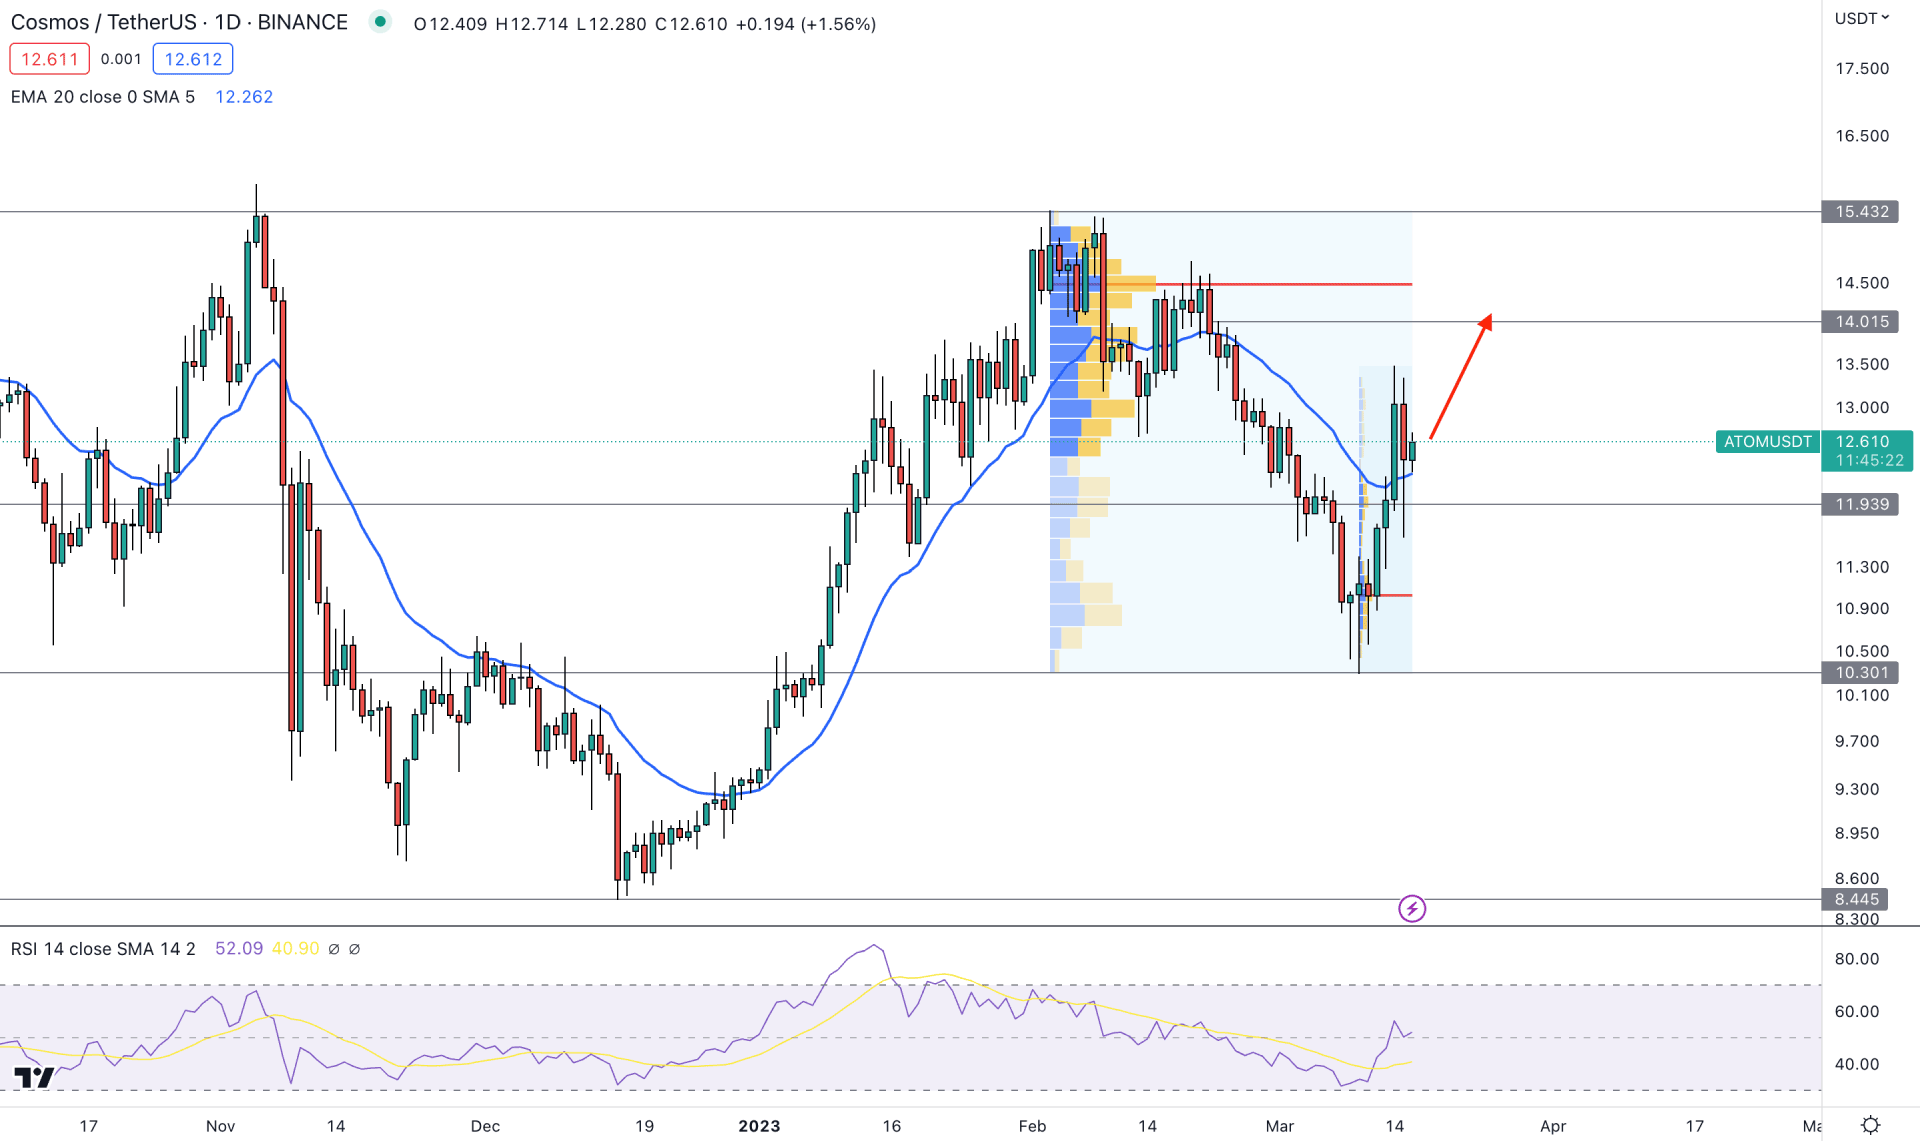
However, the recent buying pressure in the daily timeframe is solid, where a minor upside correction towards the triangle resistance offers a 17% price surge. Moreover, the latest bullish leg from the 10.30 support level was counter-impulsive, which can extend after a considerable correction. After making a top at 13.48 high, the current price is trading at the dynamic 20 EMA support level.
Institutional traders' interes shows an indecisive momentum for this instrument. The latest high volume level from February to March is at 14.48 level, which is above the current price. Moreover, another high volume level in the March swing is below the current price. As the gap between the first high volume is higher, a mean reversion is pending with a bullish price action.
The price is also trading above the 50% Fibonacci Retracement level from the February high to the March low, backed by massive buying pressure.
The indicator window shows the same story, where the current RSI level is above the 50% neutral level, aiming for the 70.00 overbought level.
Based on the current price outlook, the buying opportunity is valid as long as the price trades above the dynamic 20-day Exponential Moving Average support level. In that case, the main aim is to test the 14.01 and 15.43 resistance levels in the coming days.
On the bearish side, a downside pressure with a stable price below the 11.60 swing low could lower the price towards the 10.30 support level.
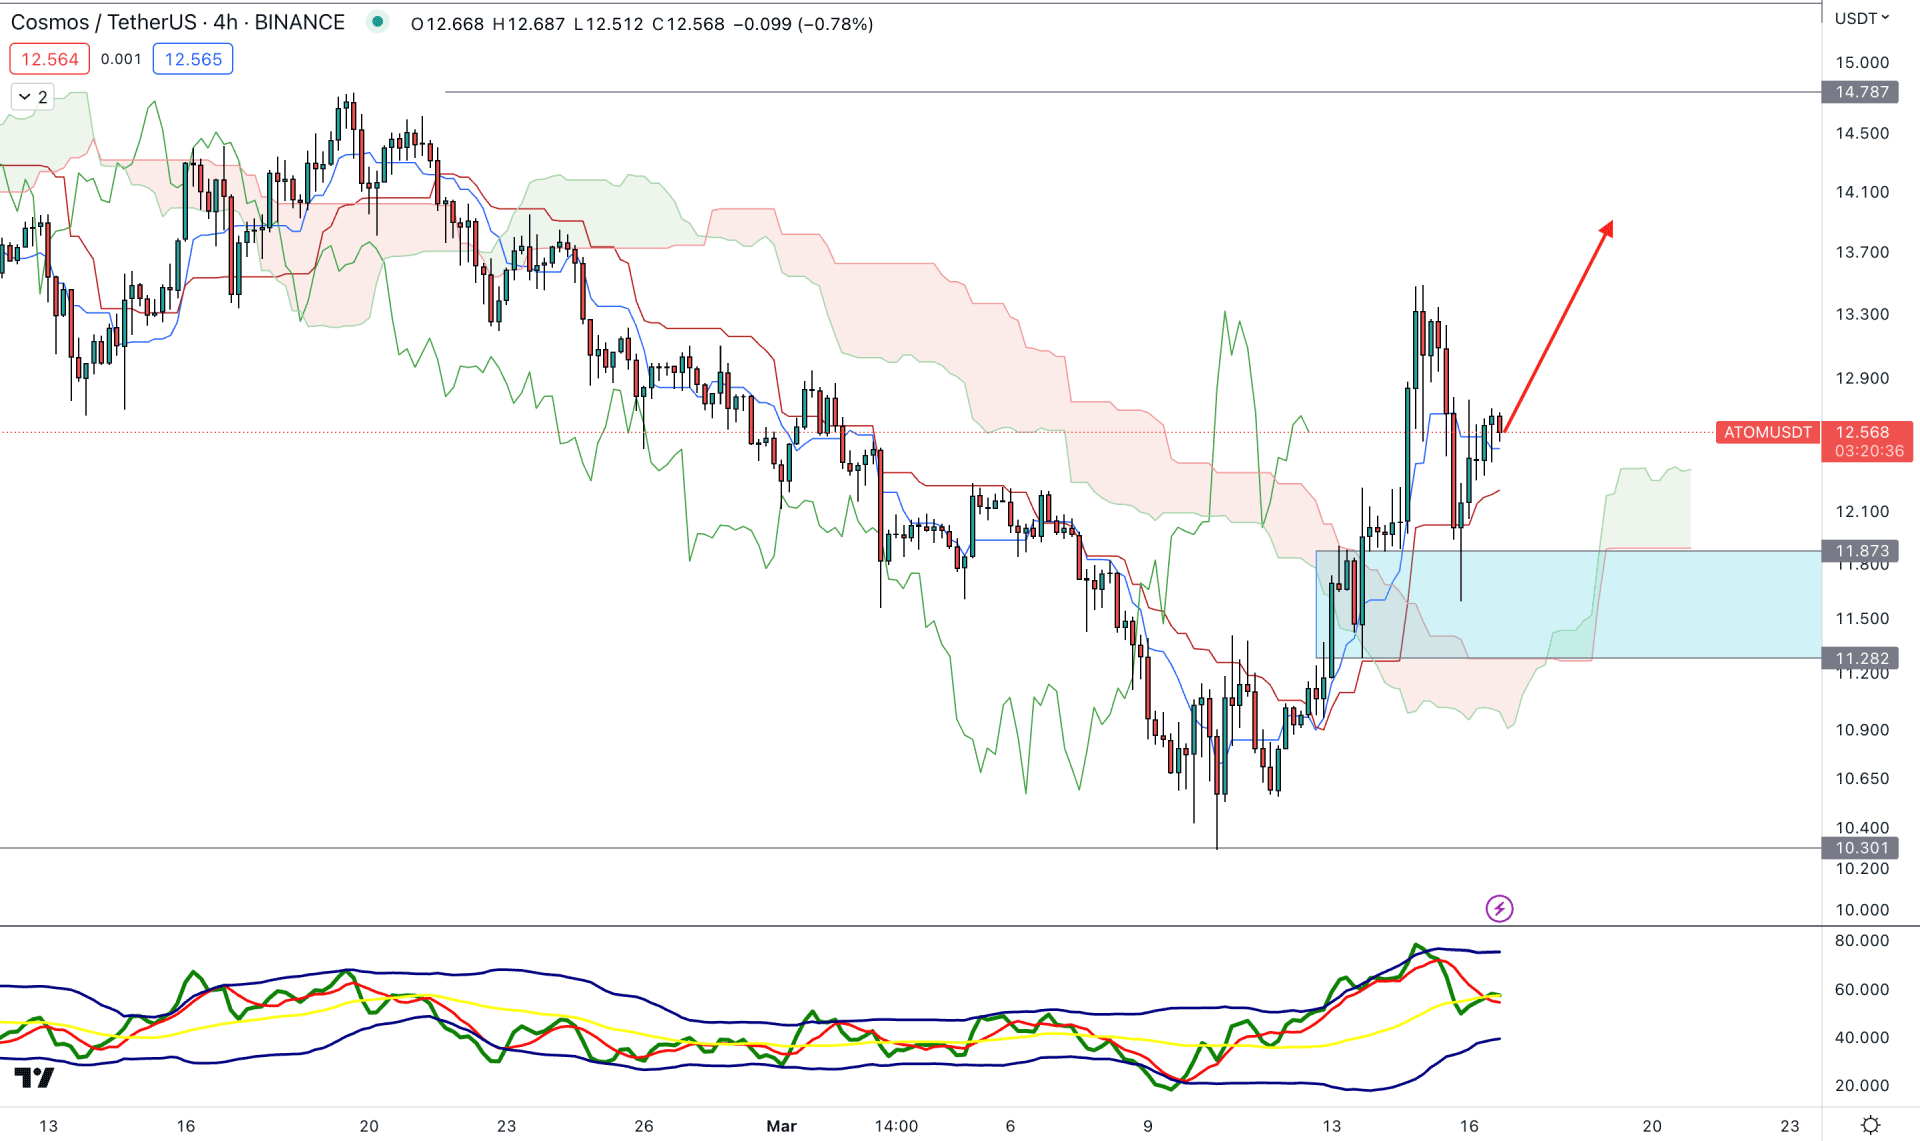
In the H4 chart, the current price outlook is bullish as the price has been trading above the dynamic Kumo Cloud for a considerable time. Moreover, the future cloud is bullish, where the Senkou Span A is above B with a stable gap.
The indicator window also shows buying pressure as the current TDI level is above the 50.00 area.
Based on the H4 chart, immediate buying pressure may come as bulls recovered and made an hourly close above the dynamic Tenkan Sen support. In that case, the primary idea is to look for long opportunities, where the ultimate target is to test the 14.78 resistance level.
The alternative trading approach is to look for short opportunities if an H4 candle comes below the 11.20 level.
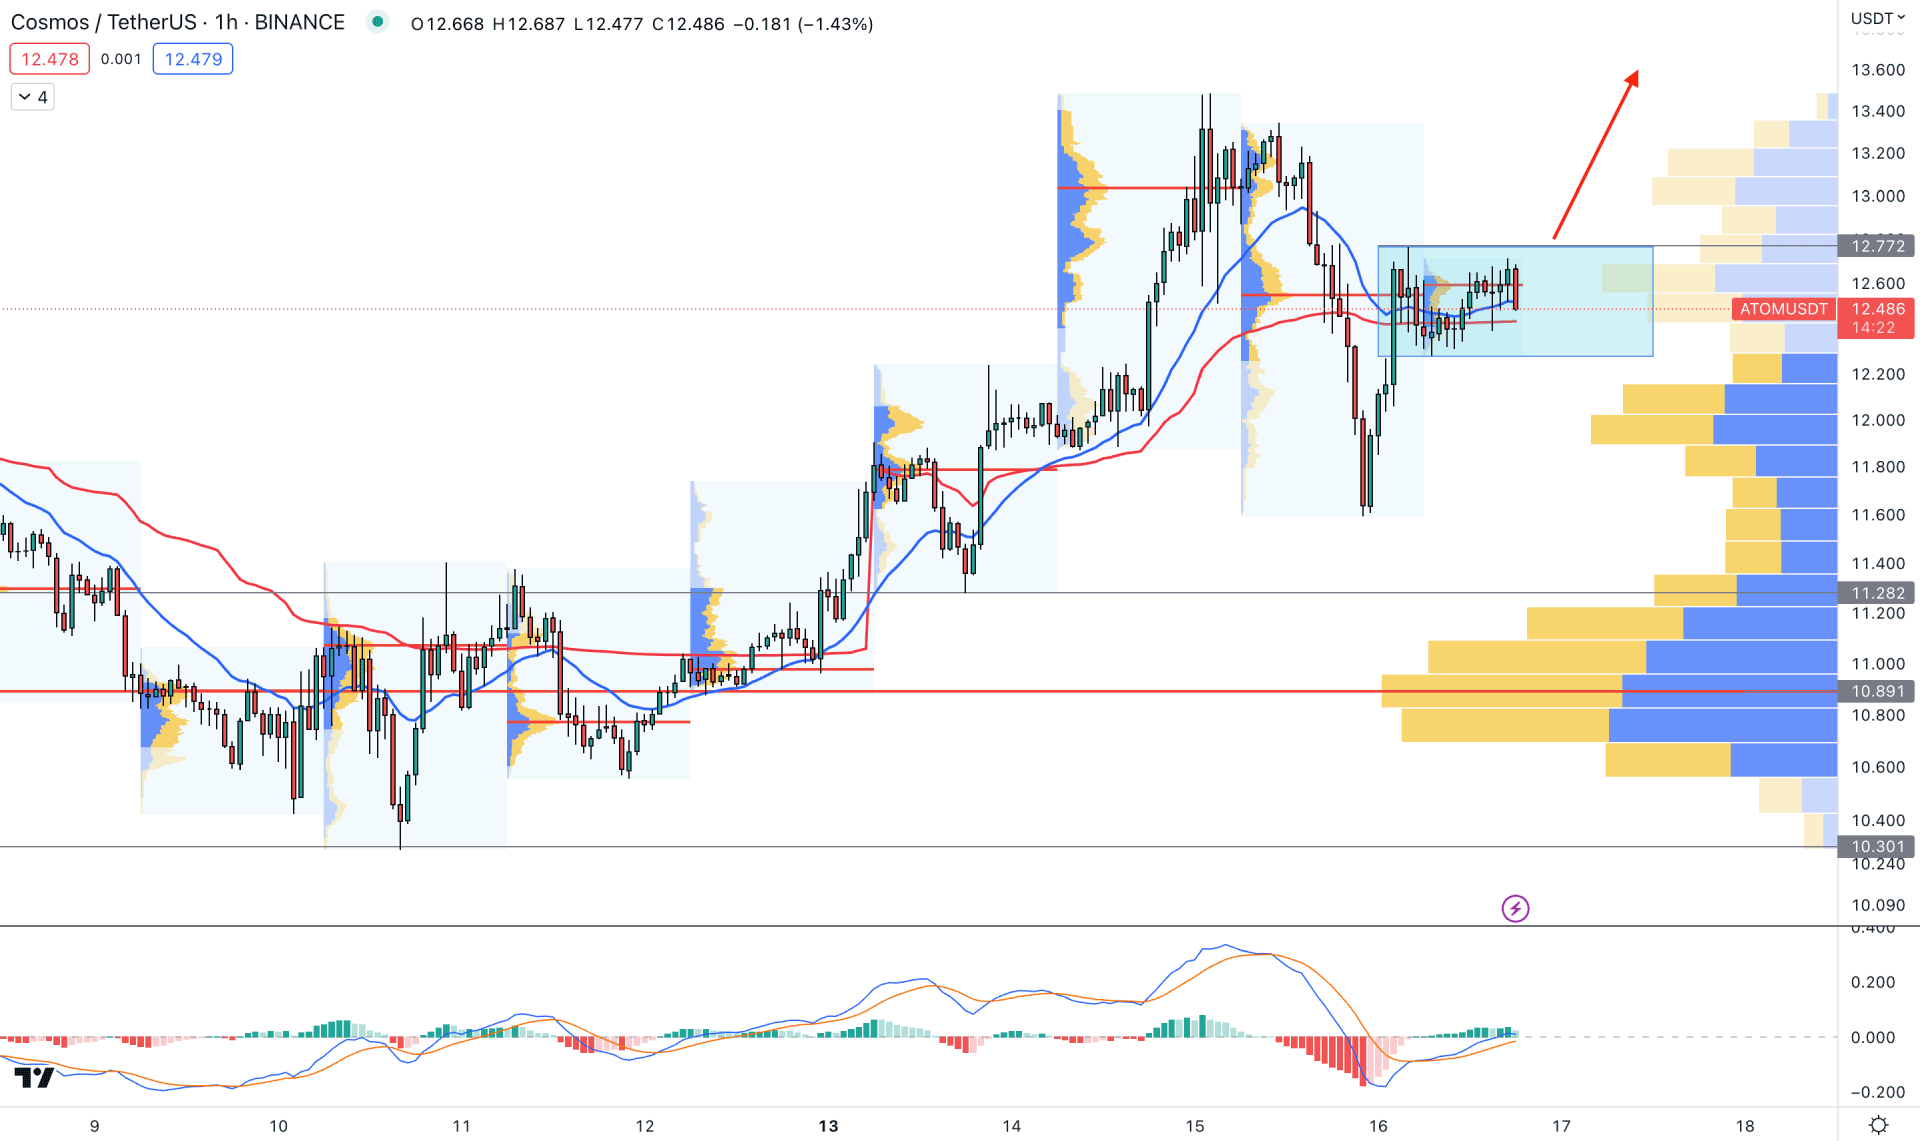
In the intraday chart, the current market outlook is corrective as the H1 price is trading sideways within a rectangle pattern. However, a stable market is seen as the visible range high volume level is below the current price.
In the main price chart, the dynamic 20 EMA and weekly VWAP are providing immediate support to the market. In that case, any buying pressure from the near-term dynamic areas could be the primary reason for finding long opportunities.
In the indicator window, the current MACD Histogram is still above the neutral line, while MACD EMA’s are pushing higher with more room upside.
Based on this outlook, a bullish rectangle pattern breakout with an H1 candle close above the resistance could be a buying opportunity in this pair. However, a bearish break could lower the price towards the 11.28 or 10.89 resistances from where another buying pressure may come.
Based on the current market analysis for ATOM/USDT, the broader outlook is bullish in the daily chart. In that case, any intraday bullish price action from near-term support levels could be a decent buying opportunity. However, investors should monitor the weekly price for an update of the symmetrical triangle formation for a better outlook.


