
Published: August 25th, 2022
Investors got a buying momentum in Cosmos (ATOM) as soon as the global investment manager, VanEck, published an optimistic analysis, praising its cross-chain bridging capacity. Many blockchains operate individually, whereas the Cosmos would be the only source to overcome these interoperability issues.
According to VanEck, more than 5,000 blockchains will be built within 2030 because of Cosmos’s technology. As a result, the native token of the Network, ATOM, would be in the premium position to grab a substantial share in the public blockchain market.
Moreover, some speculations on social media say that some projects from the hard-hitting Terra ecosystem will move to Cosmos. Some smart contract cryptos are attractive to the terra application, which was built using the Cosmos technology.
These positive fundamentals pushed investors to have a 133% price surge from the June 2022 low that may extend more. Let’s see the future price direction of the Cosmos from ATOM/USDT Technical analysis:
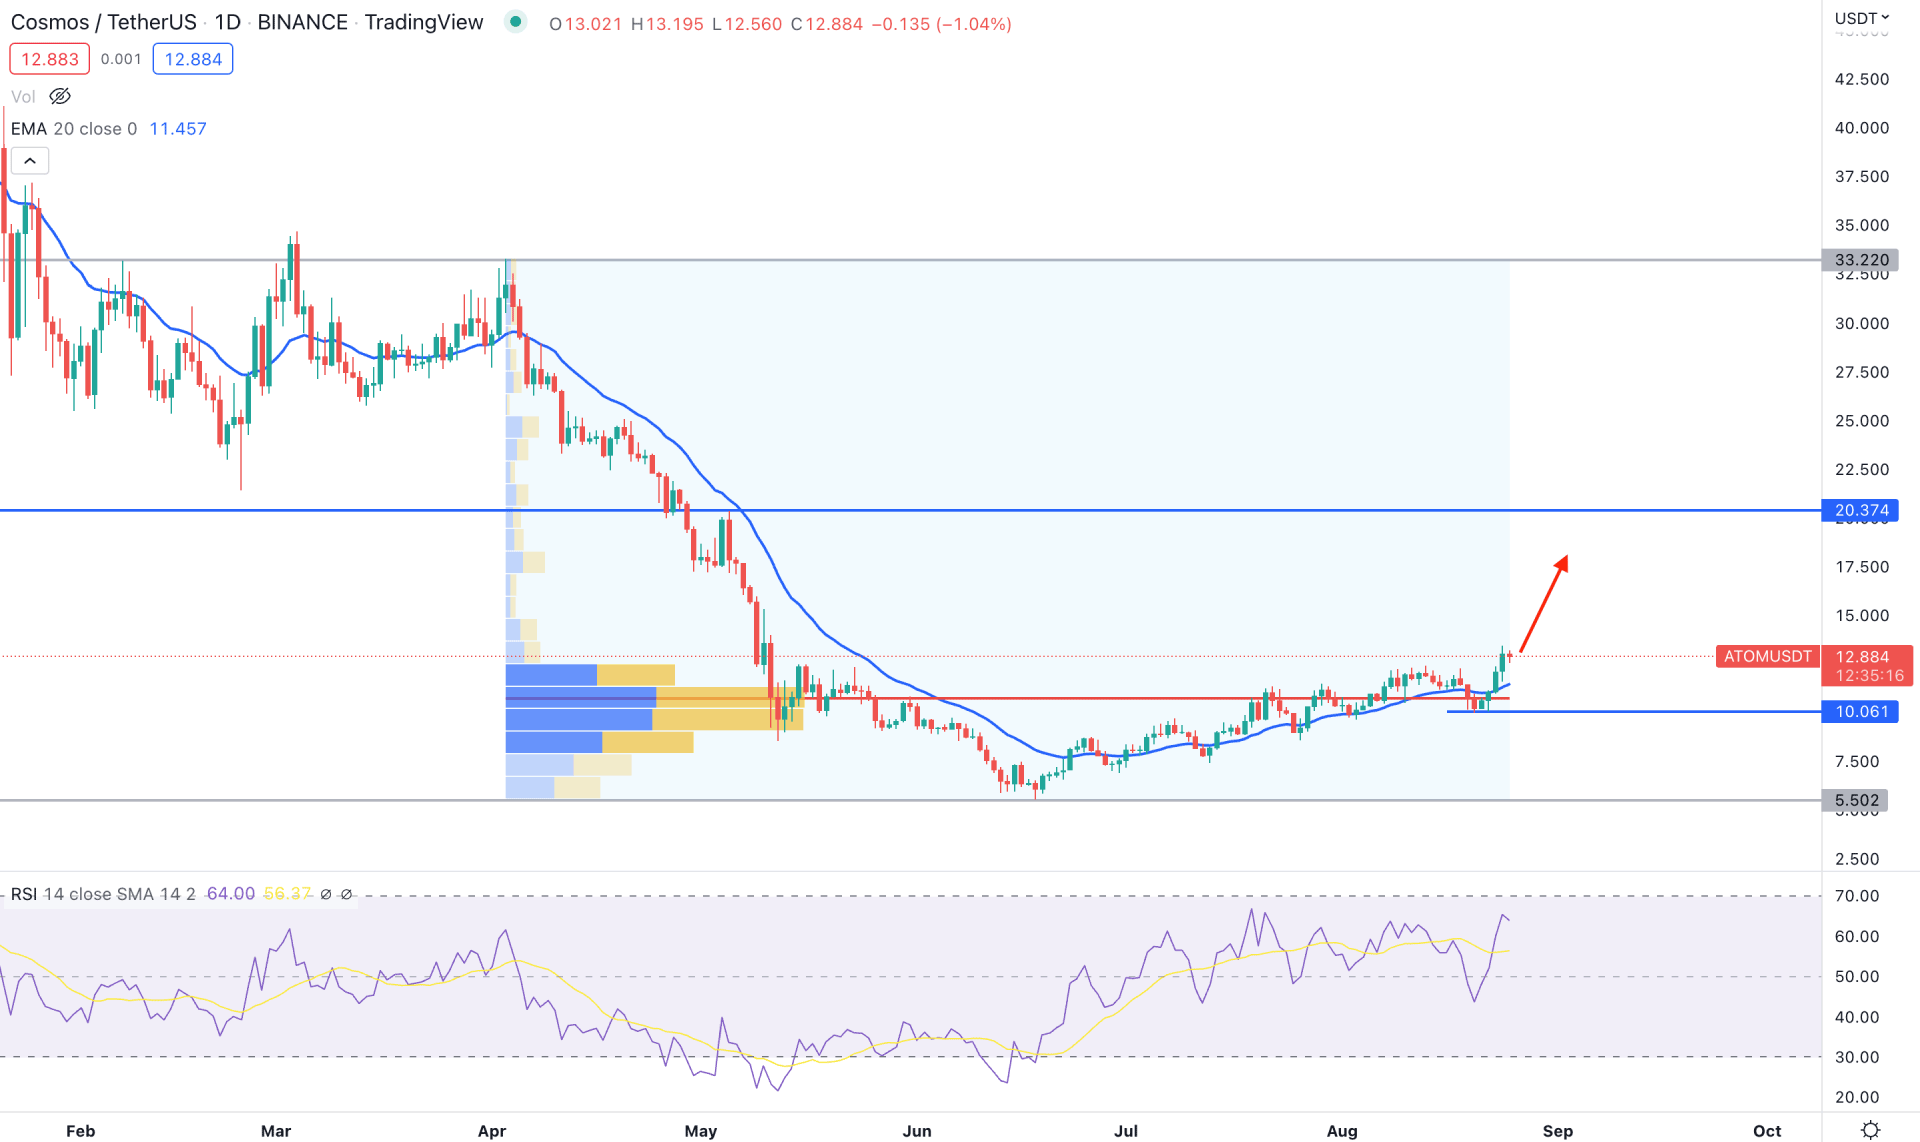
In the daily chart of ATOM, the selling pressure from the 32.22 level came with an impulsive pressure, losing 82% of the coin’s value. However, the price became corrective after reaching the 5.50 bottom, where a substantial consolidation appeared. The correction after a strong bearish momentum was supposed to provide another bearish opportunity, but the selling pressure was eliminated by the new swing high above the 12.35 level.
From 33.22 swing high to 5.50 swing low, the highest trading volume was seen at 10.83 level, which is below the current price. Moreover, the recent buying pressure from the 10.06 swing low came with a bullish impulsive pressure, backed by a strong volume at the 10.83 level. In that case, as the current price is above the 10.80 to 10.06 zone, the bullish momentum for this pair might extend in the coming days.
The daily relative strength index shows buying pressure, which came from a rebound at the 50% level. Moreover, the RSI is yet to reach the overbought 70 level, indicating more room for buyers.
Based on the daily price action, this pair's buying pressure may extend as it trades above the dynamic 20-day Exponential Moving Average. In that case, an upside pressure toward the 20.32 resistance level may come with a 60% gain for bulls. On the other hand, a bearish pressure with a daily candle below the 10.00 level might extend the loss towards the 5.50 level.
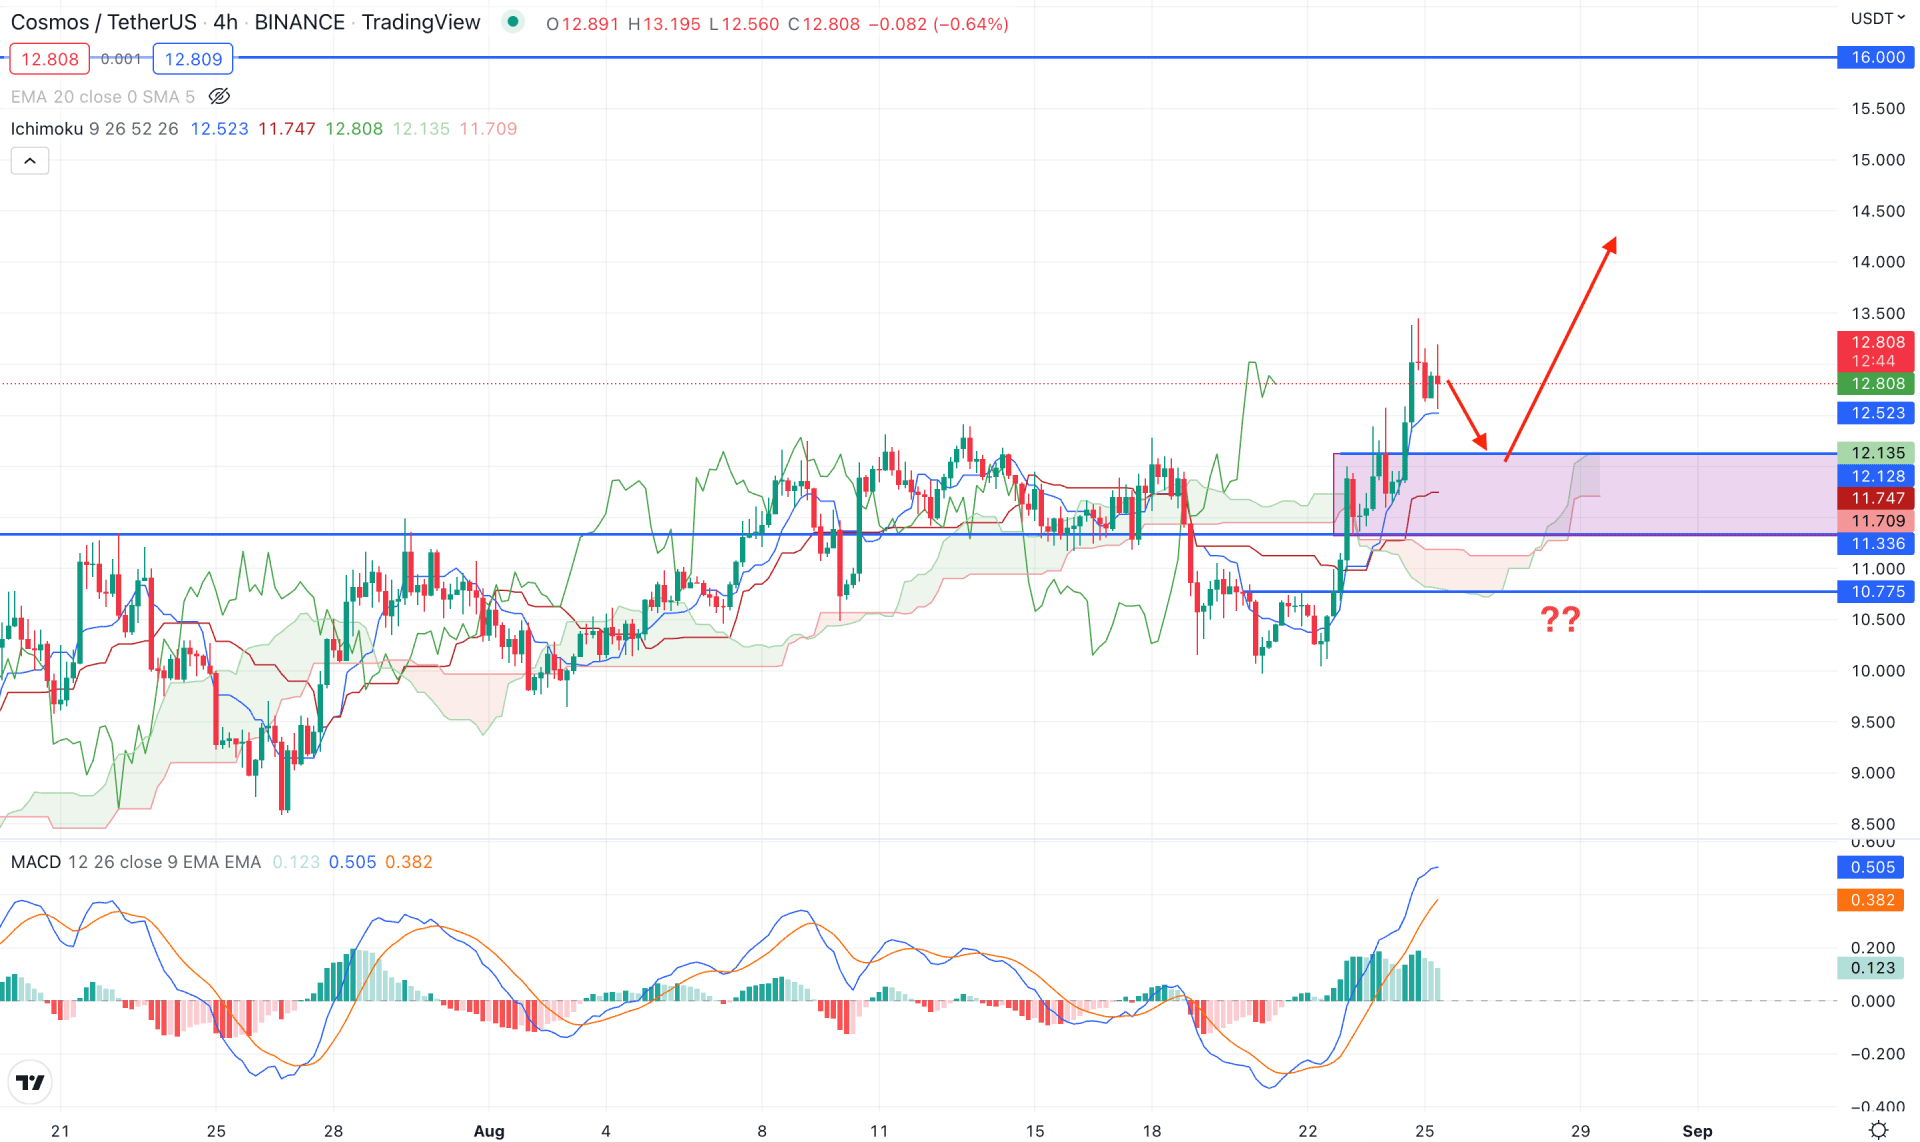
In the Ichimoku Cloud price structure, ATOM/USDT showed a bearish false break below the Kumo Cloud, indicating a sell-side liquidity grab. Later on, the price increased above the Cloud resistance with a strong buying pressure, indicating that bulls are strong in the market with a possibility of further upside pressures.
In the Kumo Cloud ingredients, the Future Cloud is bullish as the Senkou Span A is above the B and moving up. Moreover, the Lagging Span is aimed higher, while dynamic Tenkan Sen is below the current price.
In the indicator window, the MACD Histogram is bullish where the current momentum is decreasing. The MACD EMA’s reached the overbought zone, where a bearish correction is pending. On the other hand, the dynamic Tenkan Sen and Kijun Sen are below the price, which may work as immediate support levels.
Based on the H4 ATOM/USDT price prediction, any bearish correction and bullish rejection from 12.12 to 11.30 would be a decent bullish opportunity in this pair towards the target of the 16.00 key resistance level. On the other hand, the alternative approach is to find the price below 10.77 cloud support to aim towards the 9.00 level.
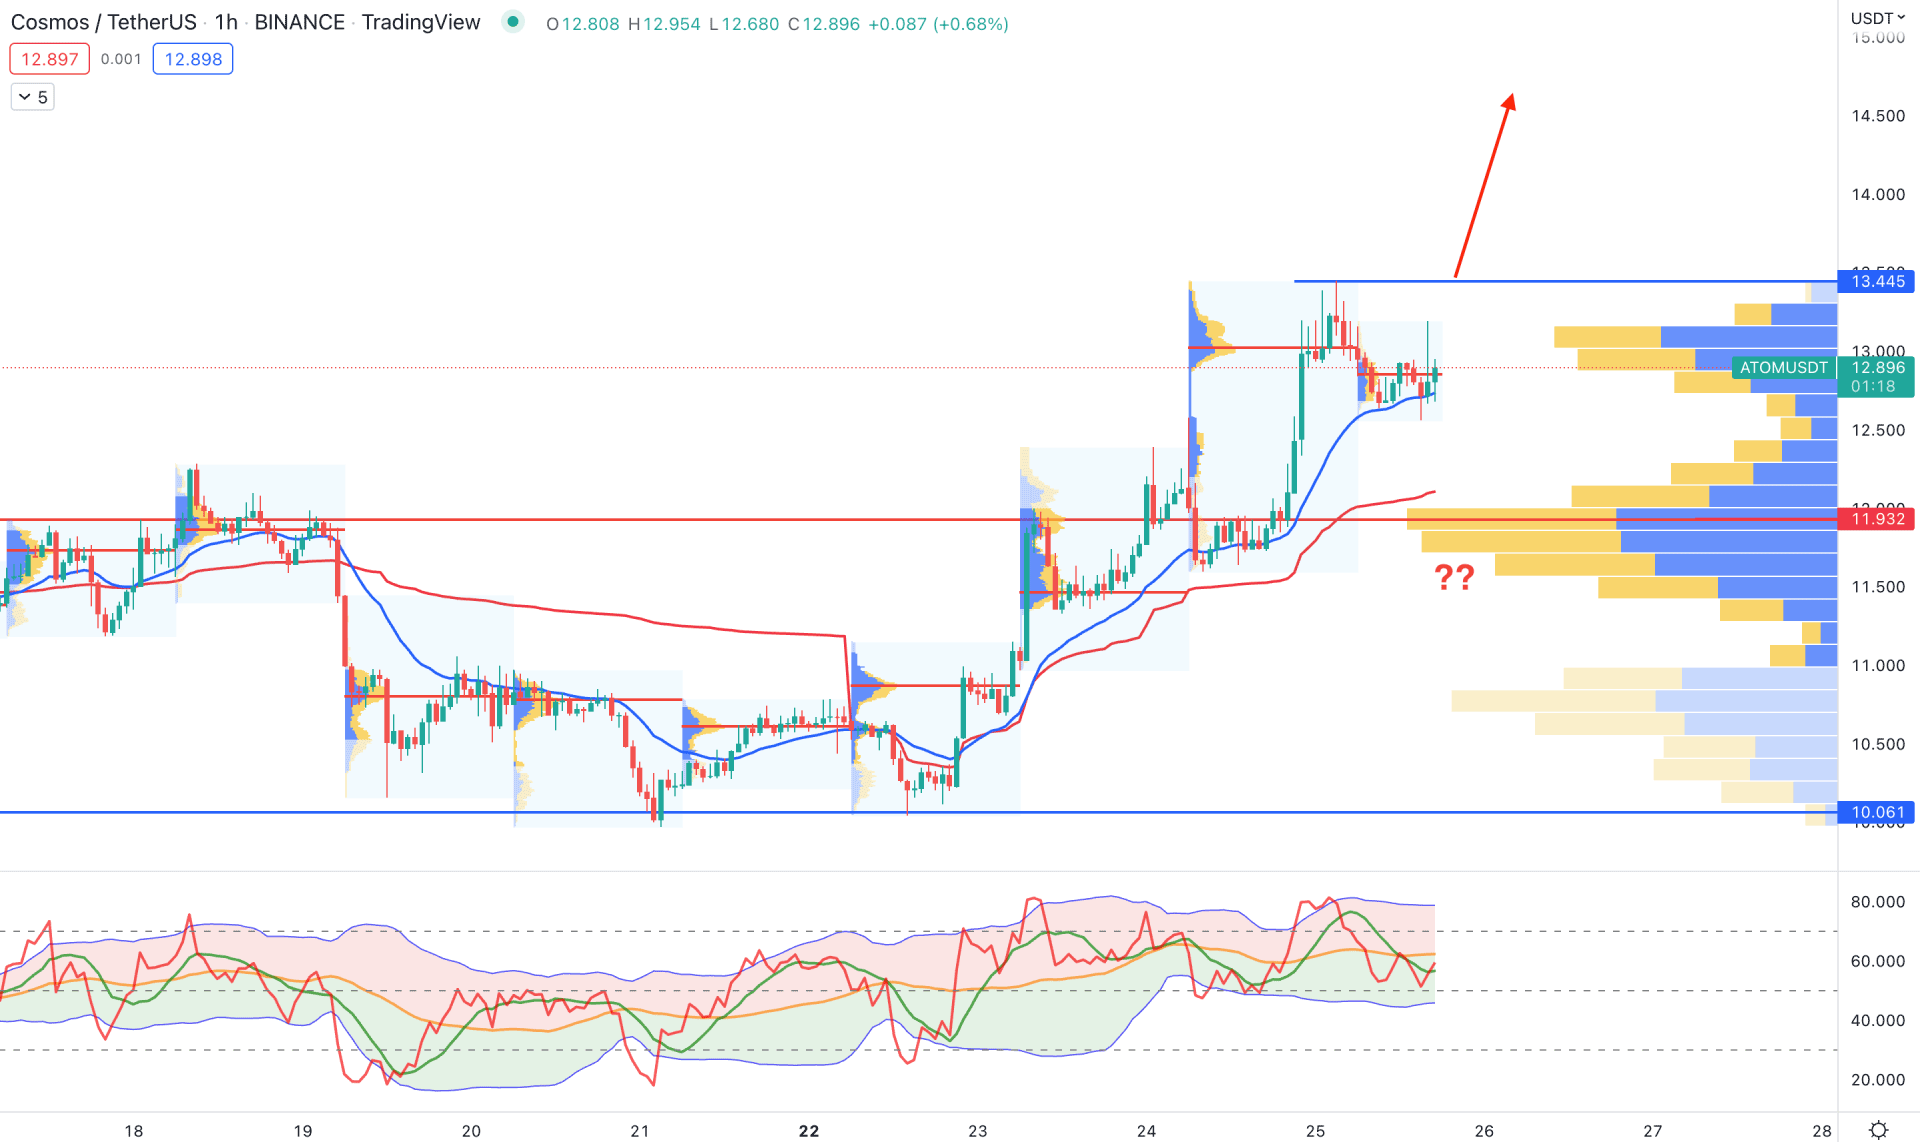
In the H1 chart, ATOM/USDT showed buyers' interest as the visible range trading volume is at the 11.93 level, below the current price. Moreover, the dynamic 20 EMA and weekly VWAP are below the price, providing minor support. However, the Traders Dynamic Index shows a neutral position, where a bullish recovery above the 50% level could provide a bullish sign.
Based on the current H1 price prediction, a new bullish H1 candle above the 13.44 swing high would validate the intraday buying possibility towards the 16.00 psychological level. On the other hand, if bears take the price below the 11.00 level with a bearish H1 candle, we can consider the buying possibility invalid. In that case, the selling pressure may extend towards the 10.06 support level.
Based on the current multi-timeframe analysis, ATOM/USDT is more likely to increase towards the 20.37 key resistance level in the coming days. However, the buying possibility should come with an intraday bullish buy signal where a bullish rejection from the H4 demand zone would be potential.


