
Published: May 14th, 2024
Goldman Sachs has revised its commodity prognosis concerning copper, increasing its estimate from $10,000 per ton to $12,000. This modification indicates the increasing scarcity trend anticipated in the copper market in 2024, specifically in the concentrate sector.
Although these upstream constraints have not yet been fully manifested in the metal market, Goldman Sachs predicts an inevitable deficit path due to the increasing pressure on refined supply compared to resilient end demand.
However, these transitory measures are anticipated to diminish as economies return to equilibrium and inventories decrease. The most recent supply-demand projections by Goldman Sachs indicate that there will be a metal deficit of 454kt this year, an increase from 428kt the year prior and 467kt in 2025, a reduction from 413kt previously.
Several rapidly expanding industries, including electric vehicle infrastructure and automation, are anticipated to contribute to the surge in copper demand. Trafigura, a commodity merchant, projects that this trend will increase copper consumption by a minimum of 10 million metric tonnes over the next decade.
Significant factors propelling this surge in demand are technological advancements, such as automation, the transition to electric vehicles and renewable energy sources, and artificial intelligence. The advancements mentioned above have significantly increased the demand for copper conductors, which are indispensable for electricity transmission.
Let's see the further aspect of this instrument from the Copper (HG) technical analysis:
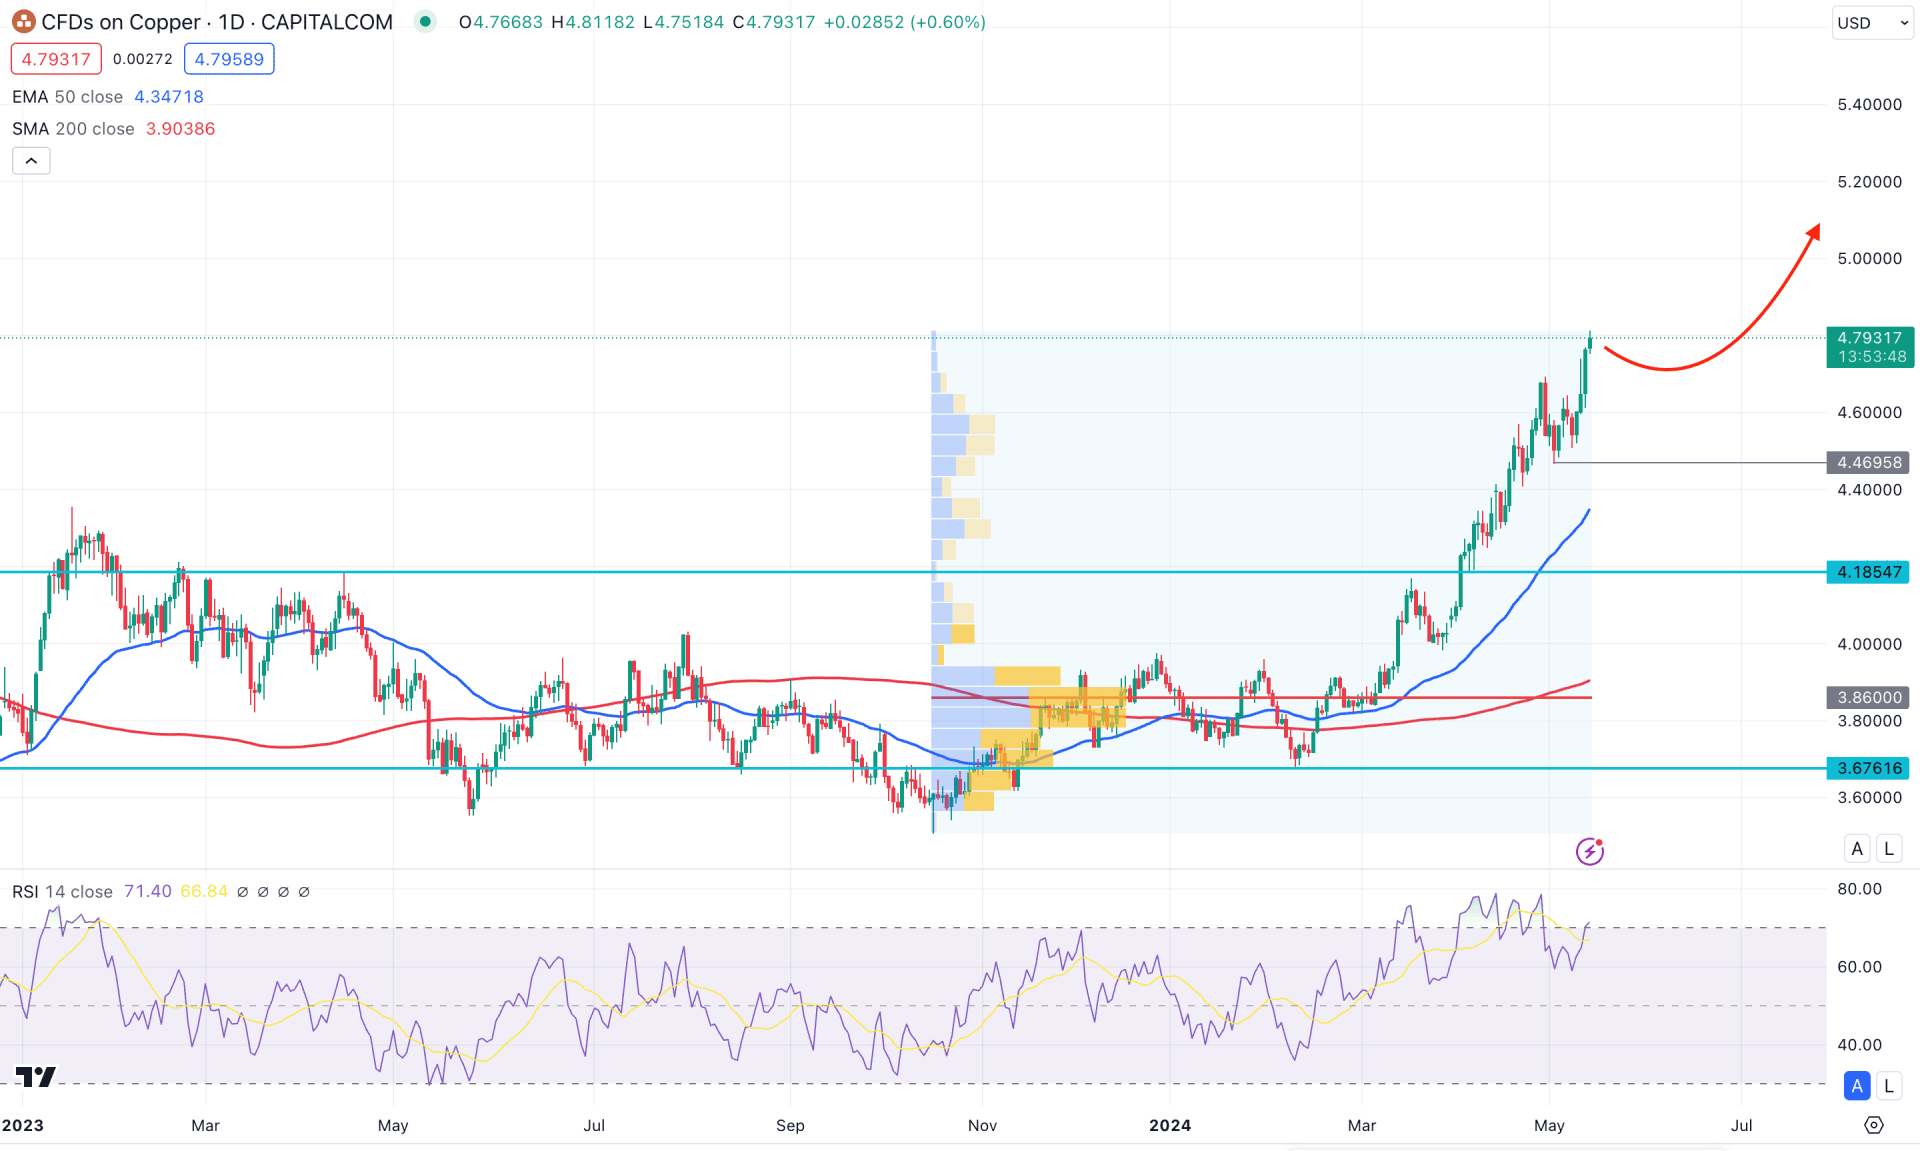
In the daily chart of Copper, the overall market momentum is bullish in the near-term price action, showing no sellers' interest above the dynamic 50-day EMA. However, extensive bullish pressure is visible from the 3.6761 support level, which indicates a pending bearish correction.
The broader context is bullish in the higher timeframe, as the recent weekly price trades higher after a valid bullish breakout from the symmetrical triangle pattern.
In the volume structure, the most active level since October 2023 suggests buyers' presence in the market. As long as the high volume level remains below the current price, any sign of a bullish rejection from near-term support levels could indicate a long opportunity. In this direction, a downside correction towards the dynamic lone could create a long opportunity.
Coming to the daily price action, the recent price shows extensive buying pressure and reached a multi-year high. As the current buying pressure is supported by the rising 50-day EMA line, we may expect the buying pressure to extend in the coming days.
In the indicator window, the current RSI level remains steady at the 70.00 level, suggesting a bullish continuation,
Based on this outlook, the Copper price could be extended lower as a mean reversion to the dynamic line. However, the 200-day SMA would work as major support, which might work as a major barrier to sellers. Primarily, a downside correction and a valid bullish reversal from the 4.4695 to 4.2000 zone could be a potential long signal, targeting the 5.2000 level.
On the other hand, a failure to hold the market above the 4.6000 zone with a bearish exhaustion could signal a bearish opportunity, targeting the 4.0000 level.
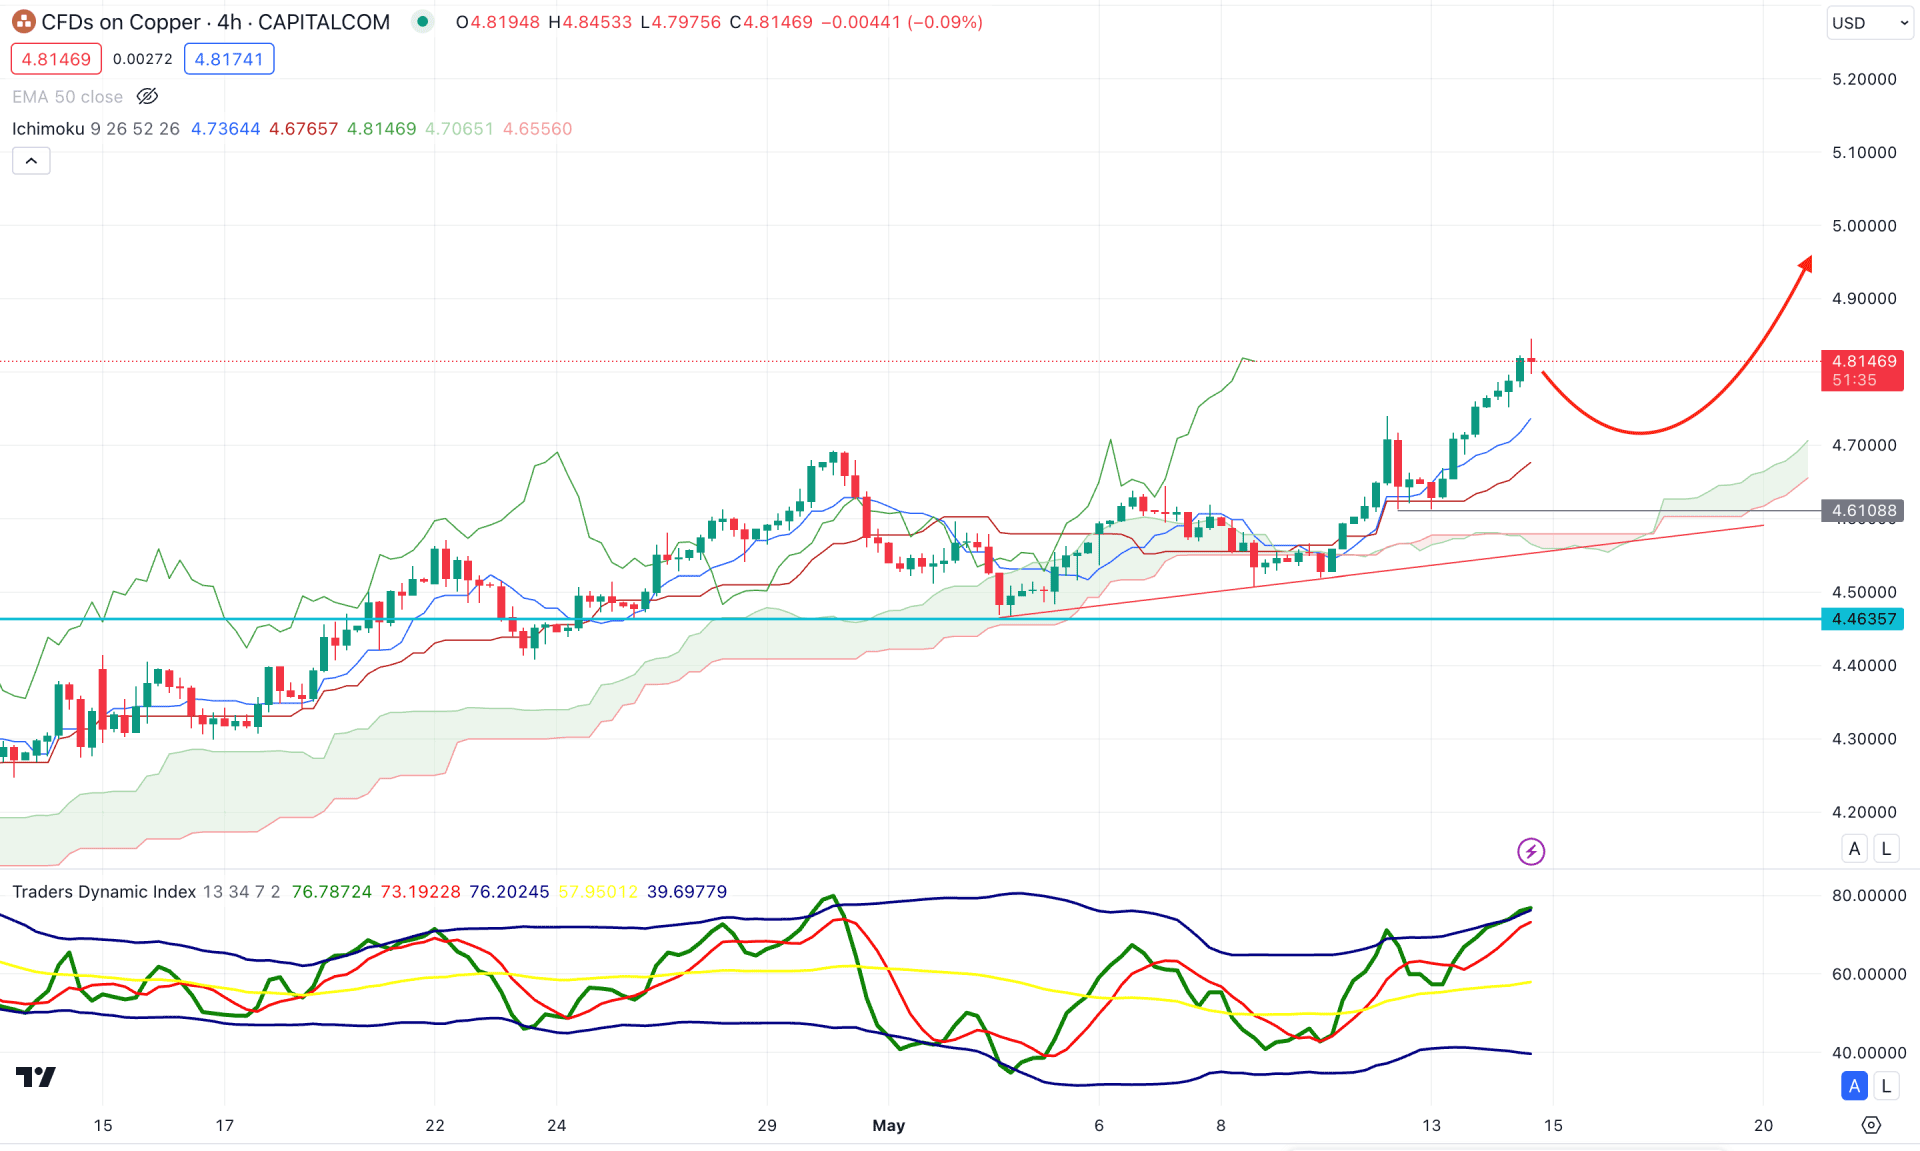
In the Copper H4 chart, the recent price trades above the dynamic Ichimoku Cloud zone, which suggests a potential bullish continuation opportunity. Moreover, the future cloud shows an upward momentum, suggesting an additional bullish signal.
In the secondary window, the Traders Dynamic Index (TDI) remains above the overbought level, suggesting ongoing buying pressure. However, the price might face selling pressure, where a bearish rebound in the TDI line could signal a minor top formation.
On the bullish side, a downside correction is pending towards the dynamic Kijun Sen level from where a long signal might come. On the other hand, a prolonged selling pressure with a valid bearish H4 candle below the 4.6108 level could extend the downside correction towards the 4.4635 level.
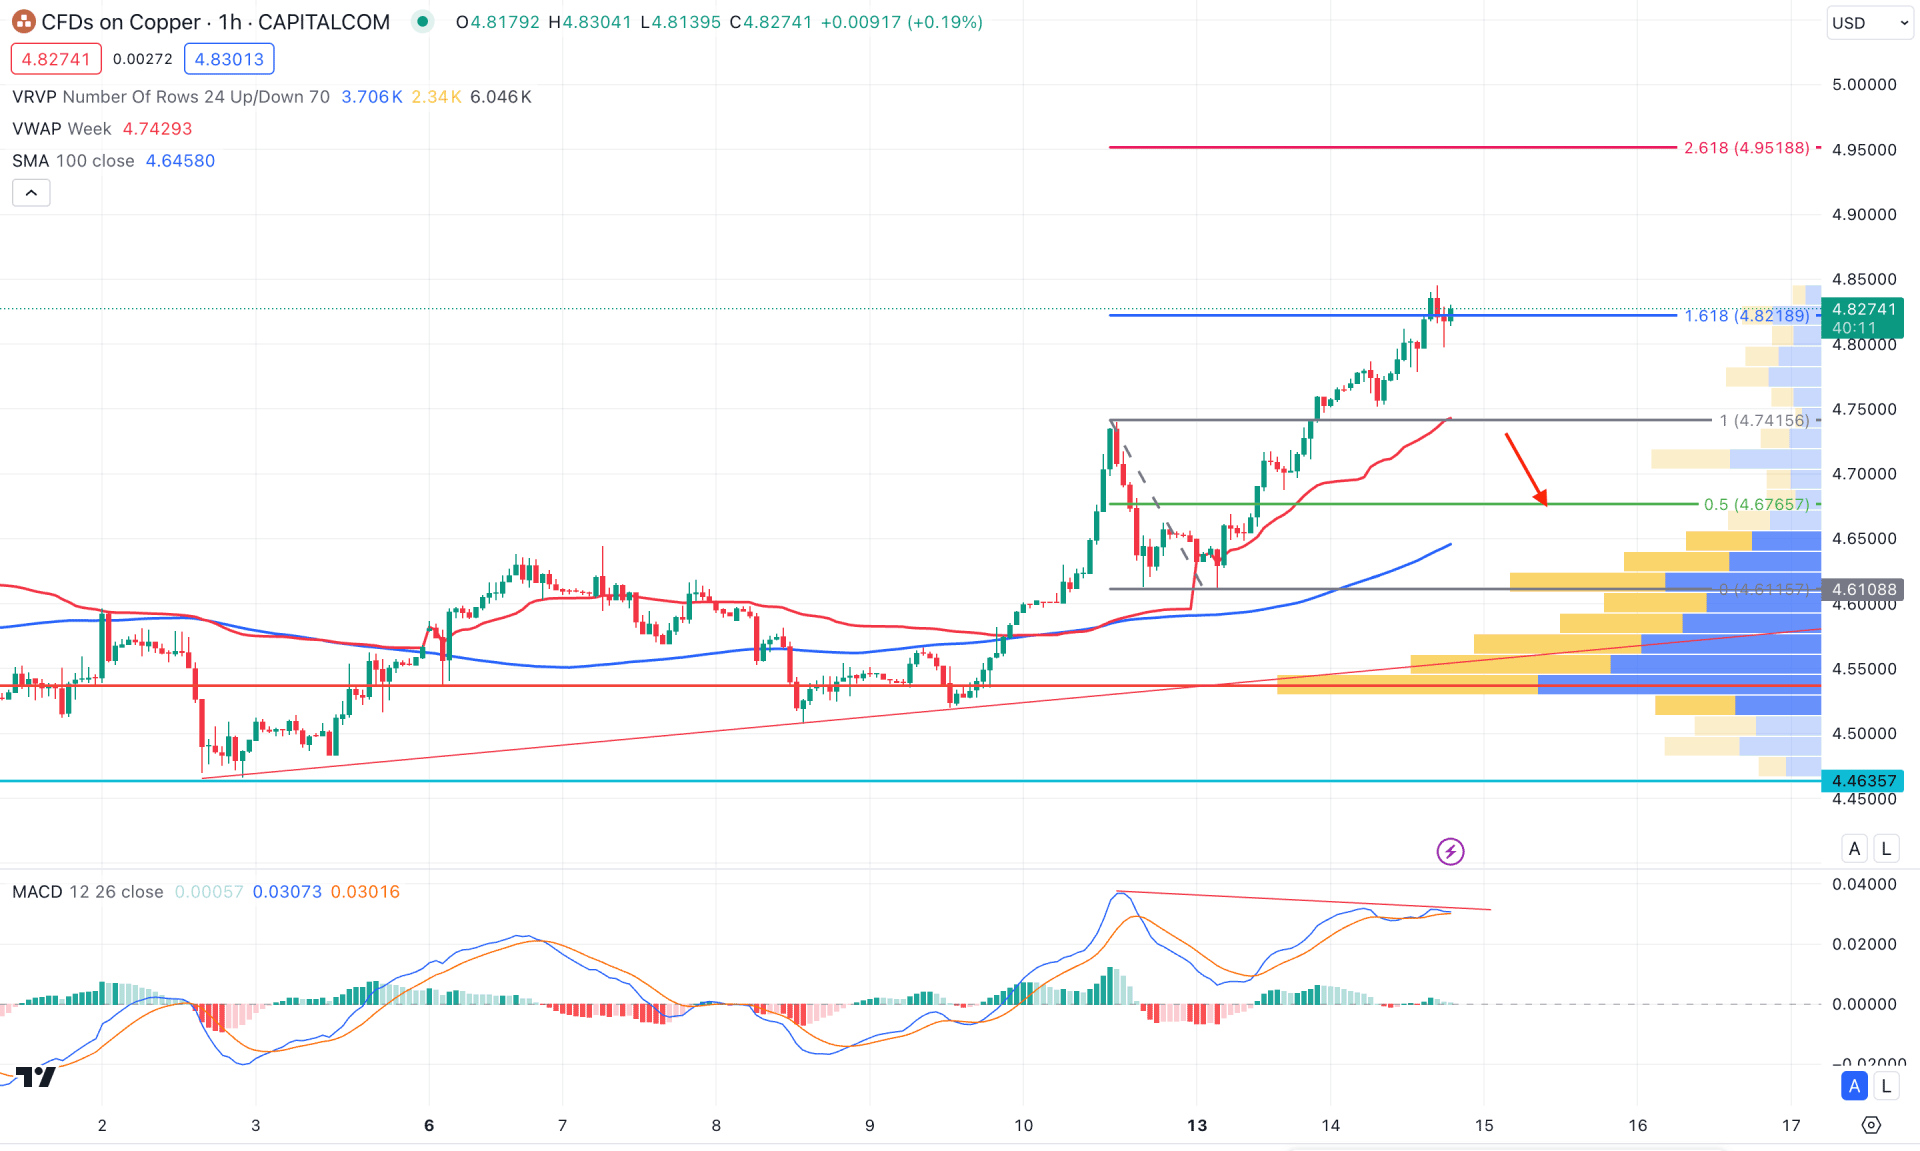
In the hourly chart, the current price trades above the visible range high volume level, while the dynamic 100 SMA is below it.
The MACD Histogram turned flat in the indicator window with an indecision in signal lines. Moreover, the signal line went sideways at the top, creating a potential divergence with the main swing.
Based on the current market outlook, a downside correction is pending in this instrument, where the main aim is to test the 4.7415 support level. A bullish rebound might happen from the 4.7000 to 4.6500 zone, which might extend the buying pressure above the 5.0000 level.
However, a counter-impulsive bearish pressure with an H4 close below the 4.6108 level might alter the current market outlook and lower the price towards the 4.0000 zone.
Based on the current multi-timeframe analysis, the ongoing bullish pressure in the Copper price is more likely to extend toward the 5.0000 psychological line. However, a minor downward correction is pending in the intraday chart, which could offer a short-term buying opportunity.


