

Published: October 6th, 2026
Constellation Brands is set to release its fiscal Q2 results this week, and its most recent quarterly performance was mixed. Reported sales declined 3% year over year to $2.4 billion, mainly due to the impact of previous wine divestitures. However, its Beer segment recorded 2% sales growth.
Management also maintained its fiscal 2027 comparable EPS guidance of $11.20-$11.90 per share. The upcoming results should offer another indication of current beer demand strength.
The stock is currently trading at its lowest valuation levels in more than 14 years. Its enterprise value-to-free cash flow (EV/FCF) multiple has declined to 16.6x. The sharp valuation decline follows a difficult few weeks for the company, with shares reaching a new 52-week low.
Let's see the further aspects of this stock from the STZ technical analysis:
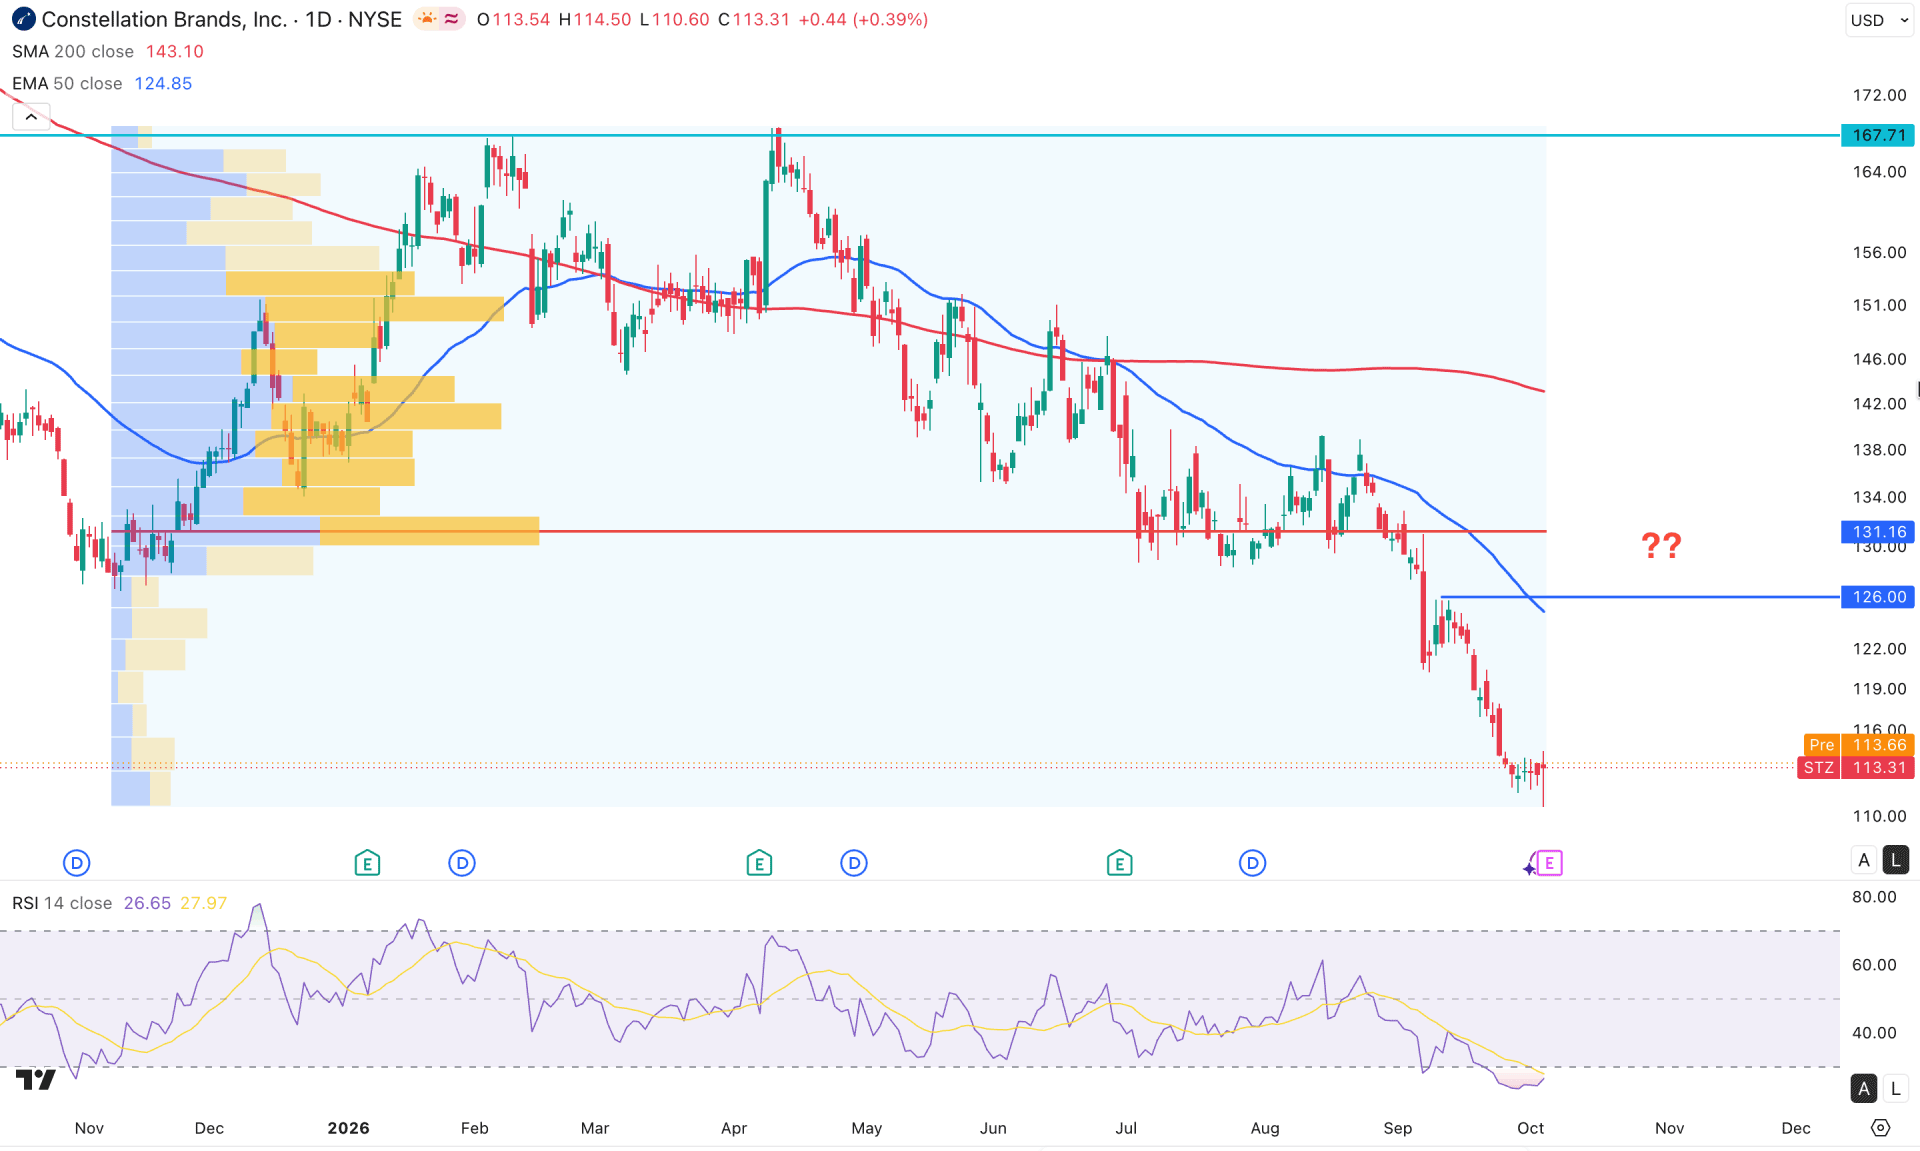
On the daily chart of STZ, ongoing bearish momentum is visible, with the current price trading at a 10-year low and no sign of a bottom forming. This signals impulsive bearish pressure, and a valid bullish rebound is needed before anticipating any counter-trend momentum.
On the higher timeframe, the monthly candle suggests ongoing bearish pressure, with a minor bullish correction expected. The weekly chart shows a sideways movement after six consecutive weeks, with signals of further extension.
Based on volume structure, the most active level since November 2025 is 131.16, well above the current price. Primarily, the broader context is bearish, as the high-volume line is above the current price. However, a minor bullish correction is pending, following mean reversion.
The main price chart shows a similar structure, with a higher bearish overextension visible against the dynamic 200 SMA. A bearish crossover between the 200 SMA and 50 EMA is clear, signaling a death cross formation in the current price chart. However, the gap between the current price and the dynamic line suggests a minor bullish correction, which is not enough to consider a bullish trend reversal.
On the other hand, the Relative Strength Index has reached the bearish overextension level, while the current line is forming a sharp recovery around 20.00. The Average Directional Index shows a recovery, with the current line at 32.45 and a rebound from the 20.00 level.
Based on this structure, momentum remains bearish. A bullish correction is highly possible at the 126.00 resistance area. As price trades at a multi-year low, opening a long position needs extra attention, given the long-term price action. Primarily, a recovery above the 126.00 level could be the first sign of a bullish rebound, though it may face a barrier at the 131.16 high-volume line. A move above this line could open the room to test 167.71 before creating a new high above the 260.00 area.
On the other hand, a failure to move above the high-volume area, with a bearish rebound from the 50-day EMA, could signal more downside pressure. The immediate support level to watch is 104.21, the 2020 low.
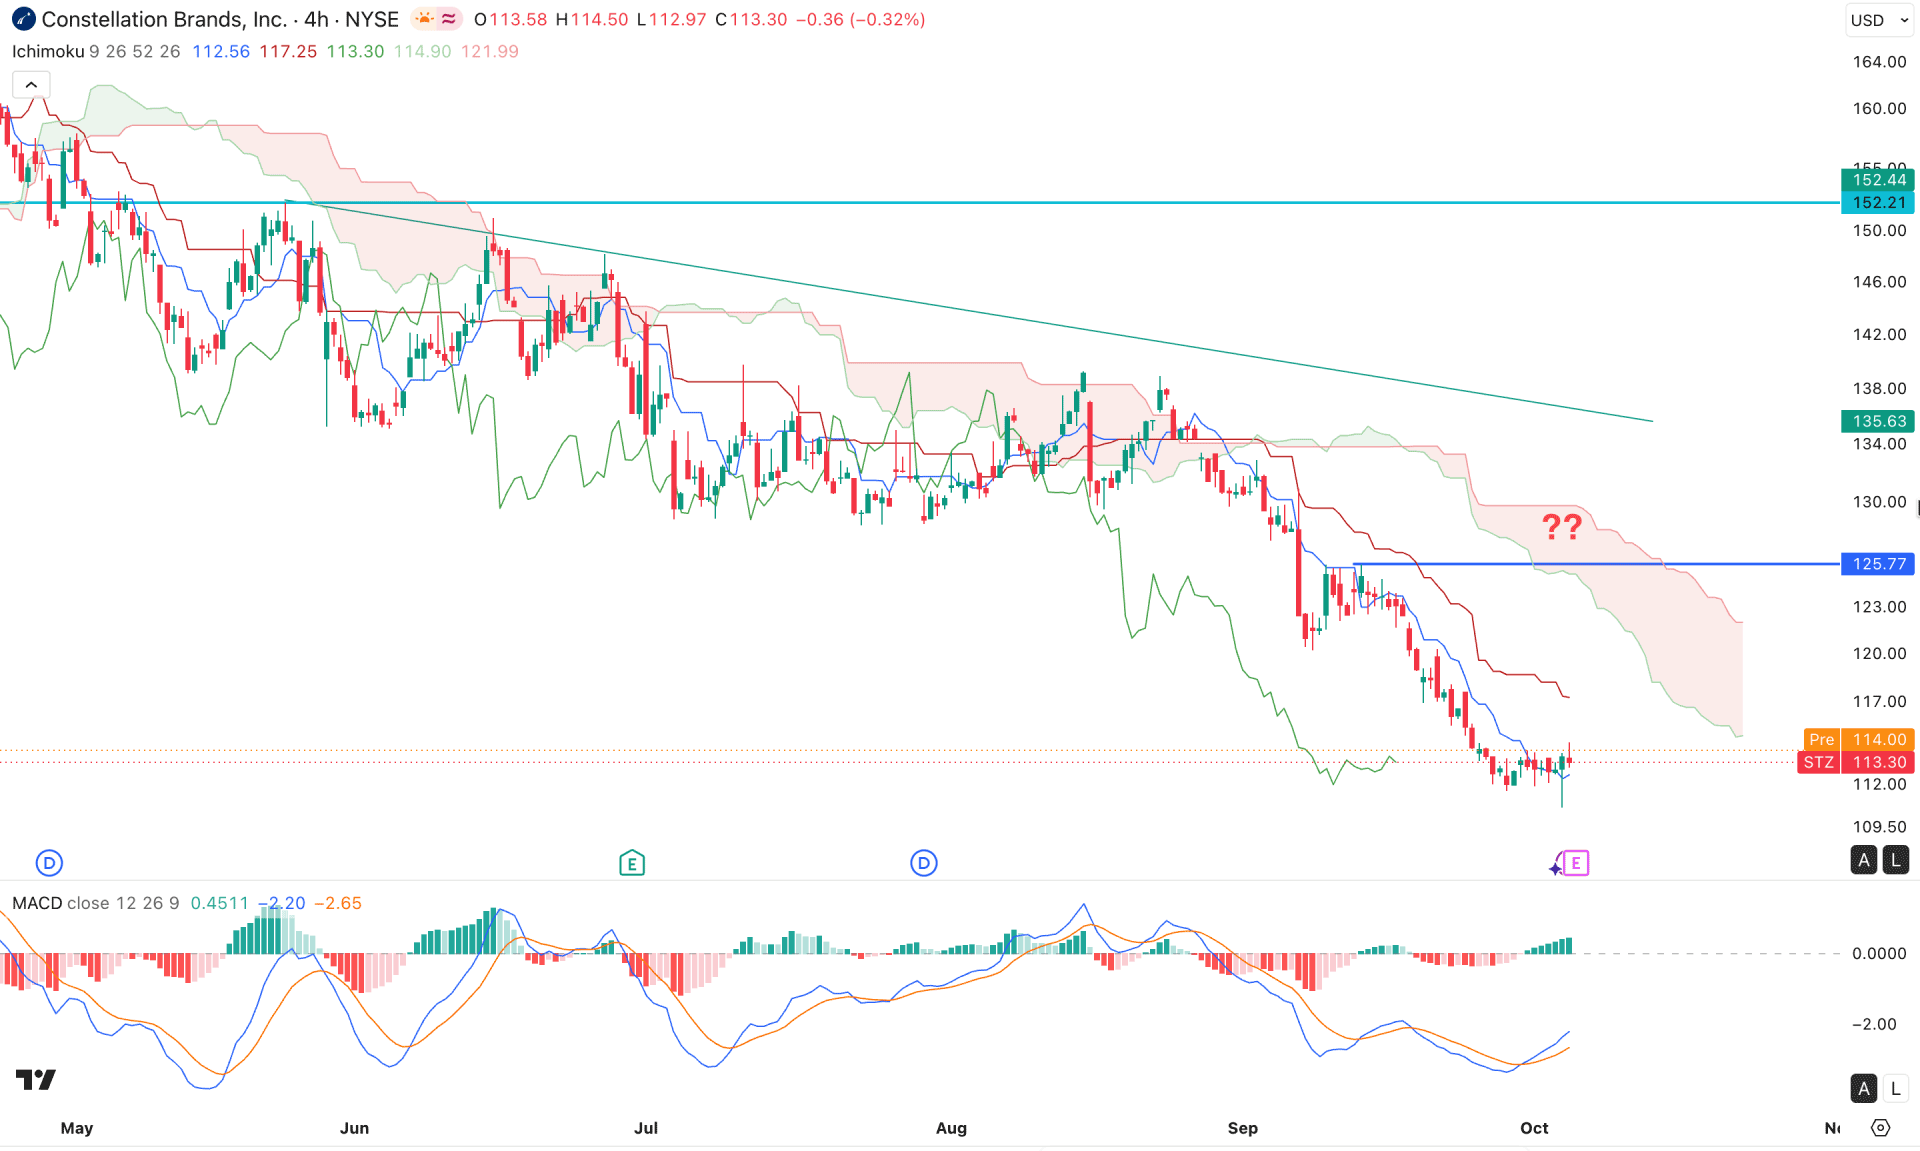
In the four-hour timeframe, the current price is trading below the cloud resistance, signaling ongoing bearish momentum. The future cloud looks positive to sellers, as both lines are heading downwards with no sign of a flat formation.
On the other hand, price action flattened after testing the 111.70 level, signaling no significant bullish activity from the bearish overextended area.
The indicator window shows bullish potential, as the MACD histogram remains above the neutral level for a considerable time, with a bullish crossover in the signal line.
Based on the market structure, investors should closely monitor how the price trades higher. The immediate resistance level to watch is 117.28. Breaking above this level could test 125.77 at any time.
On the bearish side, a failure to overcome the Ichimoku cloud resistance level could extend the possibility of testing the 103.00 support level.
A move above 125.77 could be the first sign of a bullish move. Moreover, a recovery above the cloud resistance, with consolidation, could increase the possibility of testing the 152.21 resistance level.
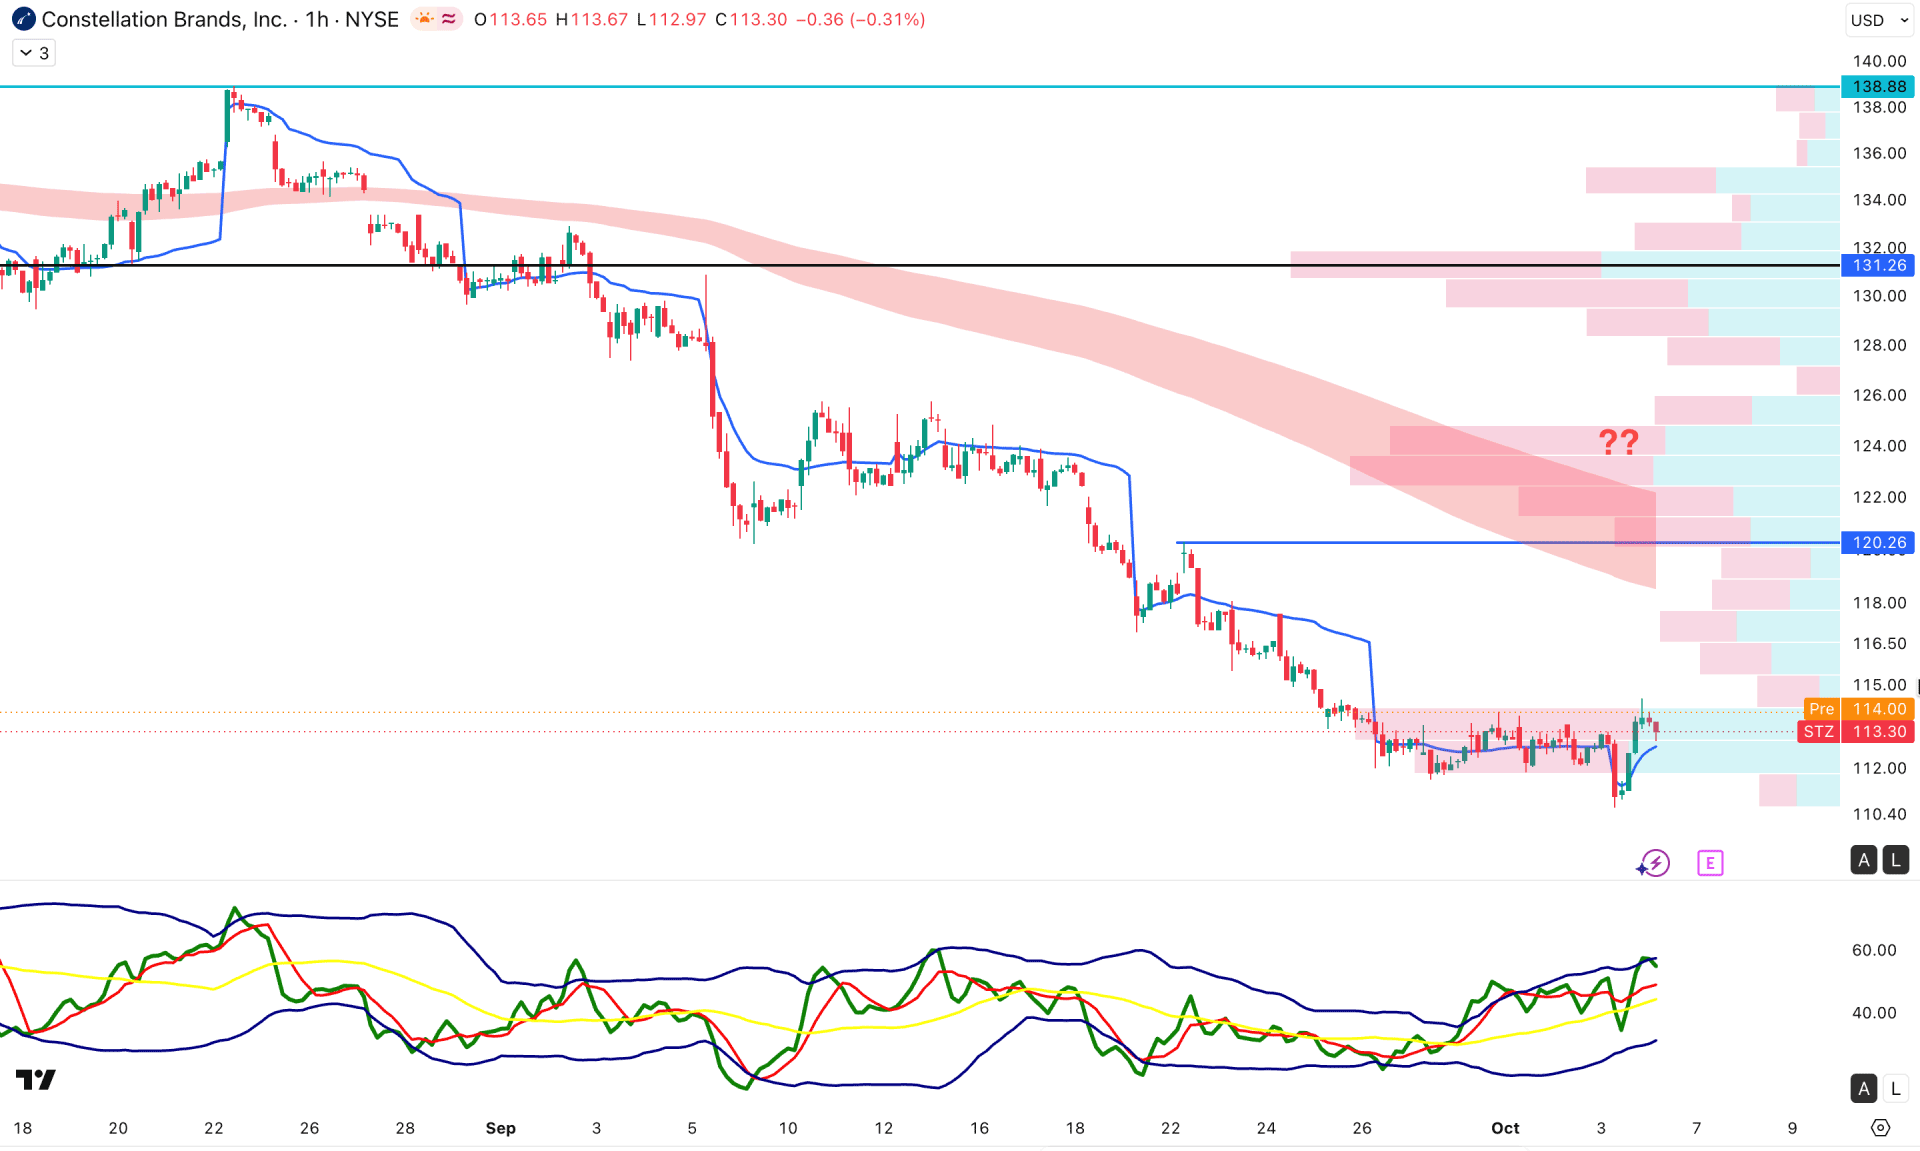
On the hourly timeframe, STZ is trading in a rectangle pattern, and the most recent price is testing the rectangle resistance. The exponential moving average remains above the entire structure and is acting as key resistance. A bullish recovery is visible above the VWAP support level.
In the indicator window, bullish price action is visible, while the Trend Dynamic Index has reached the bullish peak area.
Based on this structure, overall momentum remains bearish, and a bullish rectangle breakout could face resistance at 120.26.
In this context, overcoming 120.26 could increase the chance of testing the 131.26 high-volume line before forming a bullish reversal.
As long as price remains below this resistance area, we may anticipate a bearish continuation, with the ultimate aim of testing the 100.00 psychological level.
Based on the overall market structure, STZ stock is trading at a multi-year low, but the long-term market structure is bullish. As a result, it may attract long-term investors and holders looking to buy at a deep discount. However, the price action signals a bearish continuation, so it is too early to anticipate a bullish reversal. Investors should monitor the daily chart, where a higher valid bullish recovery could be the primary rebound opportunity.


