Published: April 7th, 2020
Zcash is considered by many as one of the top privacy coins. Compared to other crypto privacy projects like Monero, Dash, and Pivx, Zcash has unique privacy settings that stand out from others by far. If we consider the current offshore banking sector, it most likely has more transactions that the public banking sector. Zcash could be the replacement of the current offshore banking as we know it, which in the long run can result in a substantial increase in price.
There were studies done by one investment company and based on their calculations, if Zcash will reach 1% of the total offshore banking transaction, the price can be as high as $6,000 per coin. Currently, price stands near $37 and if it reaches $6k, that would be a whopping x160 growth! But what will happen if Zcash will reach 10% of the total offshore transactions?
Obviously, these are pure speculations but definitely worth knowing about. Let’s get started with the price action on the Weekly chart and see what ZEC/USDT is actually up to.
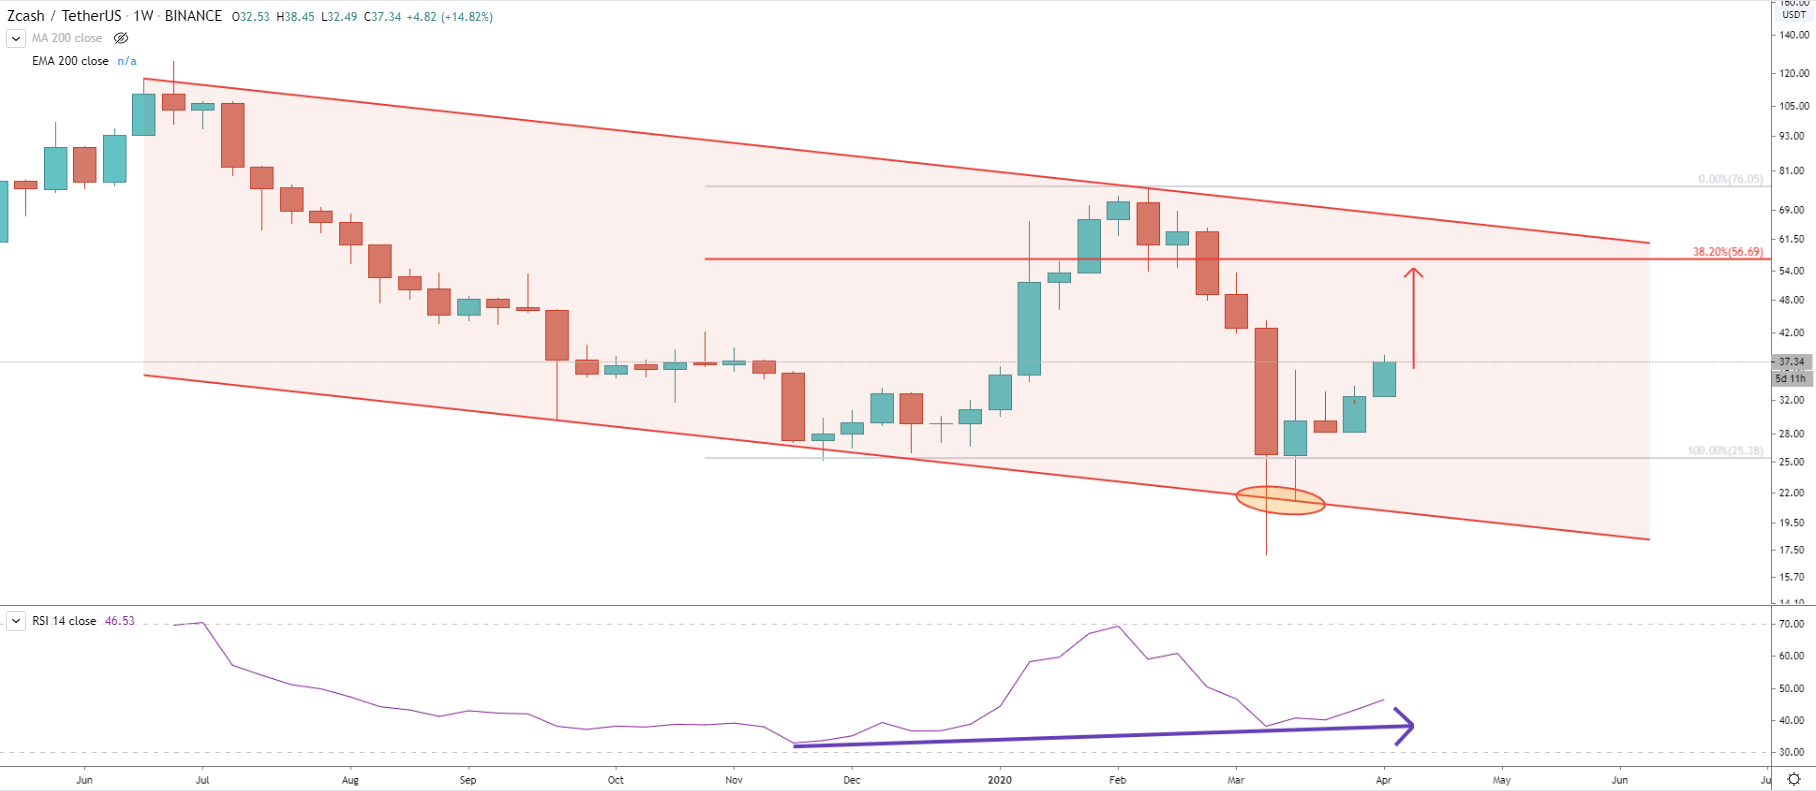
We can see that price has reached the bottom of the descending channel. First, there was a spike below, but the following week, the price has rejected the lower trendline cleanly. At the same time, we can see, that the RSI oscillator formed a bullish divergence, which is an extremely positive sign for Zcash in terms of growth potential. I would like to remind you, that all this is on the weekly chart, which is a very high timeframe, with very high growth potential.
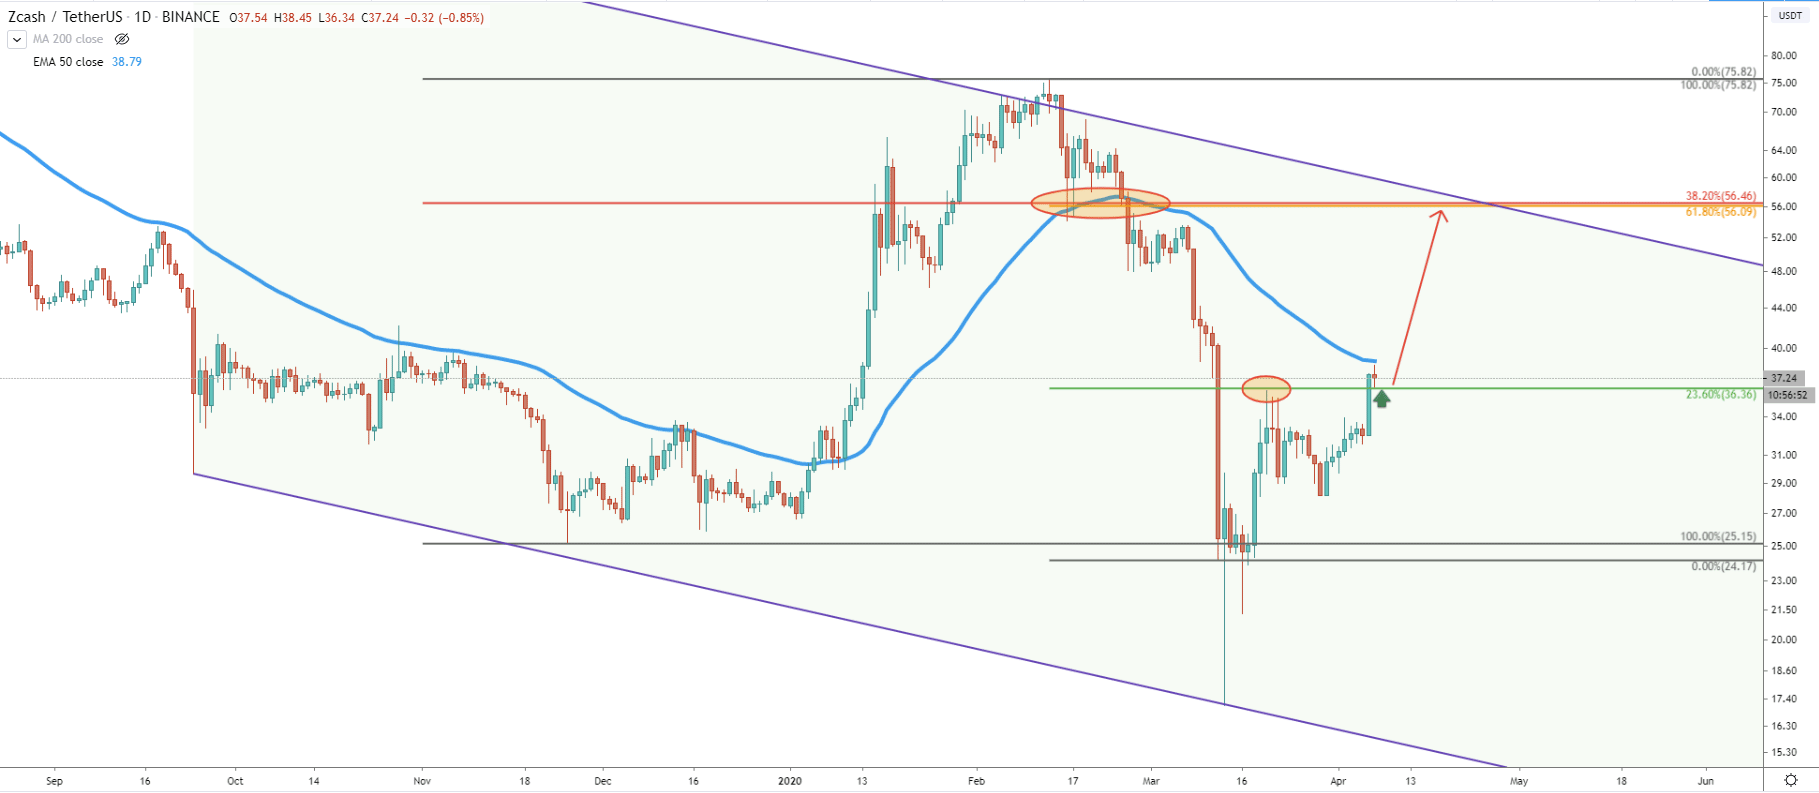
On the daily chart, price broke above 23.6% Fibonacci resistance level at $36.36, with a closing price above this level. Previously this level also acted as the resistance but currently, it is acting as the strong support. Zcash has approached the 50 Exponential Moving Average, although price hasn’t touched it yet. Perhaps for the uptrend confirmation, we would need Zcash to break and close above it, although buying opportunity seems to be already there. It will remain open as long as the price remains above the $36.36 support level. In this case, the pair expected to reach $56 resistance level, which is over 50% growth from the current price.
The upside target is confirmed by two Fibonacci retracement levels, one being 61.8% and another 38.2%. This resistance also corresponds with the upper trendline of the descending channel as well as the breakout point of the 50 EMA.
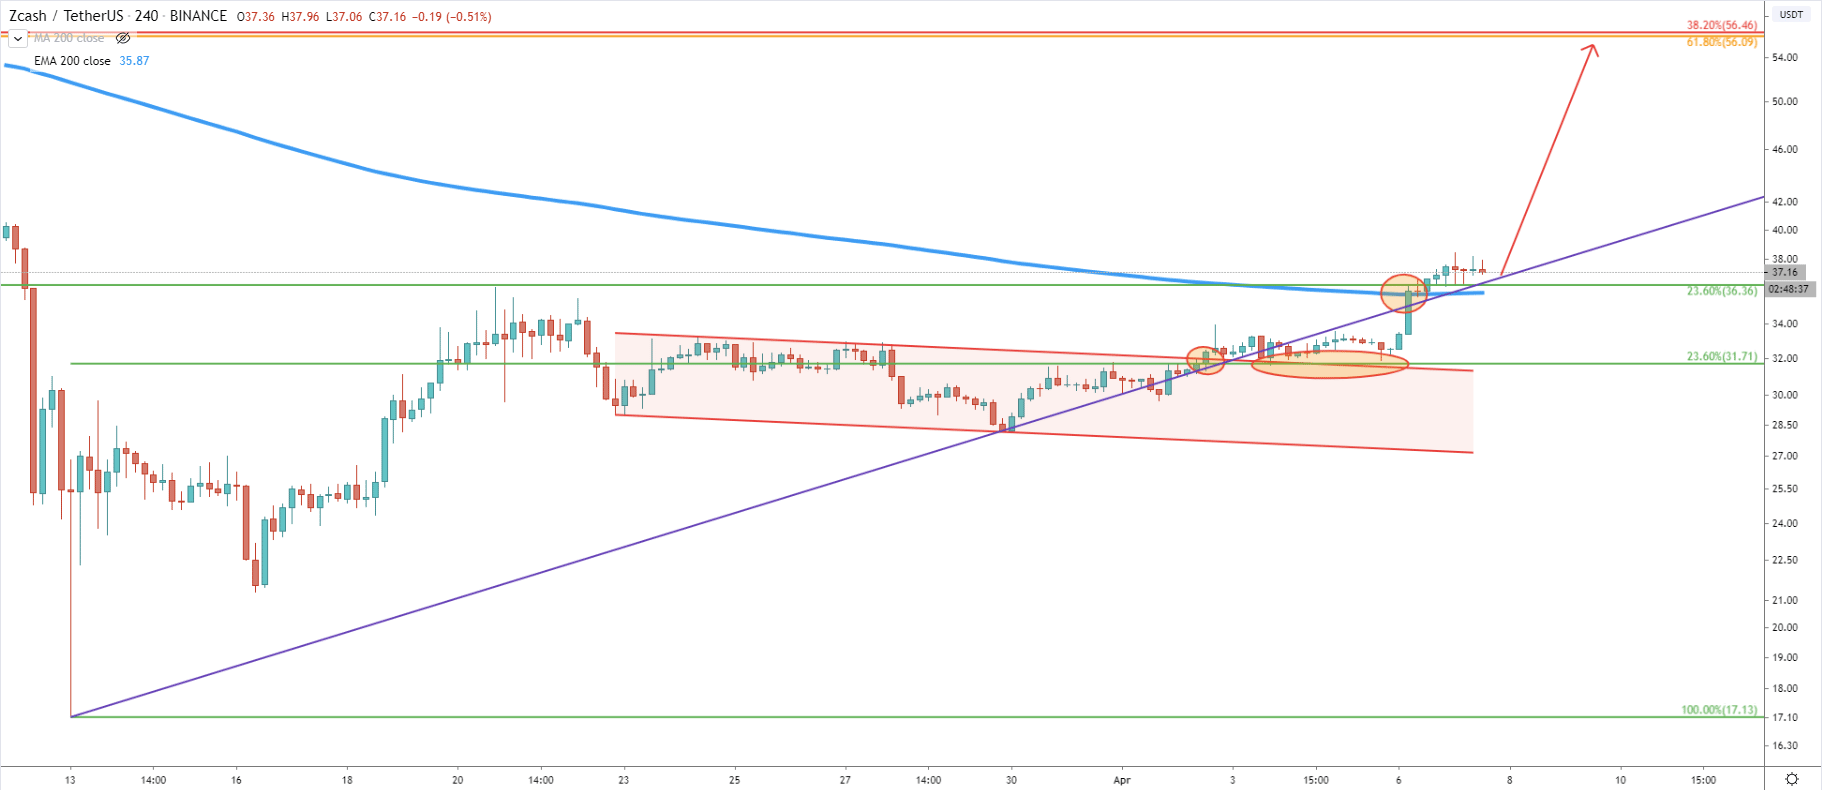
Above we can see the break above the descending channel after which price rejected the 23.6% Fibs at $36.36. Now, the $36.36 support could play a key role, where the price will either reject it and continue to move higher or will break below and correct towards $31.70 support once again. But in any case, whether there will be a correction or not, Zcash looks extremely bullish in the short, medium and long term.
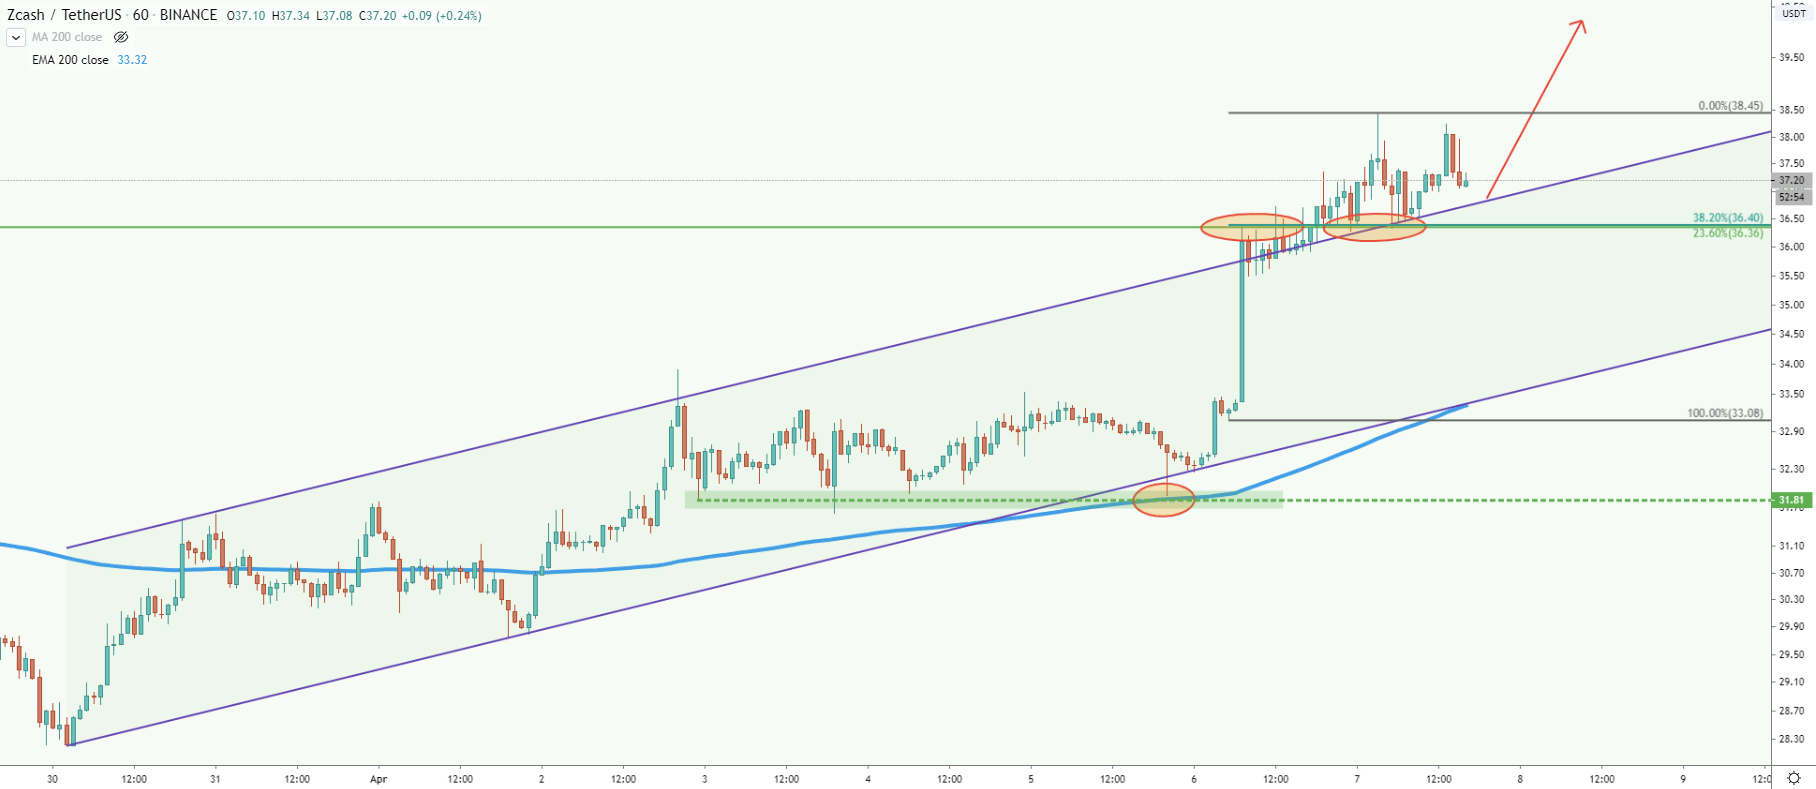
The 1H chart shows the recent breakout of the ascending channel, prior to which price rejected the 200 EMA. This means that on every single timeframe that analyzed here, we have an indication that Zcash is entering the phase of a long term uptrend. At the very least, a short term uptrend towards the $56 area should be expected. If ZEC/USDT will break above the $57, this might be a long waited confirmation of strong bullish sentiment for weeks to come.
Zcash showing bullish signs on multiple timeframes, which could either mean a strong move to the upside or a potential long term trend reversal.
There is only one upside target to watch, and this is a $56 resistance area confirmed by multiple indicators as mentioned above. Daily break and close above $57, is likely to result in price moving towards $100 strong psychological resistance.
At this stage, the downtrend can only be considered if price breaks below $36.36 support. This could be the first warning sing and price might decline towards the second support at $31.71. But only break and close below the second support on the daily chart will invalidate bullish scenario. Then the downtrend continuation will become a much more likely scenario.
Support: 36.36, 31.71
Resistance: 56.00, 100.00


