
Published: August 3rd, 2023
The Bank of China announced on July 10 that testing for SIM card-linked payments using the digital renminbi, also known as the digital yuan, would commence. The testing began on 11 July, and the bank is collaborating with China Telecom and China Unicom, two of the largest telecommunications companies in China.
The initiative's primary objective is to facilitate payments using near-field communication (NFC) and "super SIM cards." Users can essentially make digital yuan payments by touching their mobile devices to designated payment terminals.
After surfacing on mainstream social media, this news has sparked considerable interest in the CFX community. Some members believe that the Bank of China's recent action could promote the future adoption of CFX.
Conflux Network and China Telecom partnered in May 2023 to develop a Blockchain-powered SIM card (BSIM). Some CFX devotees believe that the Conflux Network will play a significant role in the new SIM Card e-CNY payment system due to this collaboration.
Let’s see the upcoming price direction of this token from the CFX/USDT technical analysis:
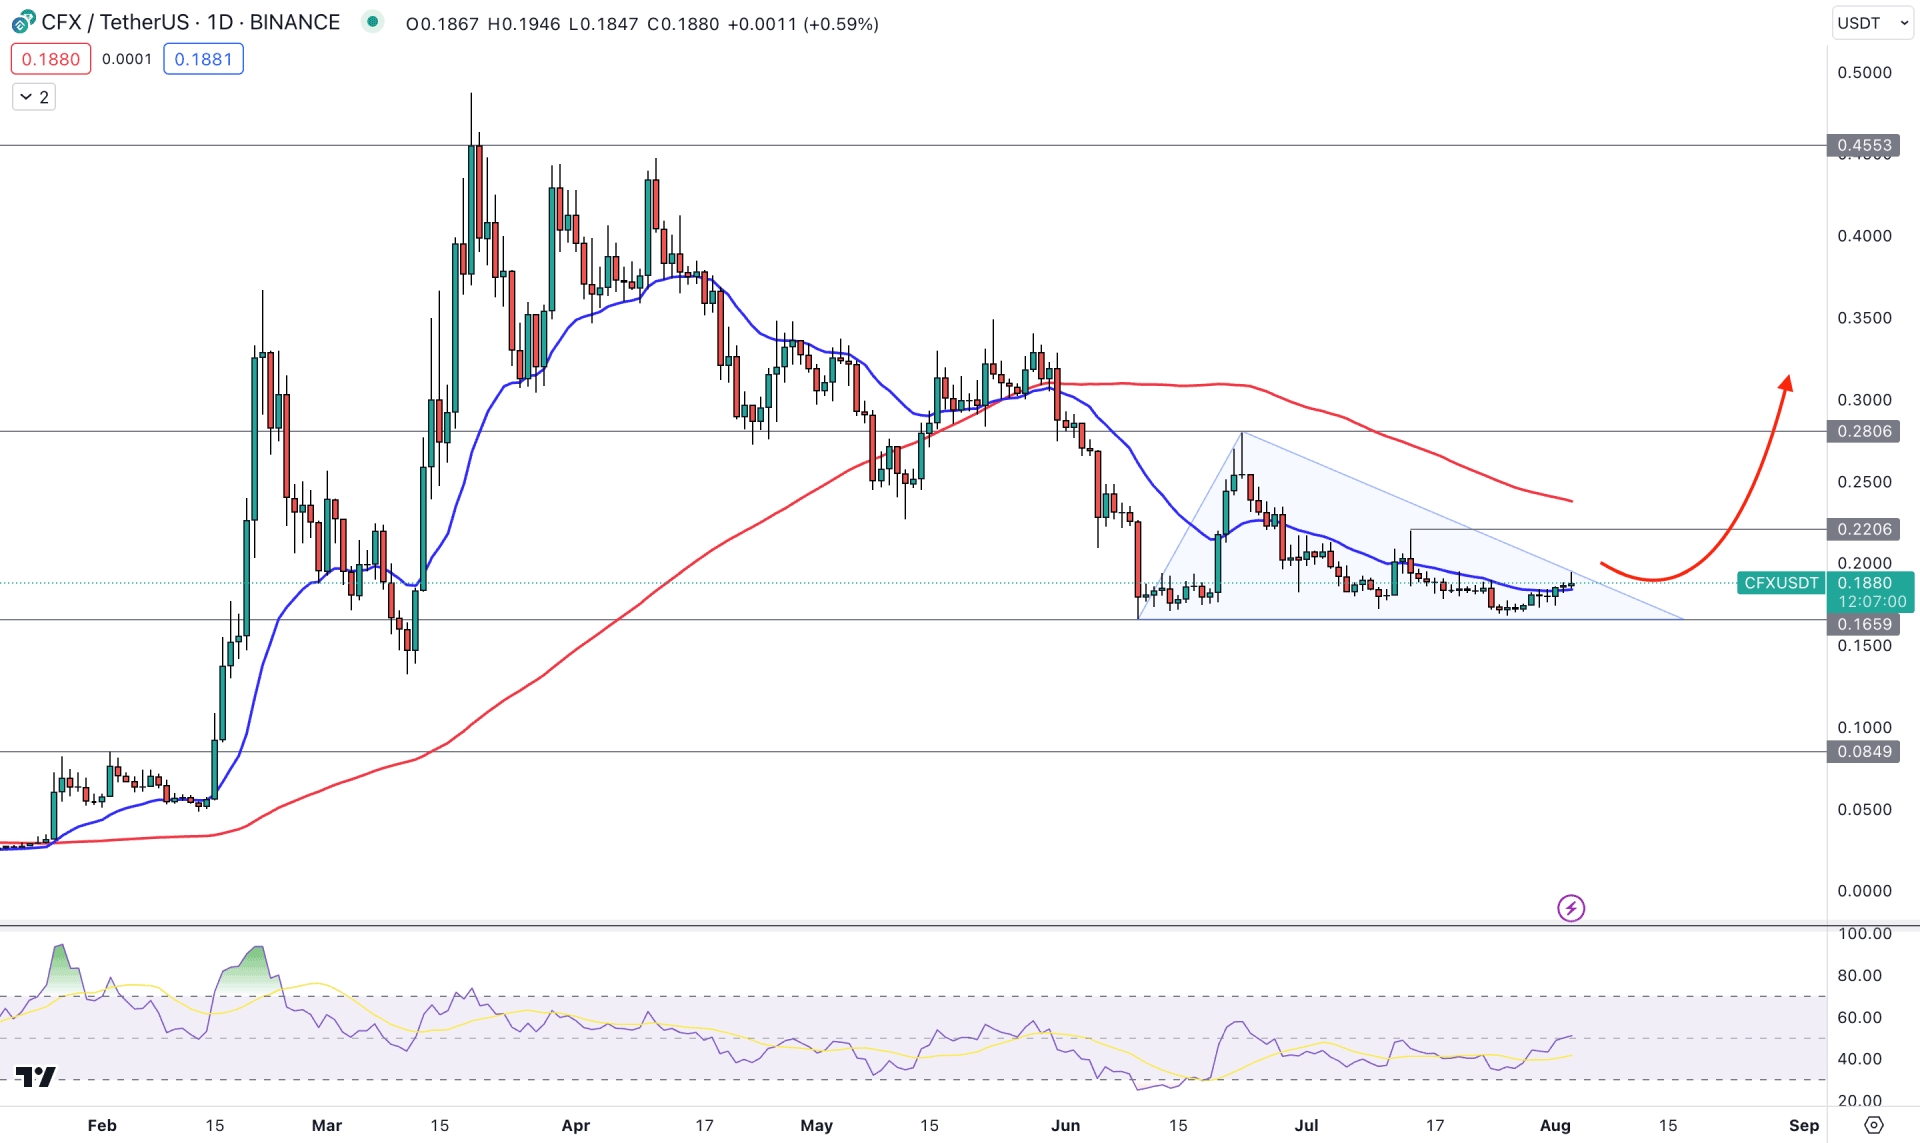
In the daily price of CFX/USDT, the broader outlook is corrective, backed by a strong bullish trend, which can end up with a strong bullish trend continuation pattern. As of now, investors might expect the consolidation to be over before anticipation of a long opportunity.
The upward pressure is potent in the higher timeframe price action as a bullish pennant pattern is visible on the weekly price. Moreover, the monthly price action shows a corrective momentum after a long bull run.
In the daily price, the 100-day Simple Moving Average is still above the current price, working as a strong barrier to bulls. However, the dynamic 20-day EMA is still below the current price, working as an immediate support.
The current 14-period Relative Strength Index shows a buying possibility as it rebounds to the 50.00 line and aims to test the 70.00 line.
The recent triangle formation from the 0.1659 static support level would be the main price pattern to look at. Investors should wait for a valid bullish breakout from this pattern before anticipating a bullish trend. The primary aim is to look for a valid break above the 0.2206 resistance level with a daily candle close. However, a conservative buying approach needs a stable price above the 100-day SMA level, which can increase the price toward the 0.4552 level in the coming days.
The alternative trading approach is to seek a short opportunity if the price exceeds the 0.1650 level and forms a bearish D1 candle. In that case, we may expect the bearish pressure to extend toward the 0.1000 area.
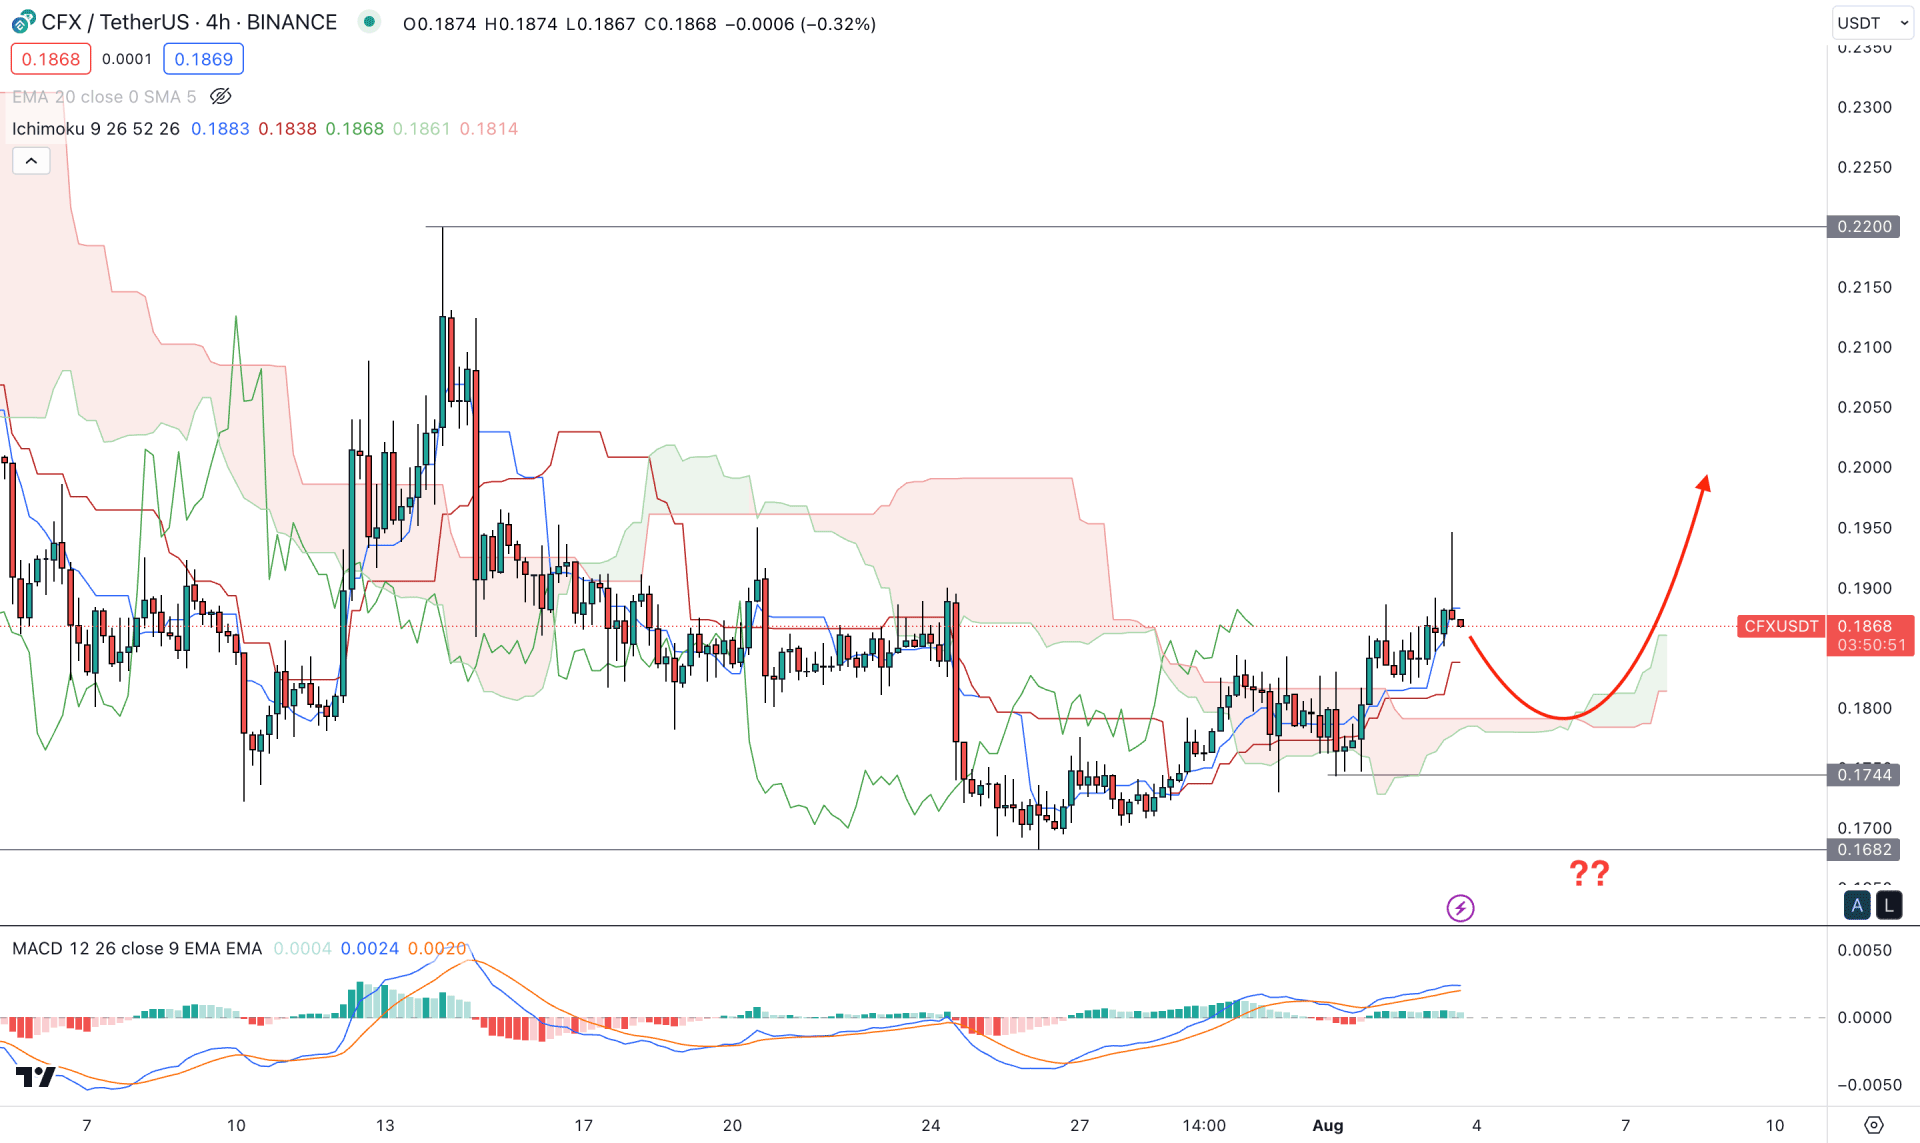
In the H4 timeframe, the current price is trading above the Ichimoku Kumo Cloud, but the bullish breakout from the cloud support is not supportive to bulls. Also the most recent price shows a false break at the 0.1900 psychological level, which may indicate buyers failure in the market. However, the future cloud is still supportive to bulls, where the Senkou Span A is above the Senkou Span B.
In the secondary window, the current MACD Histogram shows a neutral opinion as it remains closer to the neutral level. Moreover, MACD EMA’s are at the positive zone with no sign of seller dominance.
Based on the H4 outlook, an additional bullish rejection from the dynamic Kijun Sen is needed before anticipating a bullish trend towards the 0.2100 level. However, a break below the 0.1744 level with an H4 candle could lower the price towards the 0.1000 area.
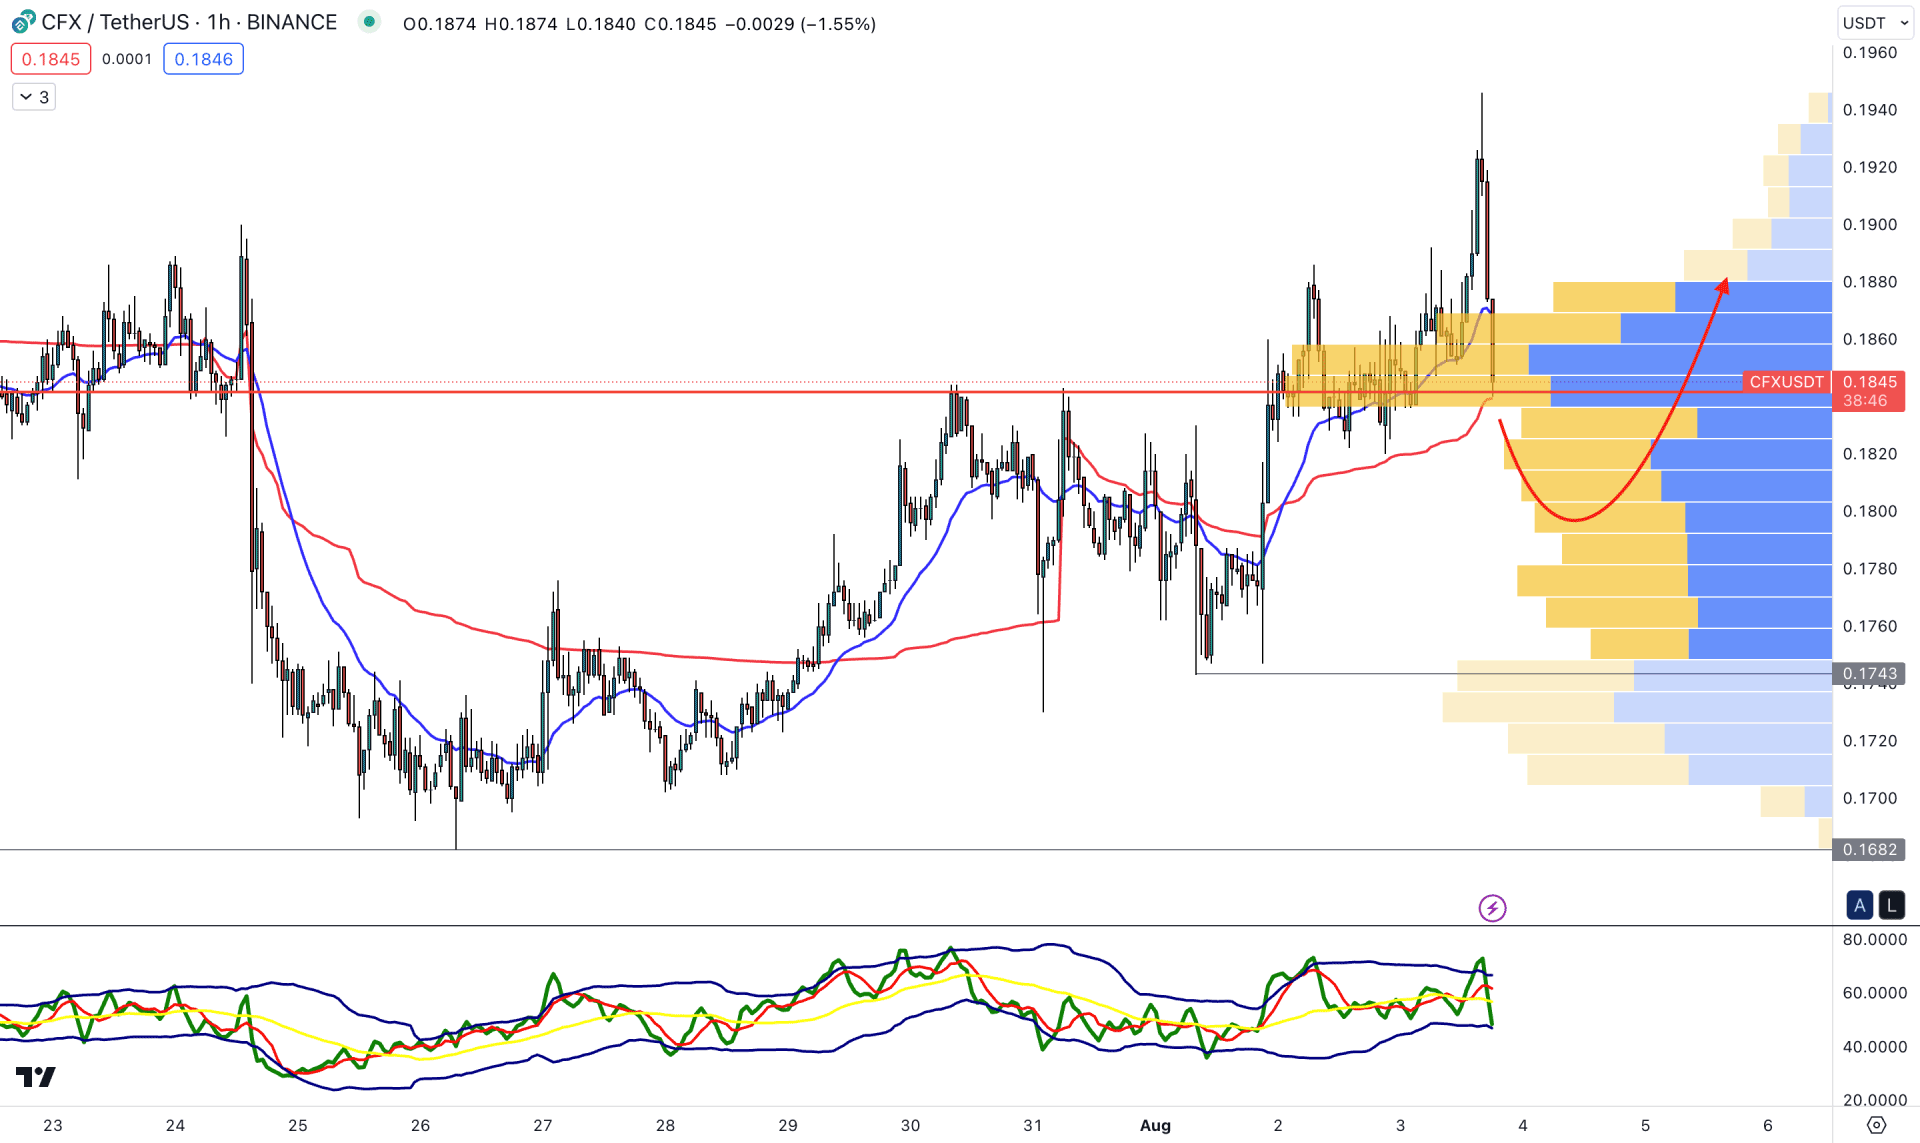
In the H1 timeframe, the buying pressure is questionable from the immediate rejection with an H1 candle below the visible range high volume level. However, the dynamic 20 EMA and weekly VWAP are still below the current price, working as support levels.
The current TDI level shows bearish pressure, remaining below the neutral 50.00 line. However, the oversold position at the lower band area could result in a bullish trend reversal.
Based on the H1 structure, investors might expect bullish pressure if the price shows any immediate reversal with an H1 candle above the high volume level. Conversely, a bearish H1 candle below the 0.1750 level could lower the price toward the 0.1500 area.
CFX/USDT daily price is more likely to offer a bullish breakout from the current triangle pattern, which needs a proffer validation before anticipating a long trade. However, the intraday price is still bearish, and any rejection from the resistance could lower the price in the coming hours.


