
Published: January 21st, 2021
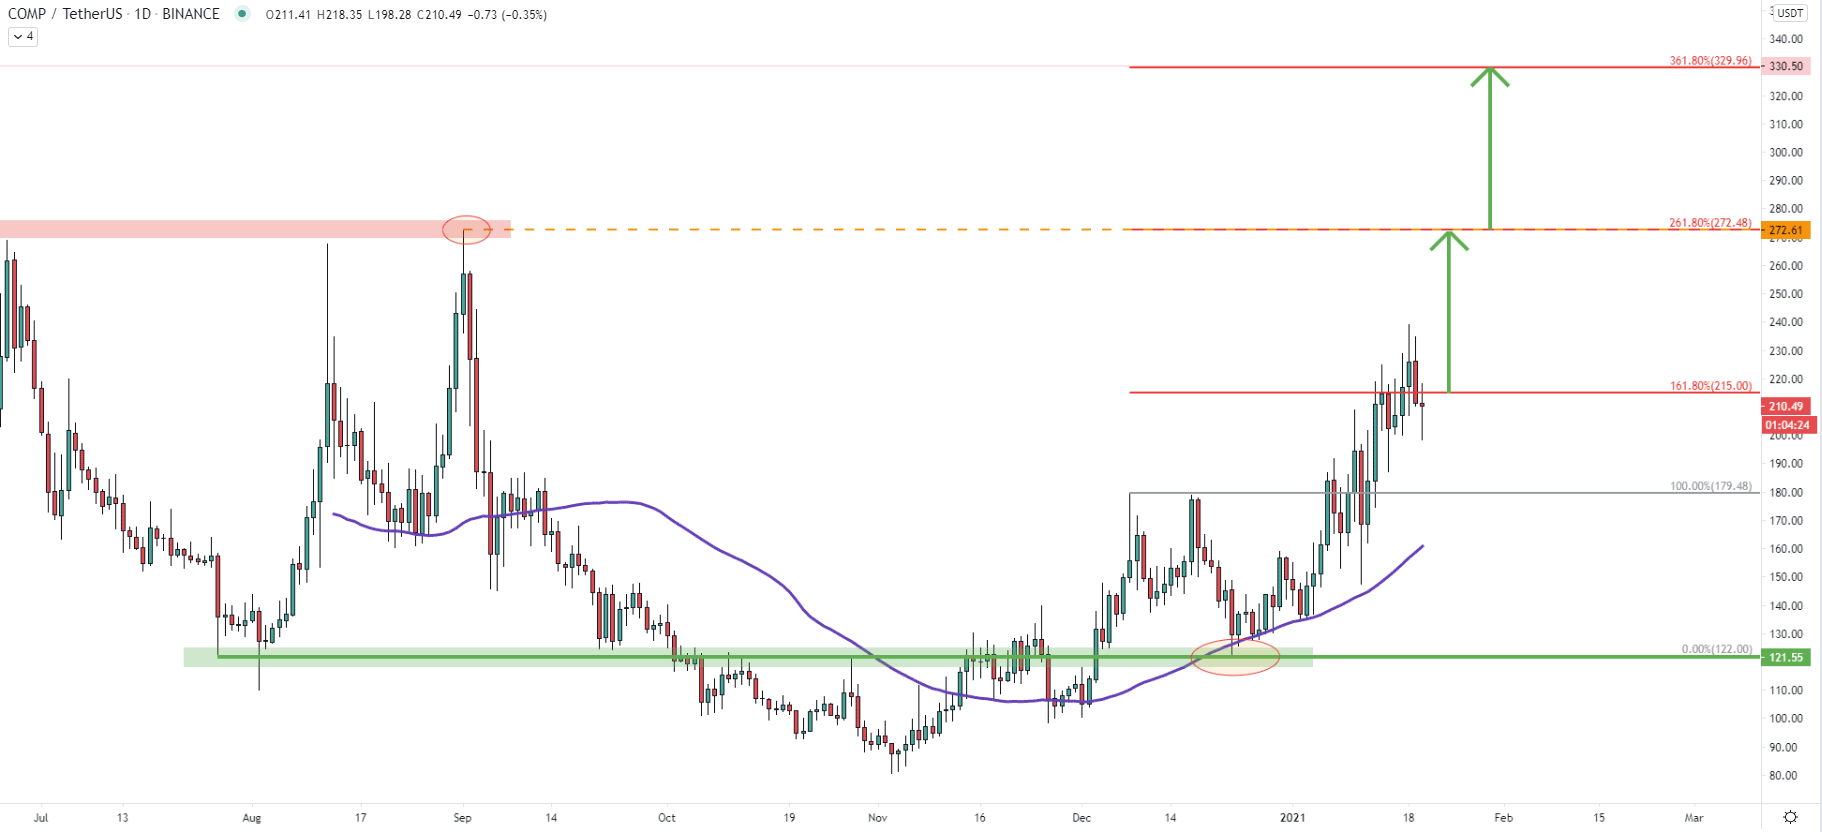
Back in December 2021, COMP/USDT has clearly rejected the 121.55, which previously acted as the support as well as resistance, in other words, a supply/demand zone. At the same time price has rejected the 50 Simple Moving Average, and this was the moment when the uptrend has started. Since the beginning of this year, COMP price has increased by 95%, while moving from 124.55 up to 238.99 high, established just a few days ago.
Fibonacci retracement indicator was applied to the corrective move down, where price bounced off the 122.00 support area and the SMA. It shows 3 important resistance levels, namely 161.8%, 261.8%, and 361.8%. As can be seen, the first resistance at 215.00 got broken, which might result in the price moving towards the second Fibonacci level at 272.48. This price zone might be a very strong supply area, as it corresponds to the previous resistance formed during 2020. However, a break above 272.61 can send the price even higher towards the next Fibs at 330.00 level, which is quite an attractive psychological number and a potential 65% price increase.
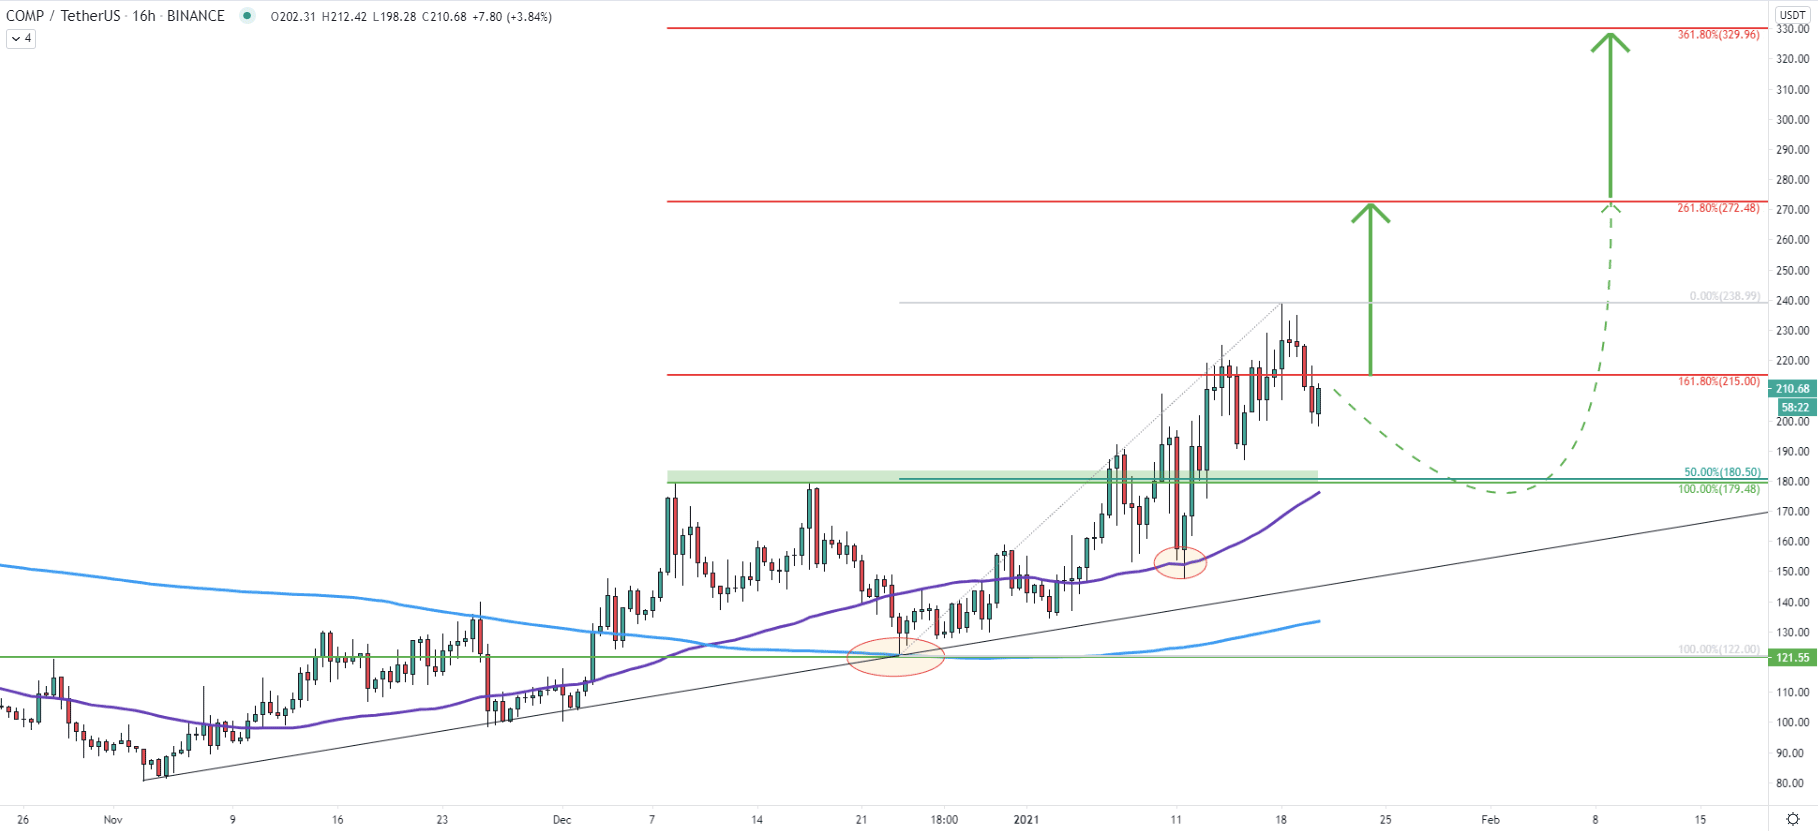
Price continues to rise while producing higher highs and higher lows. At the same time the uptrend trendline, as well as the 200 Exponential Moving Average, was rejected back at the end of December 2020. On January 11, COMP price bounced off the 50 SMA, after which it went up and broke above the 180.00 and 215.00 resistance level. The 180.00 could have become the support that can be potentially tested, before/if the uptrend continues. On the other hand, the price can be expected to start rising without any further downside correction.
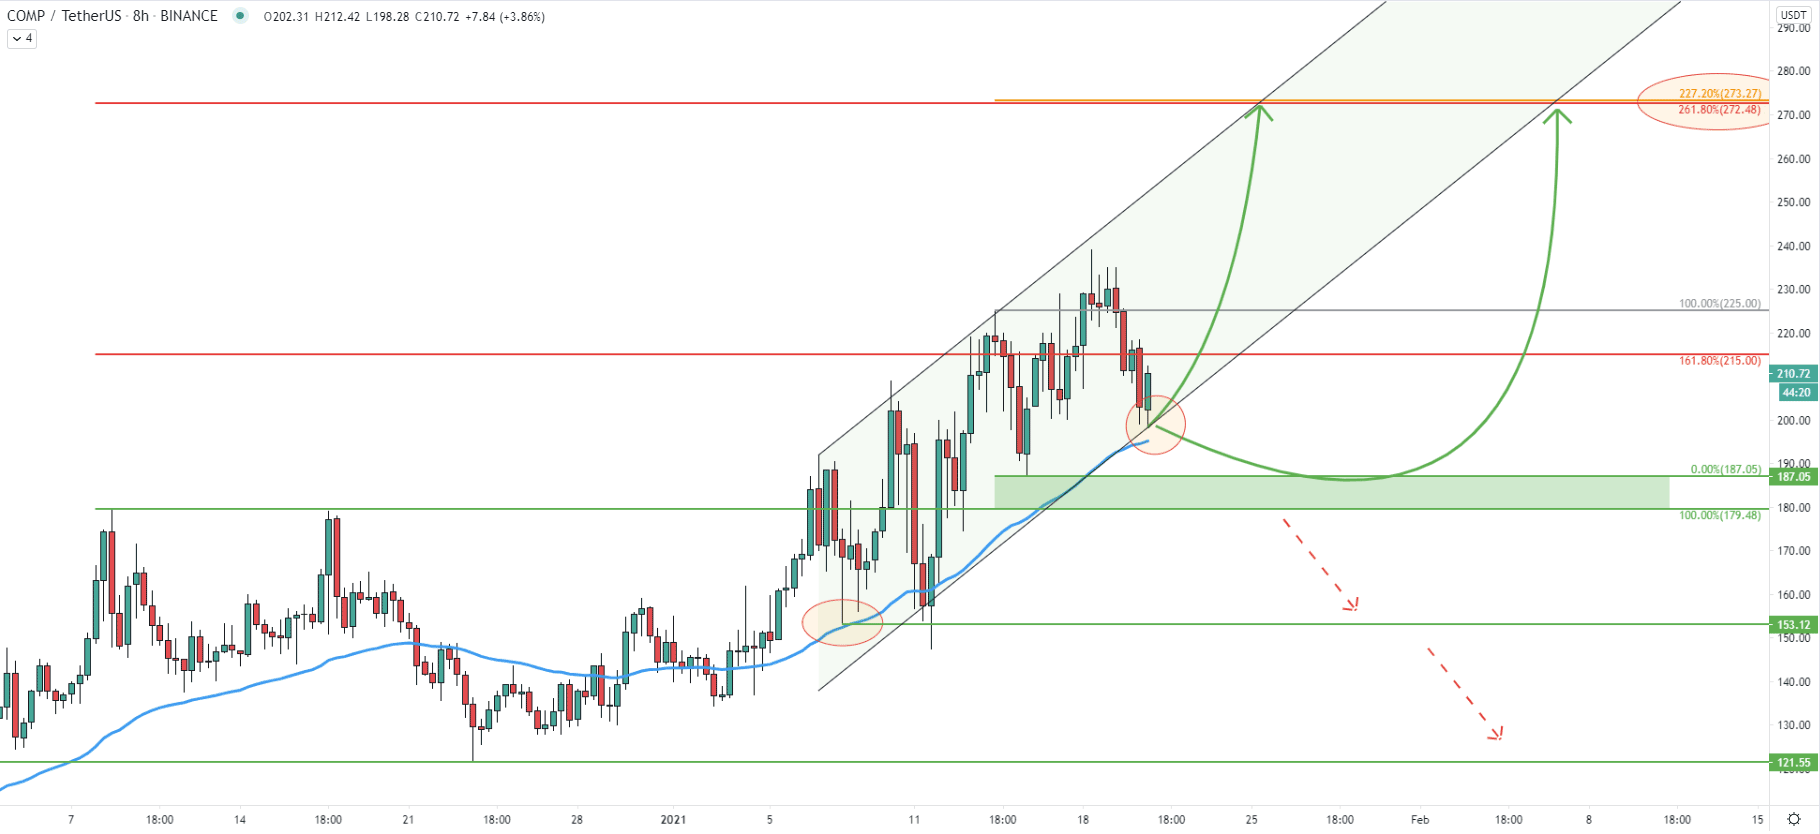
As COMP/USDT is rising, the price continues to move within the ascending channel. Today COMP has reached and rejected the bottom of the channel, which can attract buyers. Although, COMP hasn’t reached the 50 Simple Moving Average, suggesting a minor downside move to test the SMA. All-in-all, as long as the price remains above the SMA, the trend will remain strongly bullish. Break below, can initiate a consolidation phase where the price is likely to test the 180 - 190 support area. And finally, it is worth mentioning that the Fibonacci, applied to the previous correction down, shows that 227.2% retracement level corresponds exactly to the 261.8% Fibs as per the Daily chart.
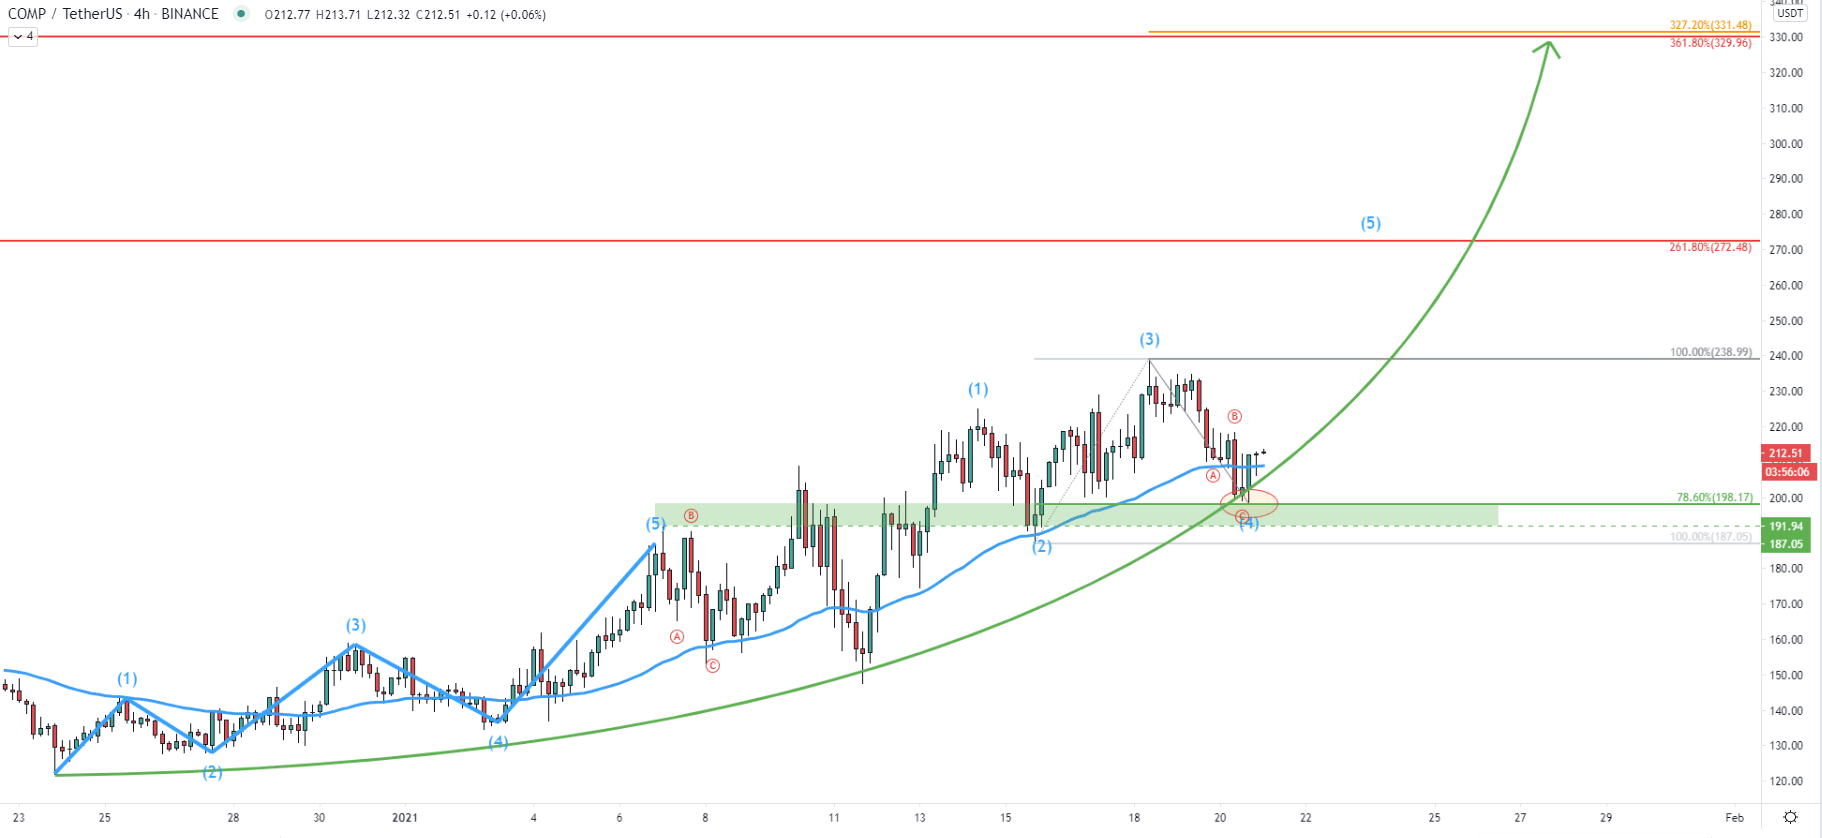
An Elliott Wave theory has been used to understand better when the uptrend continuation should be taking place. When the price has found the resistance at 238.99 level, wave 3 has been completed. Currently, COMP/USDT price is undergoing an ABC correction, which seems to have ended, or will be ending during the next 24 hours. We can also see a clean bounce off the 78.6% Fibonacci retracement level at 198.17. Certainly, a 200.00 is solid psychological support, and considering the validity of an uptrend, bulls could be starting to take action. Besides, right now price is at the previous level of resistance which now is the support.
As long as price remains above this support area, COMP/USDT can initiate an upside wave, resulting in the price increase either towards the 272.48 or 330.00 resistance area, which on this chart is confirmed by 327.2% Fibs applied to the current correction, as well as 361.8% Fibs as per the daily chart.
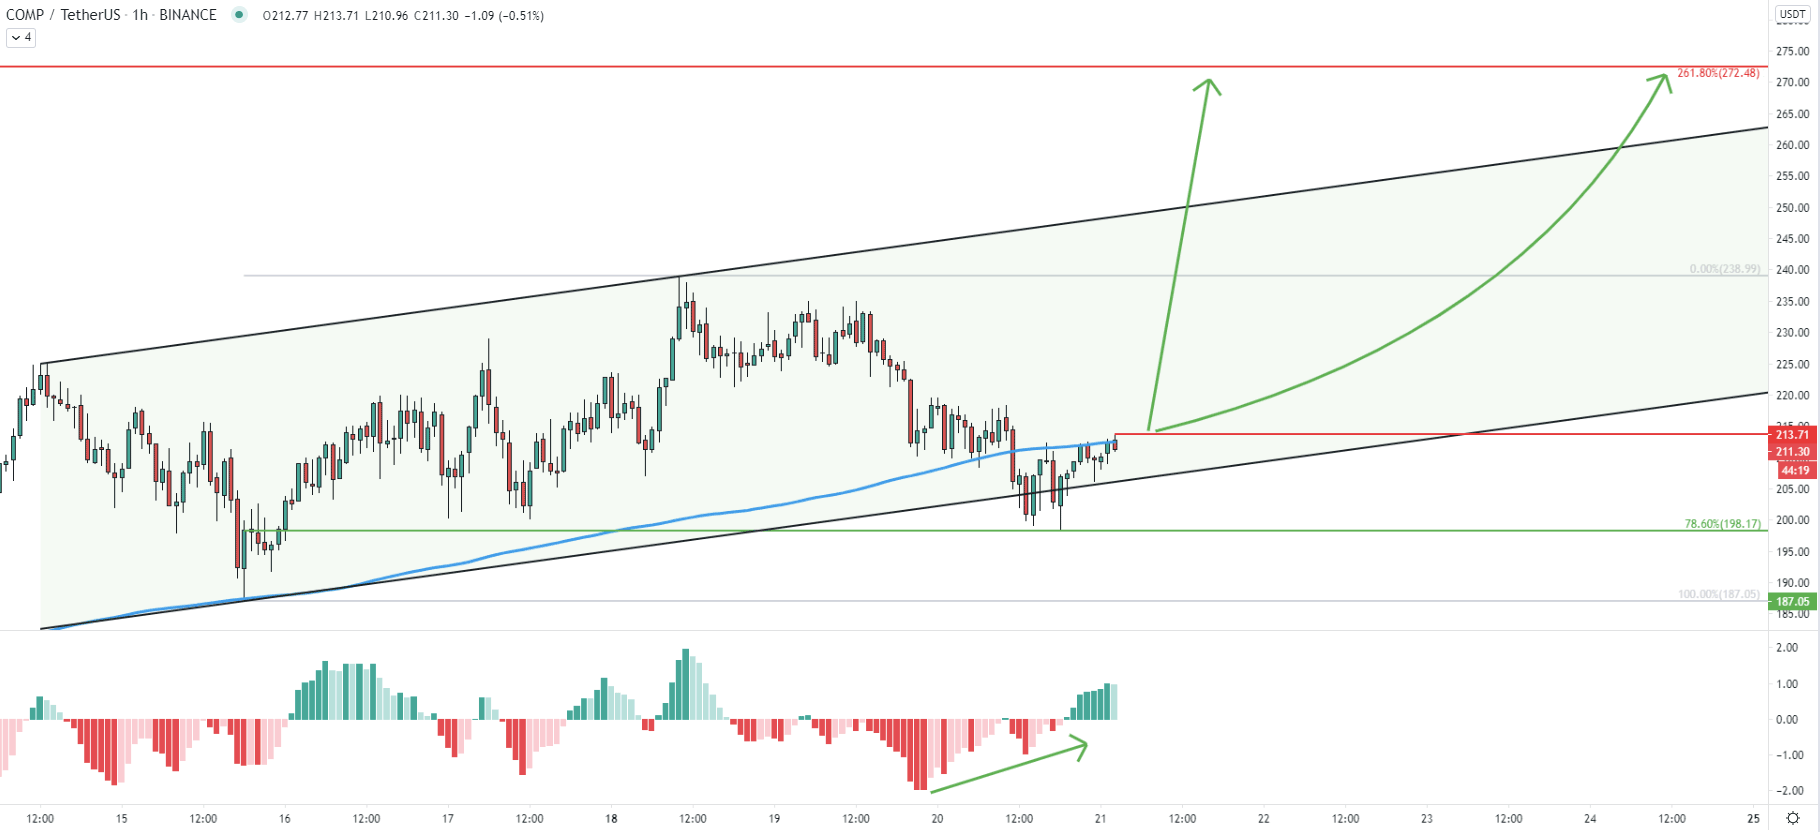
Today COMP has reached the bottom of the ascending channel while the MACD oscillator formed a bullish divergence. This implies a potential reversal to the upside, in other words, a continuation of the long-term uptrend. Nonetheless, the 200 EMA has been rejected, showing that the local resistance has been established at 213.71. It would be reasonable to assume that the buying pressure will increase only upon the hourly break and close above this resistance. Before that happens, the price is likely to consolidate and/or attempt to break below the 198.17 support.
The long term trend for the COMP/USDT is certainly bullish, and considering the price action on multiple timeframes, the probability is strongly in favor of yet another upside swing. But there is a minor obstacle in the form of the 200 EMA on the hourly chart. When/if it gets broken, volatility and volume are likely to increase, and the price might start trending up.
As per the daily, 8-hour, and 4-hour chart, there are two key resistance levels to monitor. The first is 272.48 and the second is 329.96. Both of them are confirmed by two different Fibonacci retracement levels and each of them could be the final resistance before the major downside correction.
As per the 8-hour chart, a break below the 179.48 support will immediately invalidate the bullish outlook. In such a scenario, the price can be expected to move either towards the 153.12 or even 121.55 support level.
Support: 198.17, 179.48, 153.1, 121.55
Resistance: 213.71, 238.99, 272.48, 329.96