
Published: August 17th, 2022
Coinbase reported the quarterly earnings report on 9 August 2022, where the revenue came at $808.32 million, 17% down from the $873.82 estimation.
The buying sentiment in Coinbase stock came from Asset management company BlackRock’s announcement to partner with Coinbase Global. The partnership is limited to Bitcoin, allowing institutional clients to access crypto trading through Coinbase price. Moreover, clients can manage their BTC investment and risk management using BlackRock’s software suite Aladdin.
BlackRock has more than $10 trillion in assets under management, making it a notable name in the financial world. Before partnering with Coinbase, BlackRock stepped into the crypto space in the past. The company owns 16.3% MicroStrategy, besides launching the blockchain industry ETFs.
The partnership with BlackRock was the main reason to push COIN price higher from the rectangle pattern breakout. However, the recent concern regarding the integration between Etherescan and Coinbase wallet, which was getting pushback.
Let’s see the future price direction from the Coinbase Stock (COIN) Technical analysis:
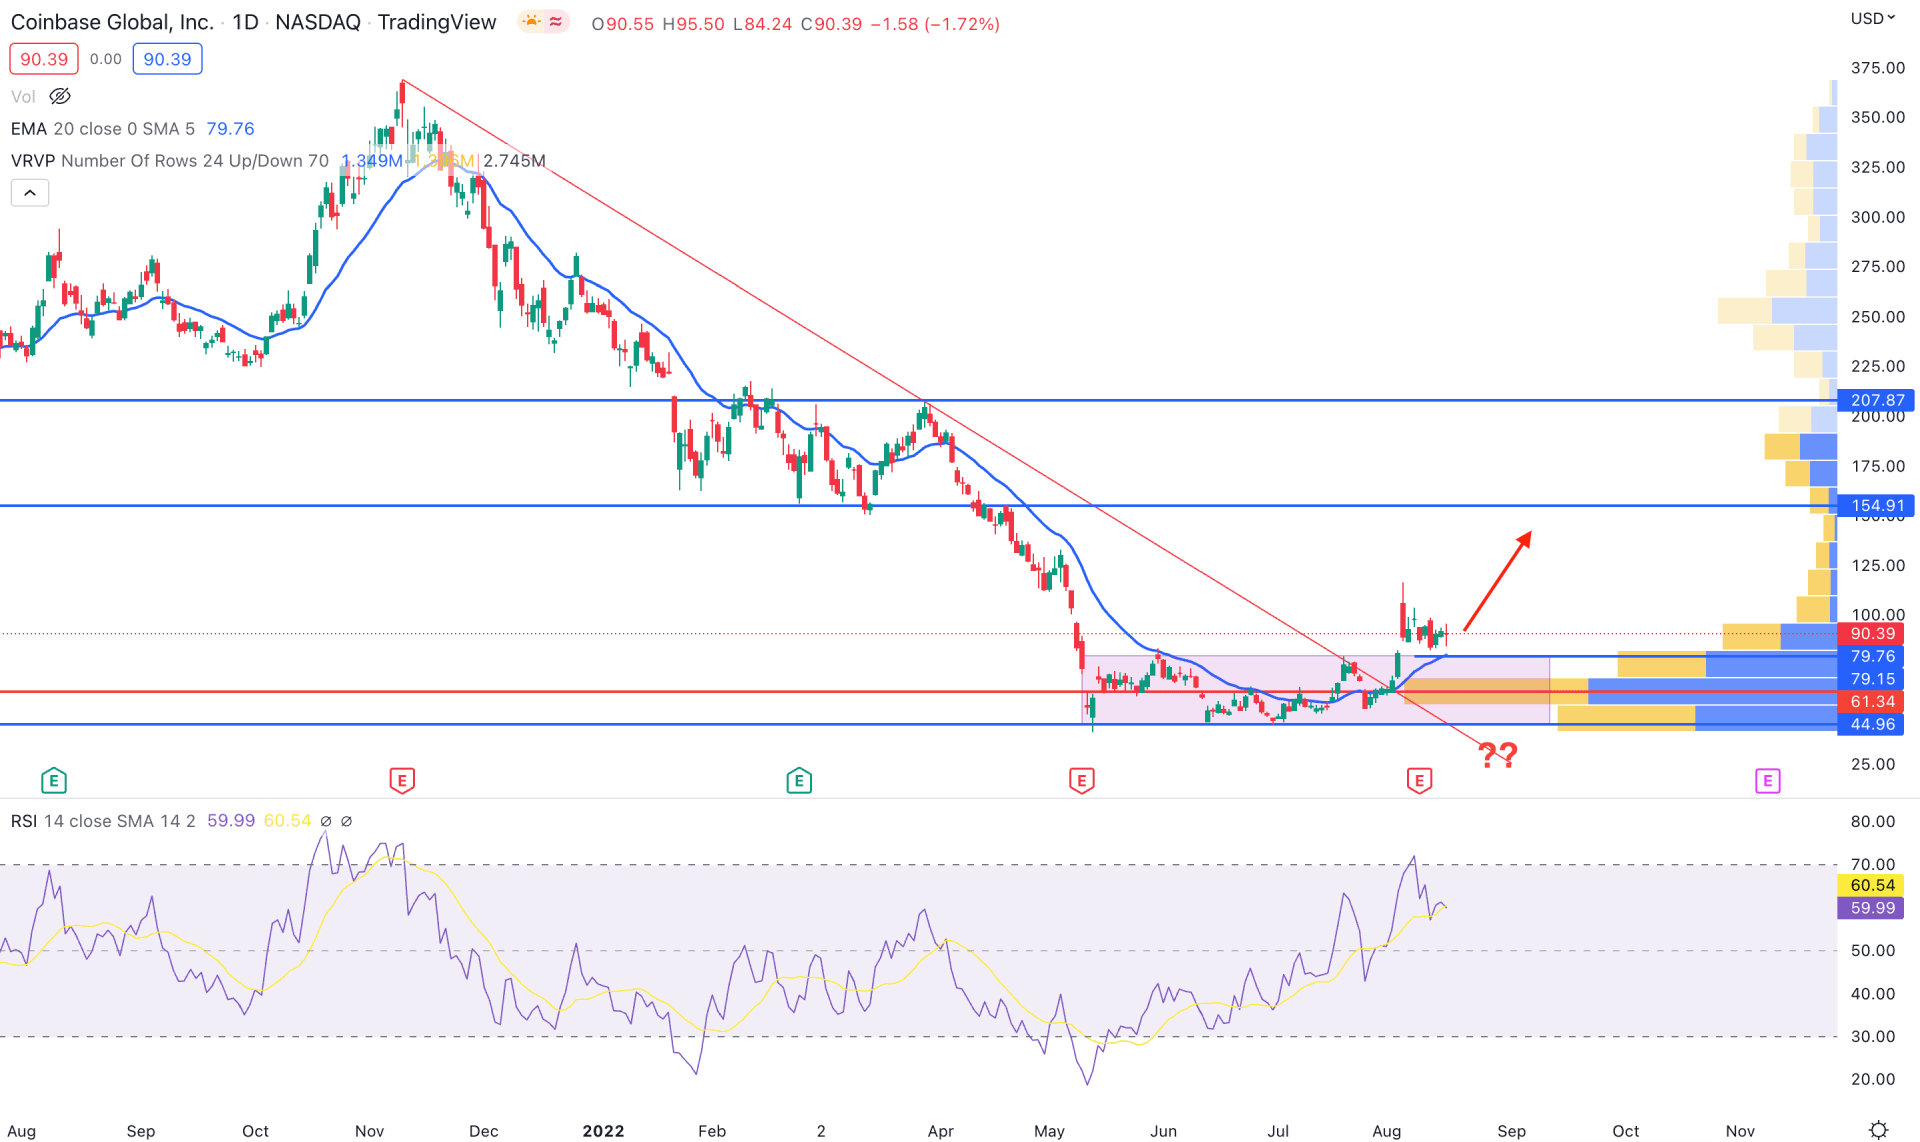
The selling pressure in Coinbase Stock (COIN) was initiated in November 2021, following the broader crypto market crash that pushed the stock to lose 87% of its value by reaching the 44.96 level.
Since the March 2022 ending quarterly earnings report, released on 11 May, the stock went sideways, ignoring the weaker-than-expected revenue. However, the buying pressure with a bullish rectangle pattern breakout appeared in recent trading days, which may be a major trend reversal.
In the indicator window, the Relative Strength Index reached the oversold 70 level, still holding its ground above the 50% neutral level. Moreover, the recent bullish breakout is backed by volume support, where the visible range volume indicator shows the highest trading volume in the last 1 year was at 61.34 level.
Based on the daily Coinbase Stock price prediction, the buying pressure may extend if bulls hold the current momentum above the 61.34 level. In that case, any bullish rejection from 90.00 to 70.66 would be a potential bullish opportunity where the main aim is to test the 145.91 resistance level.
The alternative approach is to find the price below the 44.96 rectangle pattern support, which will open a bearish possibility toward the 25.00 area.
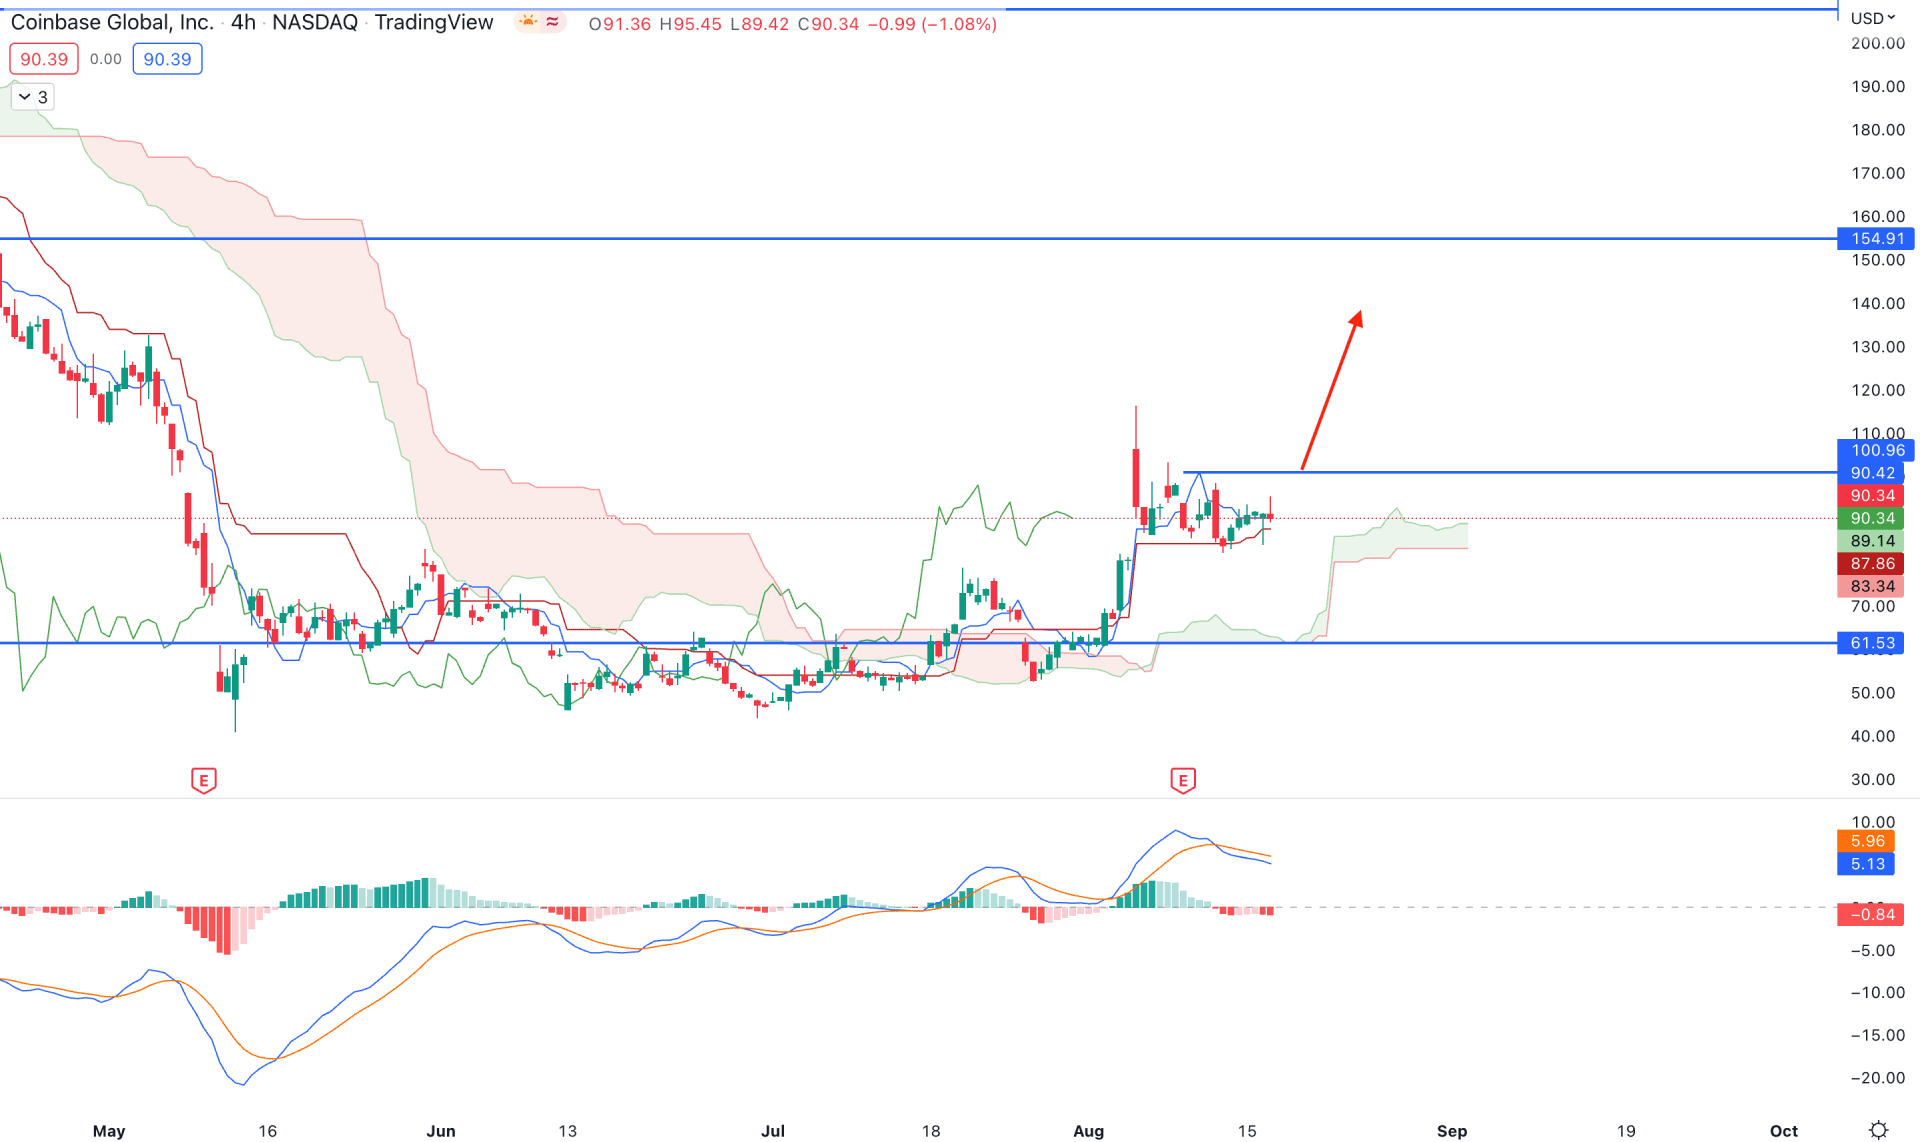
The H4 chart of Coinbase Stock (COIN) shows a clear story about the bullish breakout, where the current price is above the Kumo Cloud, backed by impulsive bullish pressure. Therefore, as long as the price remains above the 61.53 cloud support, the bullish pressure will likely extend in the coming days.
In the future cloud, Senkou Span B is flat while Senkou Span A aims higher. It is a sign that short-term buyers are active in the market with a possibility of extending the bullish momentum in the intraday chart.
MACD Histogram is bearish in the indicator window despite the corrective price action above the cloud support. The dynamic Kijun Sen is working as immediate support from where a bullish rejection appeared.
Based on this price action, investors should wait for a bullish H4 candle above the 100.00 level before going long in this instrument towards the target of 154.91. On the other hand, a bearish pressure with a H4 candle below the 61.53 level may alter the current market structure and lower the price towards the 30.00 area.
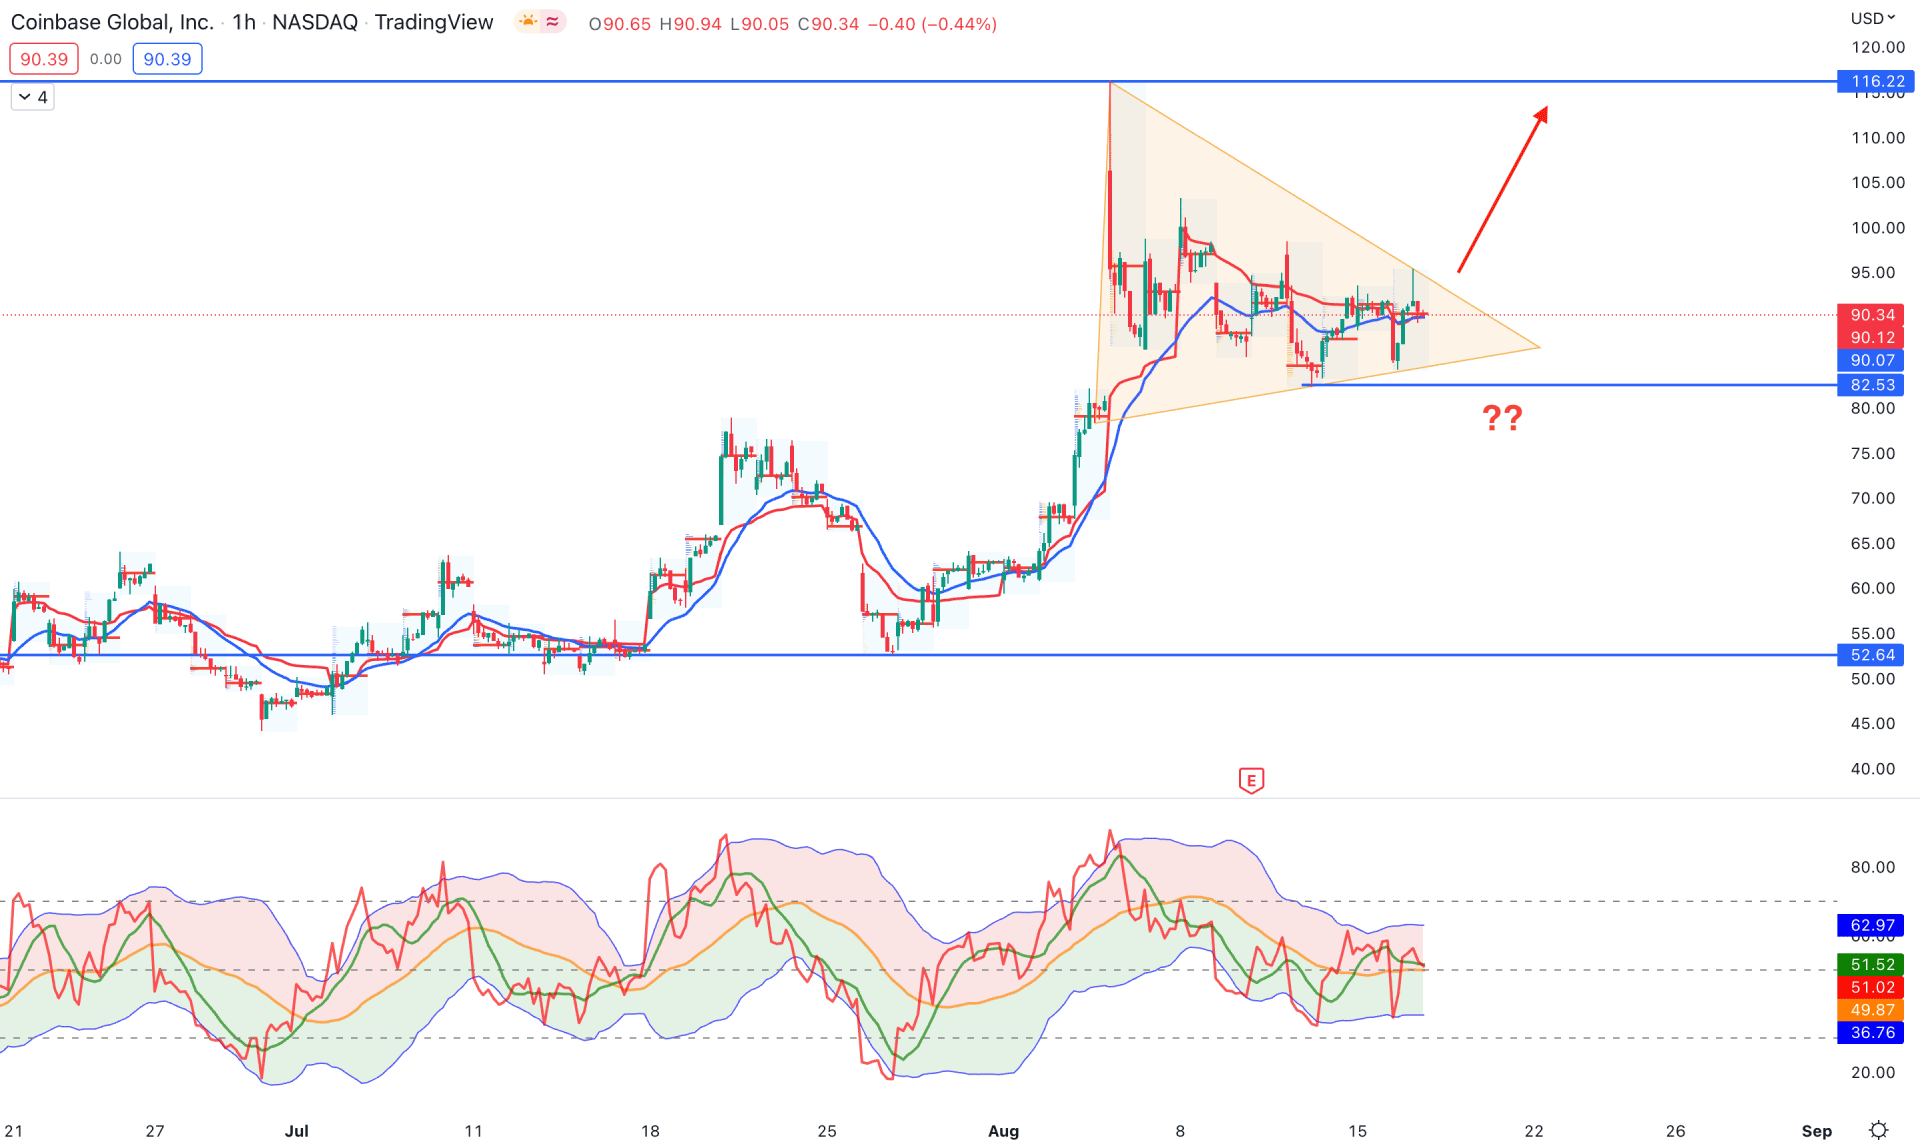
In the 1 hour chart, Coinbase Stock (COIN) faced strong bullish pressure by making a new swing high at the 116.22 level. However, the price became corrective after making the peak and trading sideways within a symmetrical triangle. Investors should monitor how the price breaks out from the triangle, where a bullish H1 candle above the triangle resistance will be the first sign of buying pressure.
The corrective price action is visible from dynamic 20 EMA and weekly VWAP that are showing violations, while the Trades Dynamic Index is corrective at a 50% level.
Based on the Coinbase Stock intraday price action, a new bullish H1 candle above the 95.00 level is needed to resume the bullish trend towards the 116.22 level. On the other hand, the break below the 82.00 level would increase the selling pressure towards the 52.64 support level.
Based on the current multi-timeframe analysis, Coinbase Stock (COIN) needs buying pressure in the intraday chart to match the daily sentiment. In that case, a bullish breakout from the H1 symmetrical triangle is more likely to continue the momentum started from the daily rectangle pattern breakout.


