
Published: April 5th, 2022
If a company can keep the EPS growth stable for a considerable time, the share price will eventually follow, which indicates that the EPS growth may work as a key price driver for a stock. For Coca-Cola Company (KO), the EPS growth is 14% a year, which is a reasonable growth rate in terms of sustainability. On the other hand, the high profit before tax and interest (PBIT) is another metric to show the strength of a company. For Coca-Cola, the stable PBIT margin over the last few years, with a growing revenue of 17% to $39 billion, is suitable for considering this stock a buy. In 2021, the adjusted EPS came 19% higher than a year ago, the $2.32 in 2021 that made the stock potential compared to the pre-COVID outlook.
In the 2021 full-year report, Coca-Cola posted a double-digit gain in revenue and earnings per share. The company reported a $38.7 billion net revenue in 2021, representing a 17.1% growth rate year over year. The first revenue generator for the company was the portfolio of 200 leading brands, and the second one was its unit case volume.
Let’s see the future price direction from the Coca-Cola Stock (KO) technical analysis.
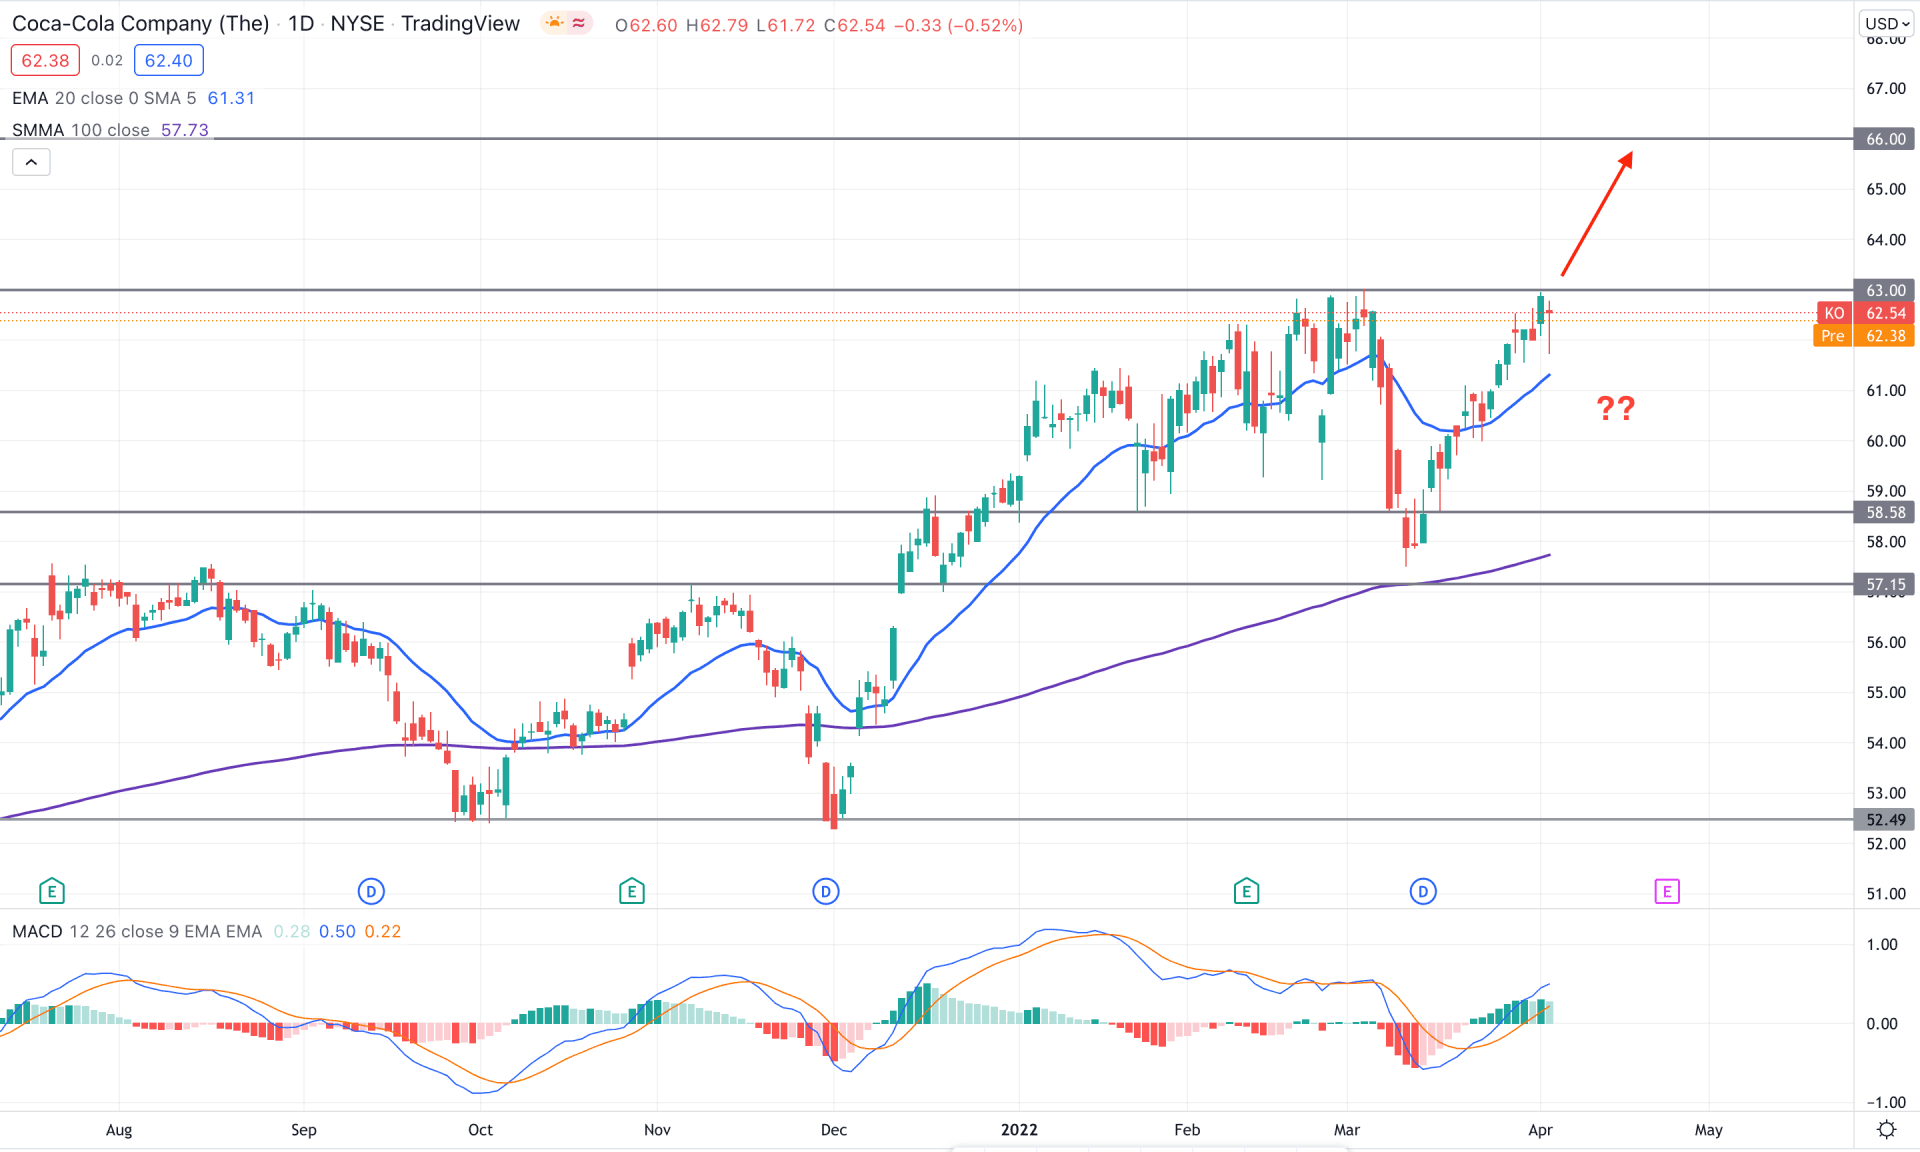
In the daily chart of Coca-Cola stock, we can see that the broader market context is bullish as the price is aiming higher above the 100 SMA by creating multiple higher highs. Moreover, the recent V-shaped recovery from the 63.00 swing high to the 57.50 swing low indicates that bulls are keen to take the price up above the 63.00 resistance level in the coming days. In that case, the buying sentiment of this instrument may see a new era where the ultimate target would be the 66.00 level.
The above image shows how the price trades at the 63.00 resistance level while the dynamic 20 EMA is below the price and working as a dynamic support. Moreover, the MACd histogram is bullish where the MACD line moved above the Histogram with no sign of divergence.
Based on the daily structure, investors should wait for a bullish breakout above the 63.00 level, where any bullish daily candle above this level would open new rooms for testing the 66.00 level in the coming days. On the other hand, the alternative approach is to wait for a strong rebound where the bearish daily close below the dynamic 20 EMA would increase the possibility of a bearish correction towards the 58.58 support level.
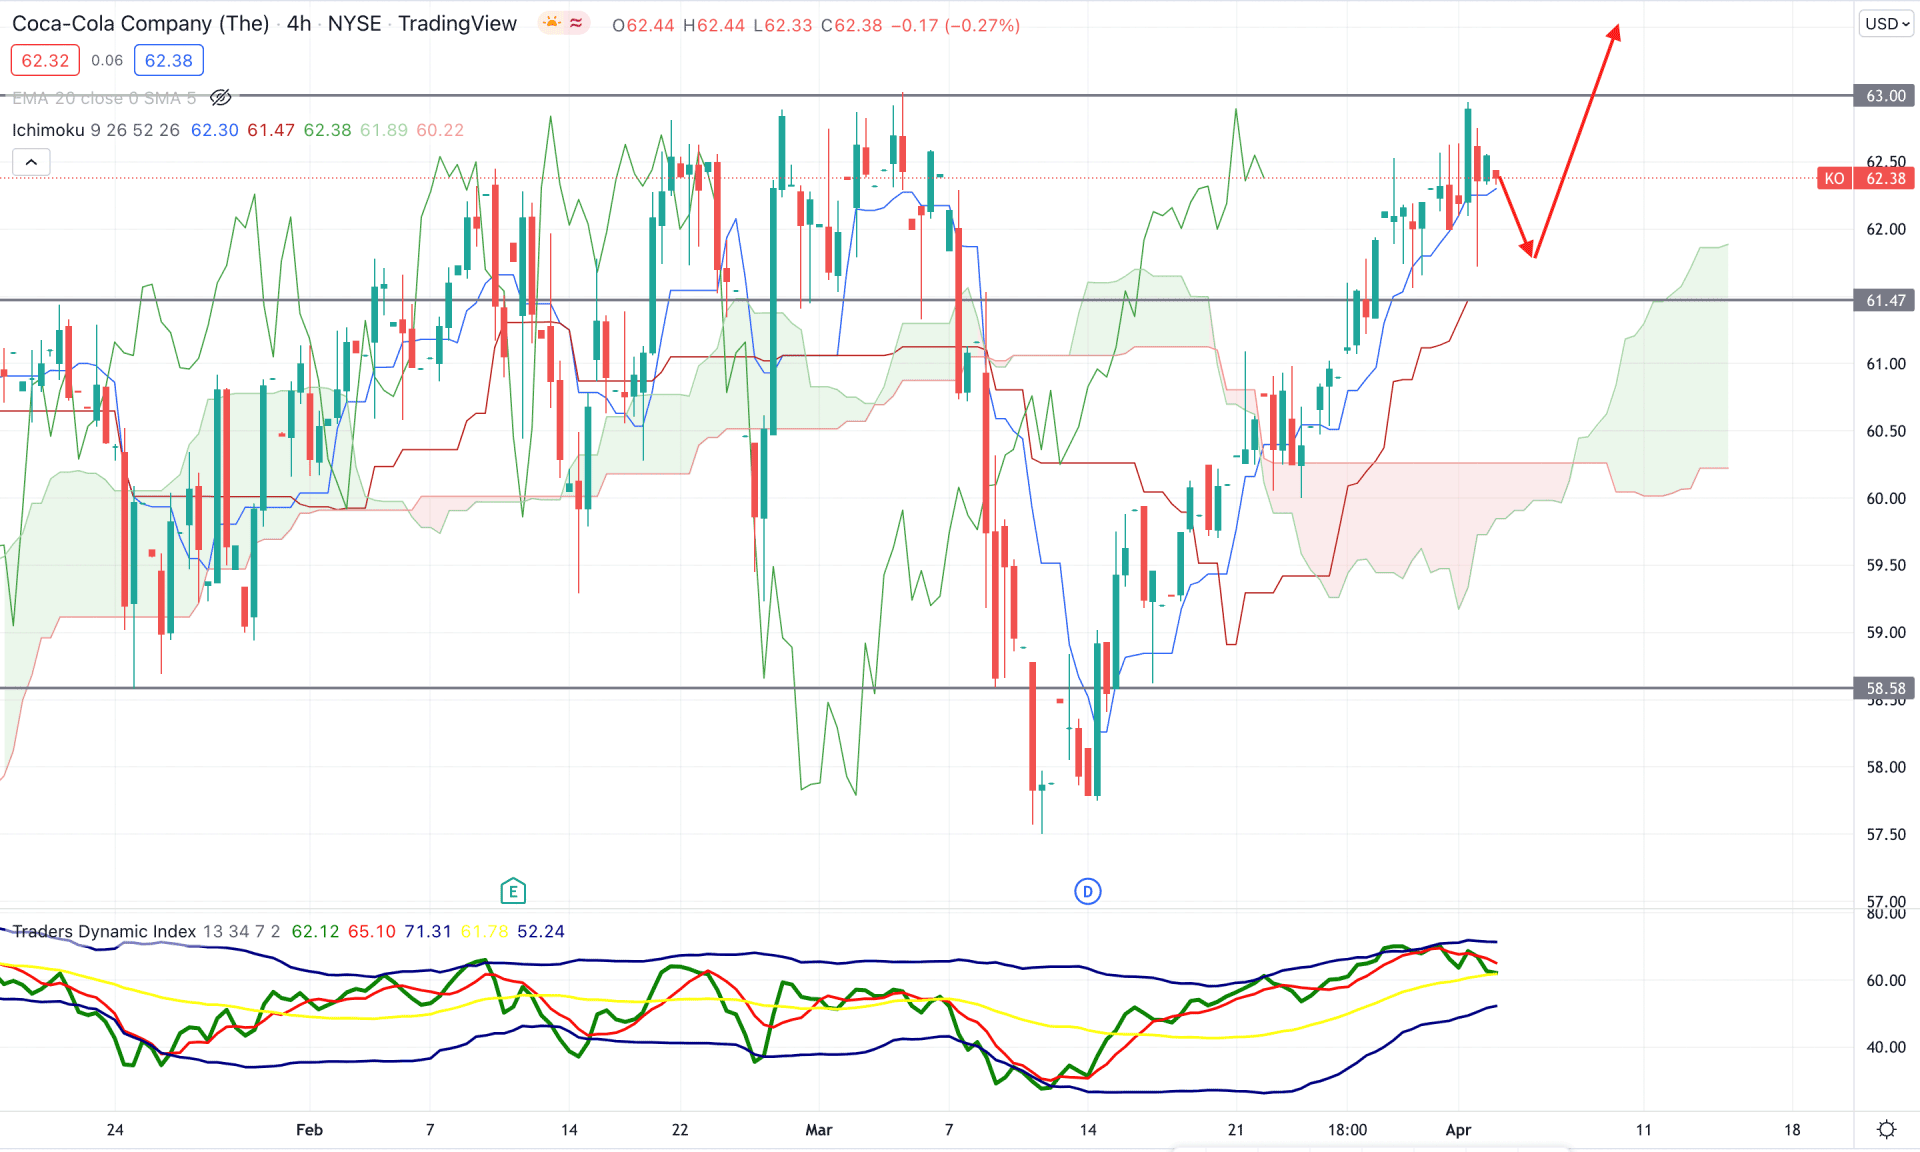
In the Ichimoku Cloud analysis, we can see that the broader market context is bullish as the recent price moved above the Cloud support with an impulsive bullish pressure. Moreover, the thickness of the future cloud is supportive for bulls where the Senkou Span A is above the Senkou Span B. Moreover, the lagging span is above the price with an upside momentum.
The above image shows how the TDI line reached the overbought limit before aiming lower, which is a sign of a possible correction in the price. Moreover, the current price showed a bullish rejection from the dynamic Tenkan Sen, where any violation of this level would increase the possibility of a bearish correction.
Based on the intraday price context, we can consider the upcoming price direction as bullish as long as it trades above the 61.47 static support level in the H4 chart. Any bullish rejection from 62.20 to 61.40 has a higher possibility of taking the price up towards the 66.00 level in the coming sessions.
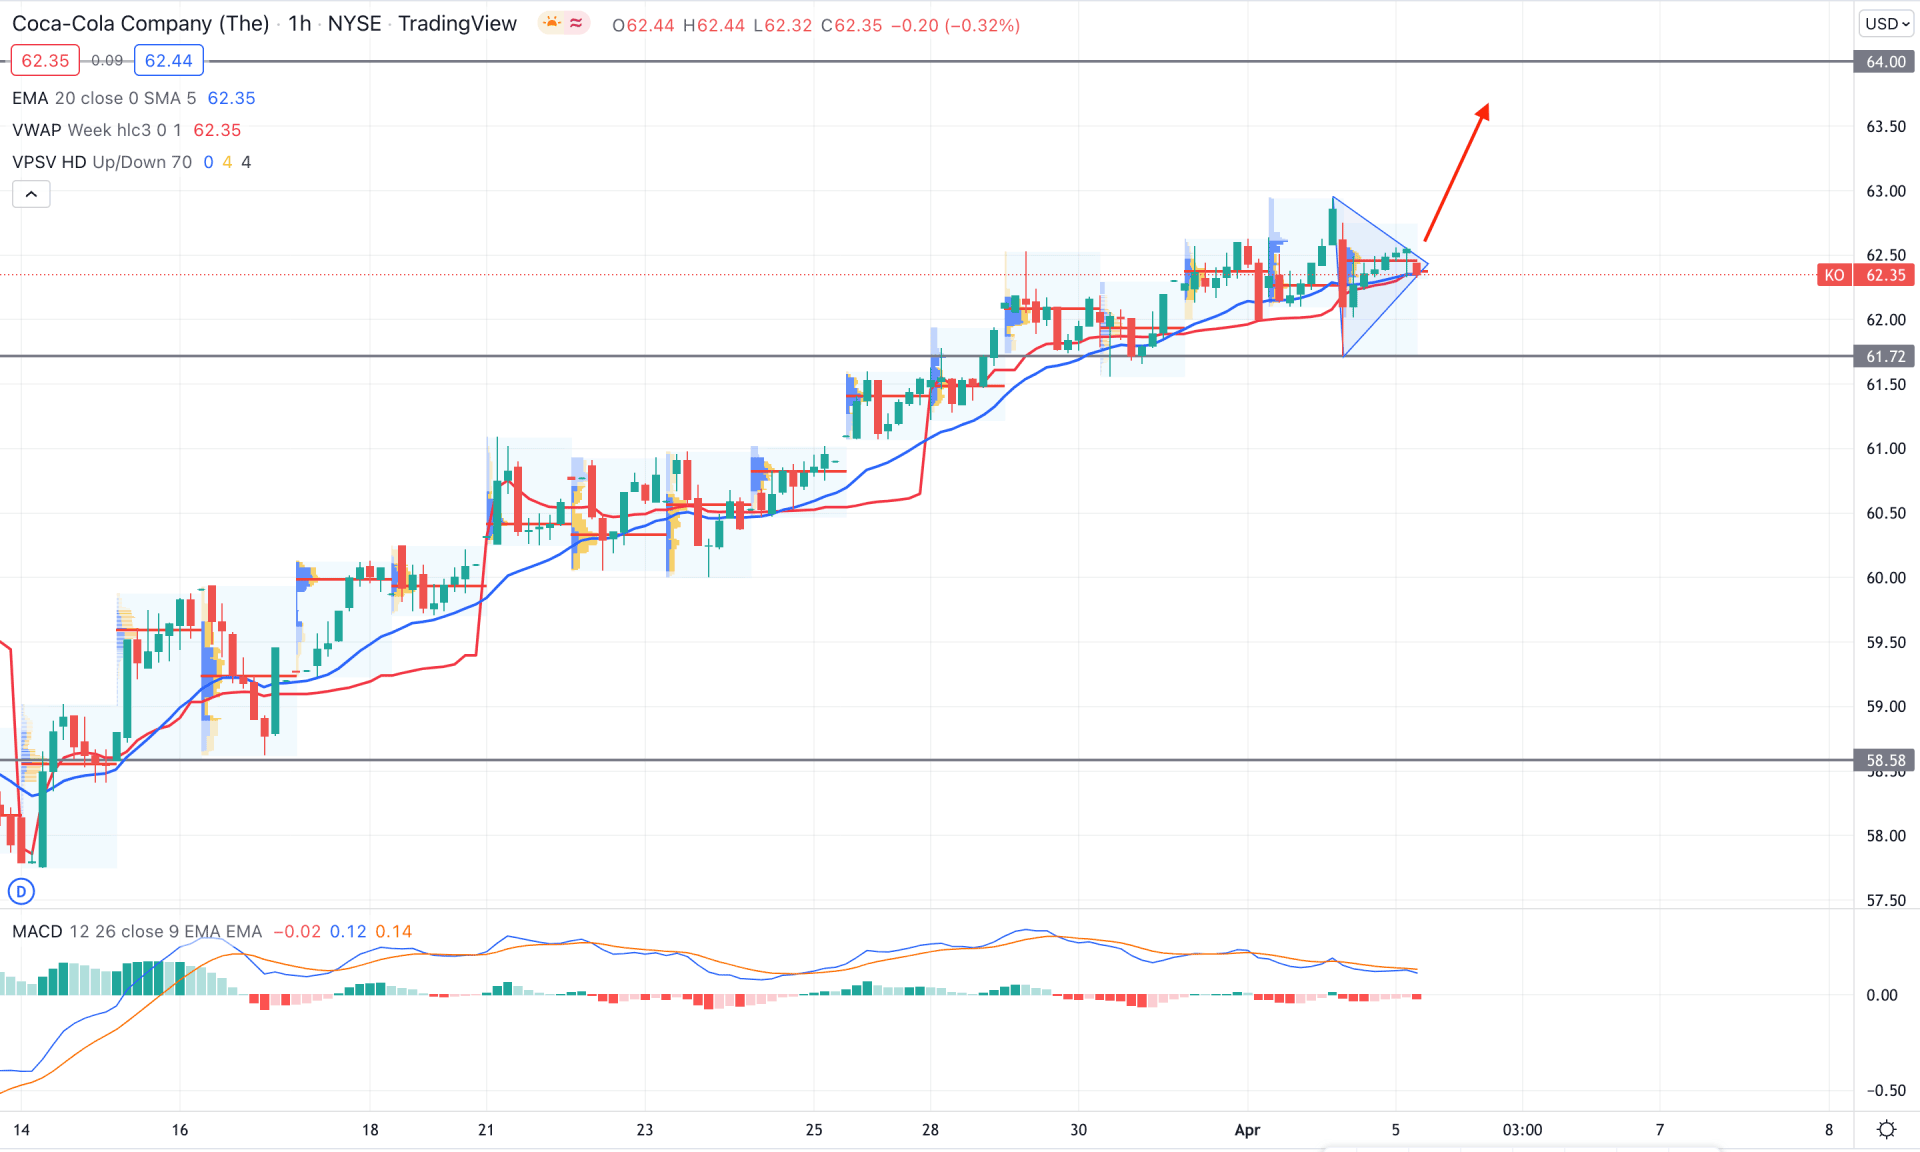
In the H1 chart, Coca-Cola Stock (KO) aims higher, while the most recent price moved higher above dynamic 20 EMA and weekly VWAP. Moreover, the most recent intraday high volume level is at 62.42, which is near the current market price. The current price is above the 61.72 static support level, which is the primary barrier for bears.
The above image shows how the price trades above the 61.72 support level while the MACD Histogram is bearish. Moreover, the MACD line is above the Histogram with a Divergence with the price. Therefore, investors should wait for a triangle breakout toward the buyers’ direction before going long in this pair. In that case, the primary target of the bull run is towards the 64.00 psychological level. On the other hand, a break below the 61.72 level with a bearish H1 close may alter the current price structure and lower the price in the coming days.
Based on the current multi-timeframe analysis, Coca-Cola Stock (KO) is more likely to move up towards the 66.00 key resistance level in the coming days. On the other hand, a break below the near term support of 61.72 level with a bearish H1 close would alter the intraday price structure that will increase the possibility of consolidation before showing another buying attempt.


