
Published: February 6th, 2025
In its next report, the biggest beverage company in the world is anticipated to disclose quarterly profits of $0.51 per share, which would indicate a +4.1% change from the previous year.
Revenues are anticipated to be $10.69 billion, a 1.5% decrease from the same quarter last year.
The current level of the quarter's consensus EPS forecast is 1.71% lower than what was predicted 30 days ago. Shareholders should be aware that the overall change might not always correspond to the trajectory of estimate adjustments made by each covered analyst.
Coca-Cola surprised everyone by +4.05% by posting earnings of $0.77 each share for the most recently reported quarter, compared to the projected $0.74.
The company has exceeded consensus EPS projections four times in the past four quarters.
Can the company maintain the growth in the upcoming quarter? Let's see the complete outlook from the KO technical analysis:
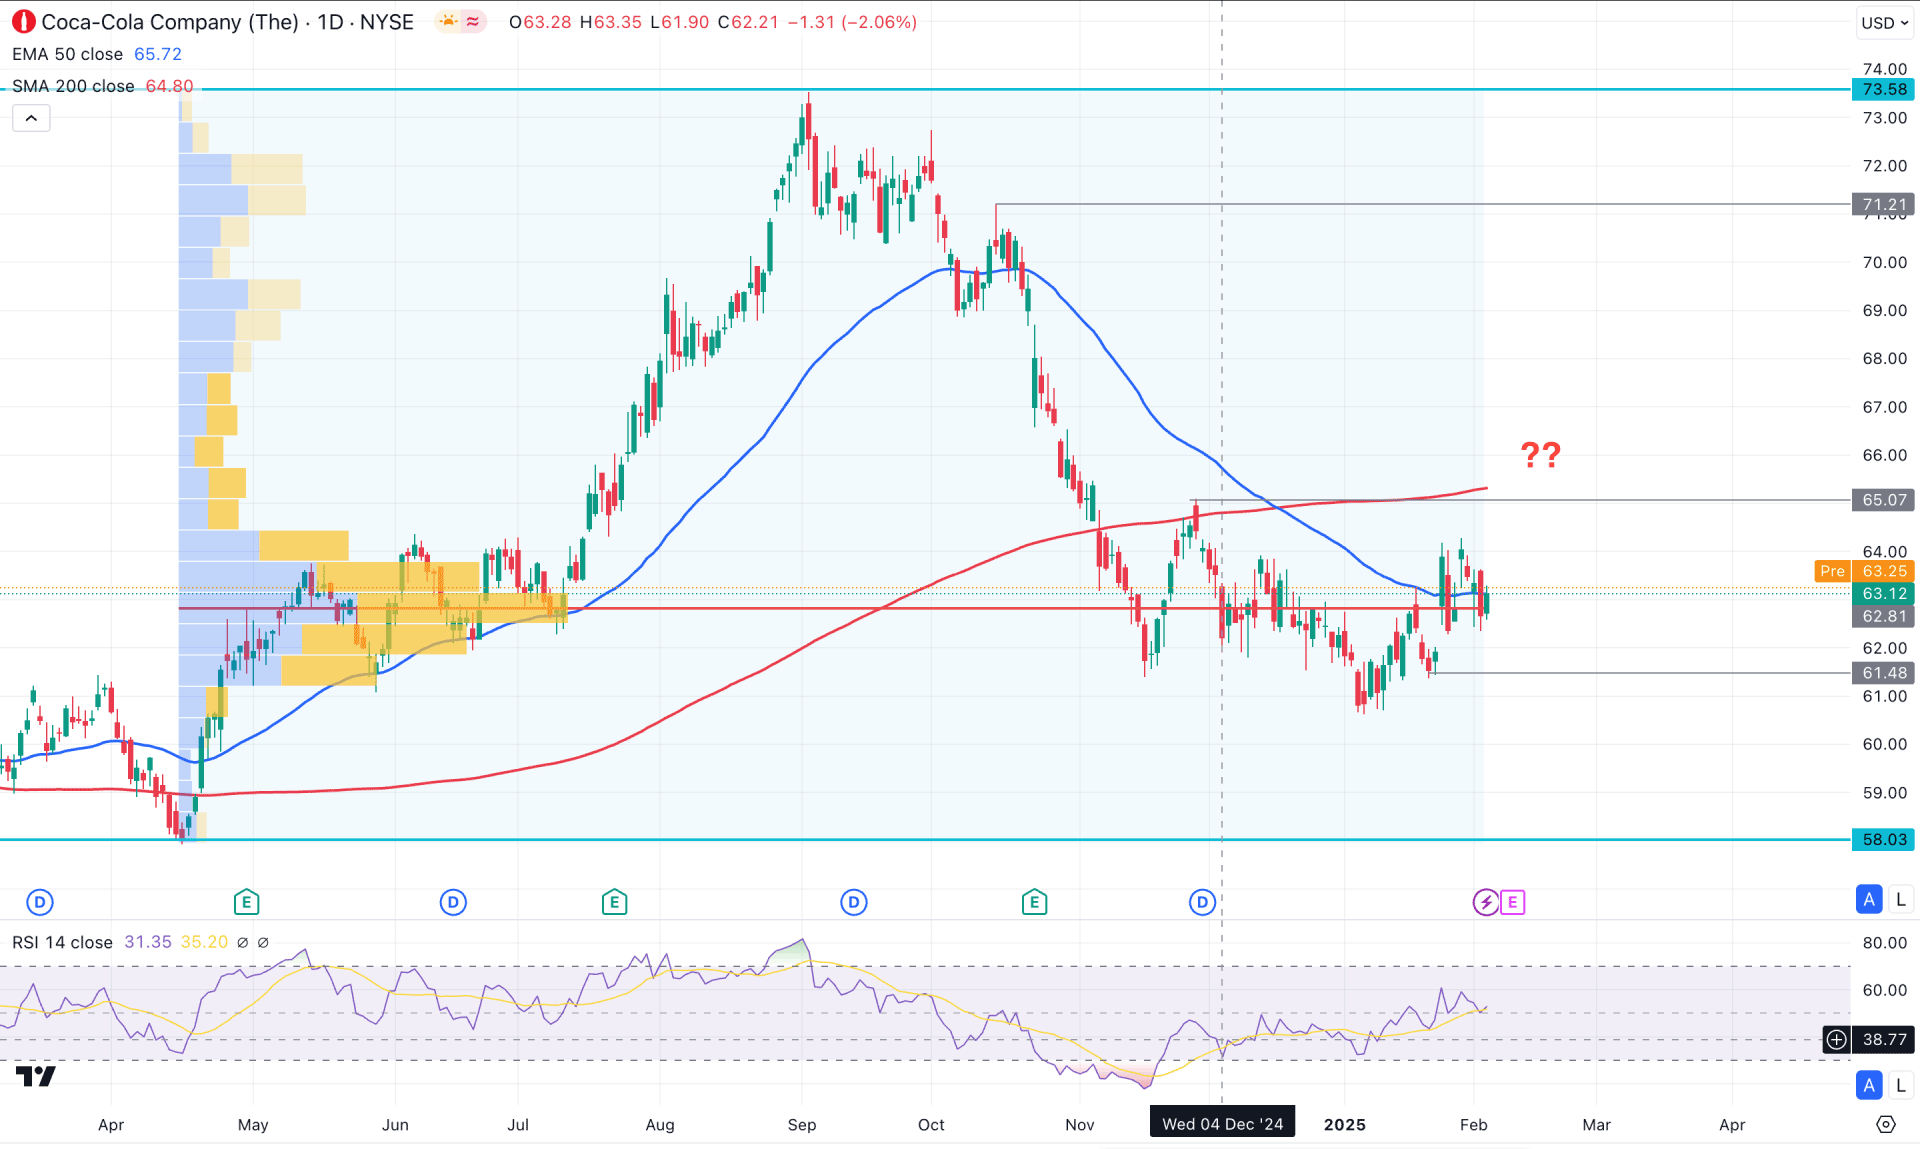
In Coca-Cola's daily chart, the ongoing price action is corrective after a long bullish wave. Although the price has reached a discounted area, no sufficient buying pressure is present. Moreover, crucial dynamic levels are above the current price and work as a barrier to bulls.
In the volume structure, a high volume area is spotted near the current price, which signals the order-building phase. The main anticipation from this price action is to wait for a breakout before finding a stable train.
In the main price chart, the 200-day Simple Moving Average is above the current price and working as a major resistance. Moreover, the 50-day Exponential Moving Average is crossed below the 200-day SMA, signaling the death cross formation. The ideal trading approach in the Death Cross pattern is to look for short trades from the near-term resistance area.
On the other hand, the 14-day relative strength index tells a different story. After forming a deeper corrective towards the oversold level, it is above the 50.00 neutral area. Primarily, this is a sign of a bullish continuation that might extend until the RSI reaches above the 70.00 area.
Based on the current rental market structure, Coca-Cola stock is more likely to find pressure to overcome the near-term resistance area. However, any immediate bullish price action with a stable market above the 65.07 high could signal a potential market reversal.
On the bullish side, the immediate resistance is at the 70.00 level, which needs to be overcome before moving above the 73.58 area.
On the other hand, the ongoing ascending channel signals a corrective upward pressure from where valid bearish H4 close below the 64.48 level might resume the downside pressure towards the 58.00 area.
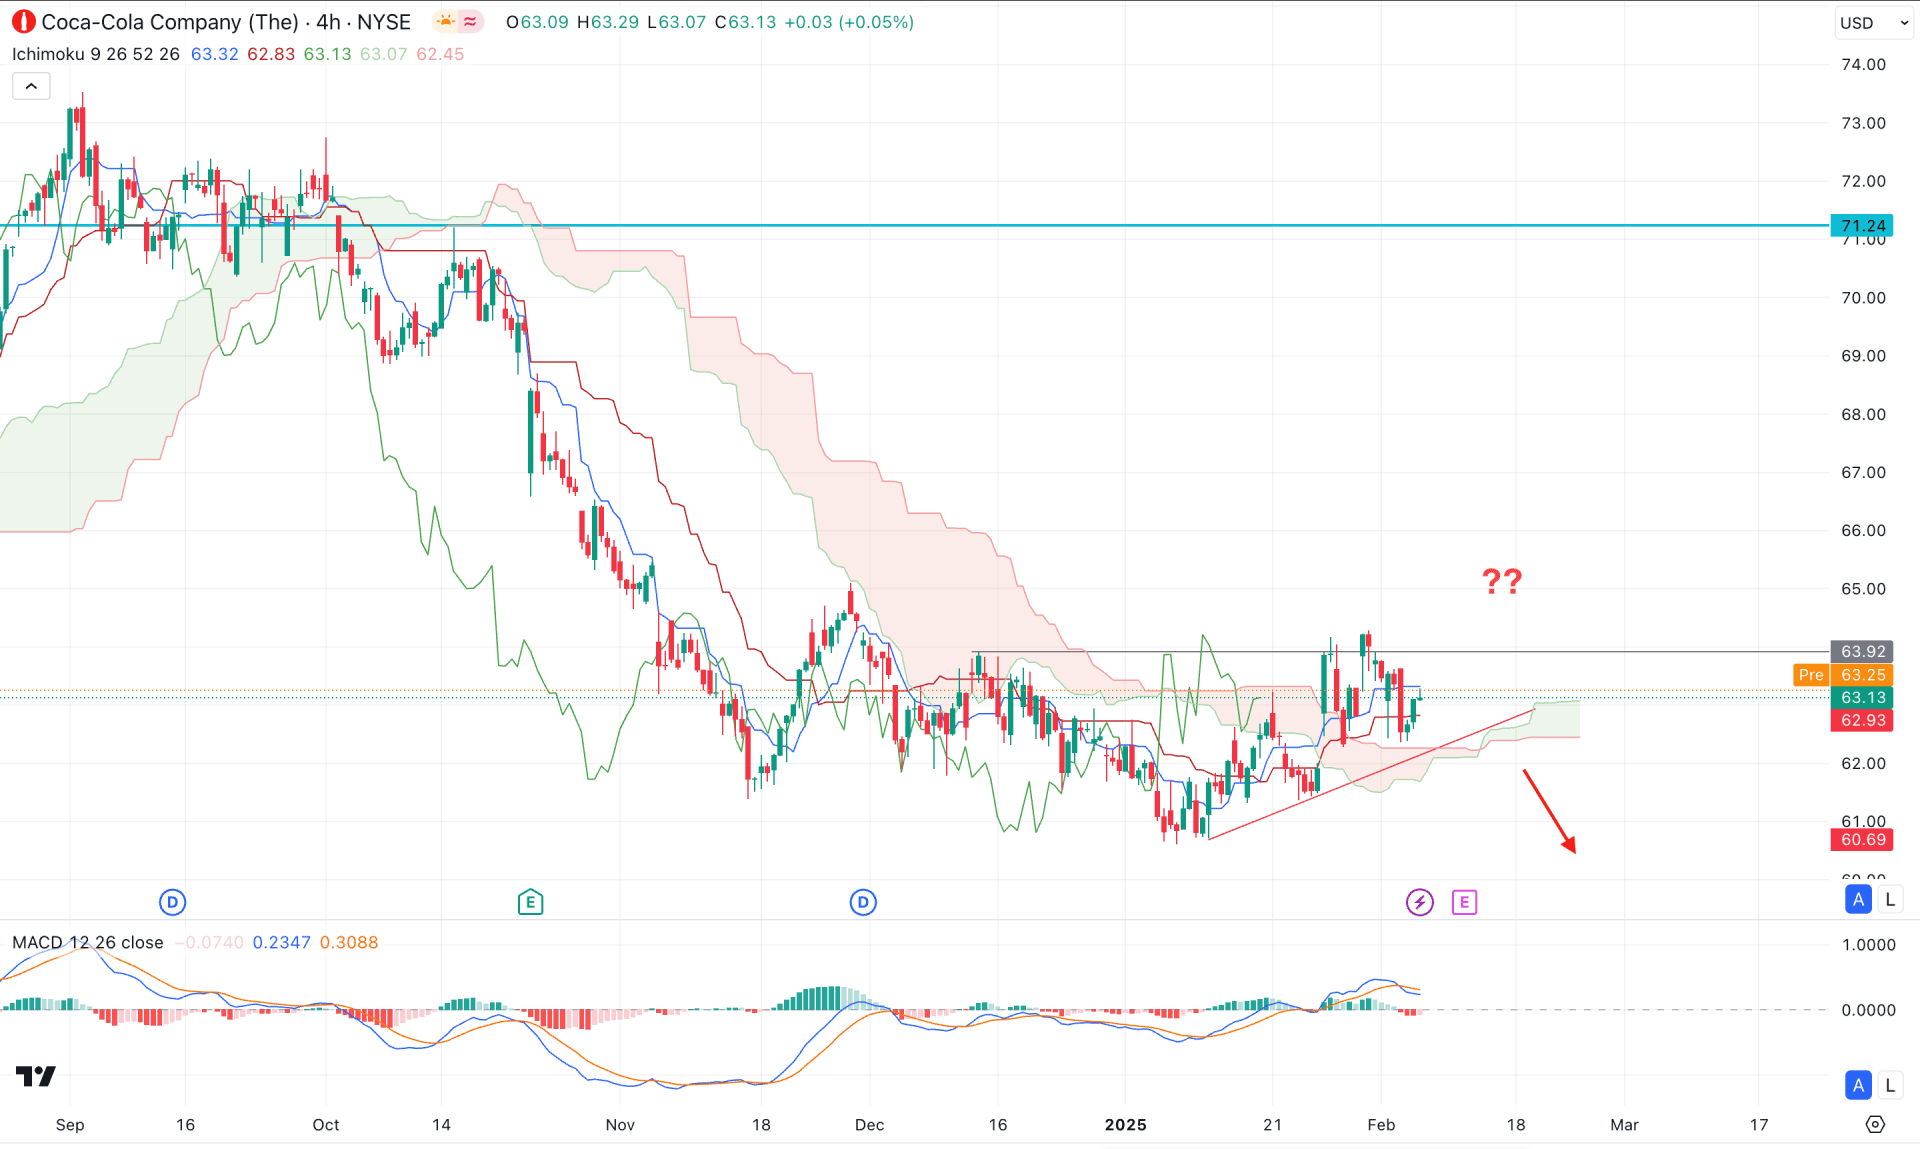
In the H4 timeframe, the Coca-Cola stock is trading within a prolonged selling pressure. However, the most recent price shows a sideways momentum at the bottom with an unstable price above the Ichimoku Cloud support. As the cloud breakout is not strong, investors should monitor how the price reacts in this area, before anticipating a trend.
In the Future's Cloud, both lines are heading up or signaling a medium-term buying pressure in the market. However, the price failed to form a significant high above the 63.92 swing level with an immediate recovery below the Kijun Sen support.
The indicator window shows a bearish signal in the MACD, where the signal line forms a crossover at the top.
Based on this outlook, the primary aim for this pair is to wait for a trendline breakout with an H4 candle below the 62.00 level. In that case, the ongoing bearish continuation might extend, taking the price below the 50.00 level.
On the other hand, there are several significant resistance levels that prices need to recover. Primarily overcoming the 65.00 line with an upbeat earnings report could increase the possibility of moving beyond a 70.00 level.
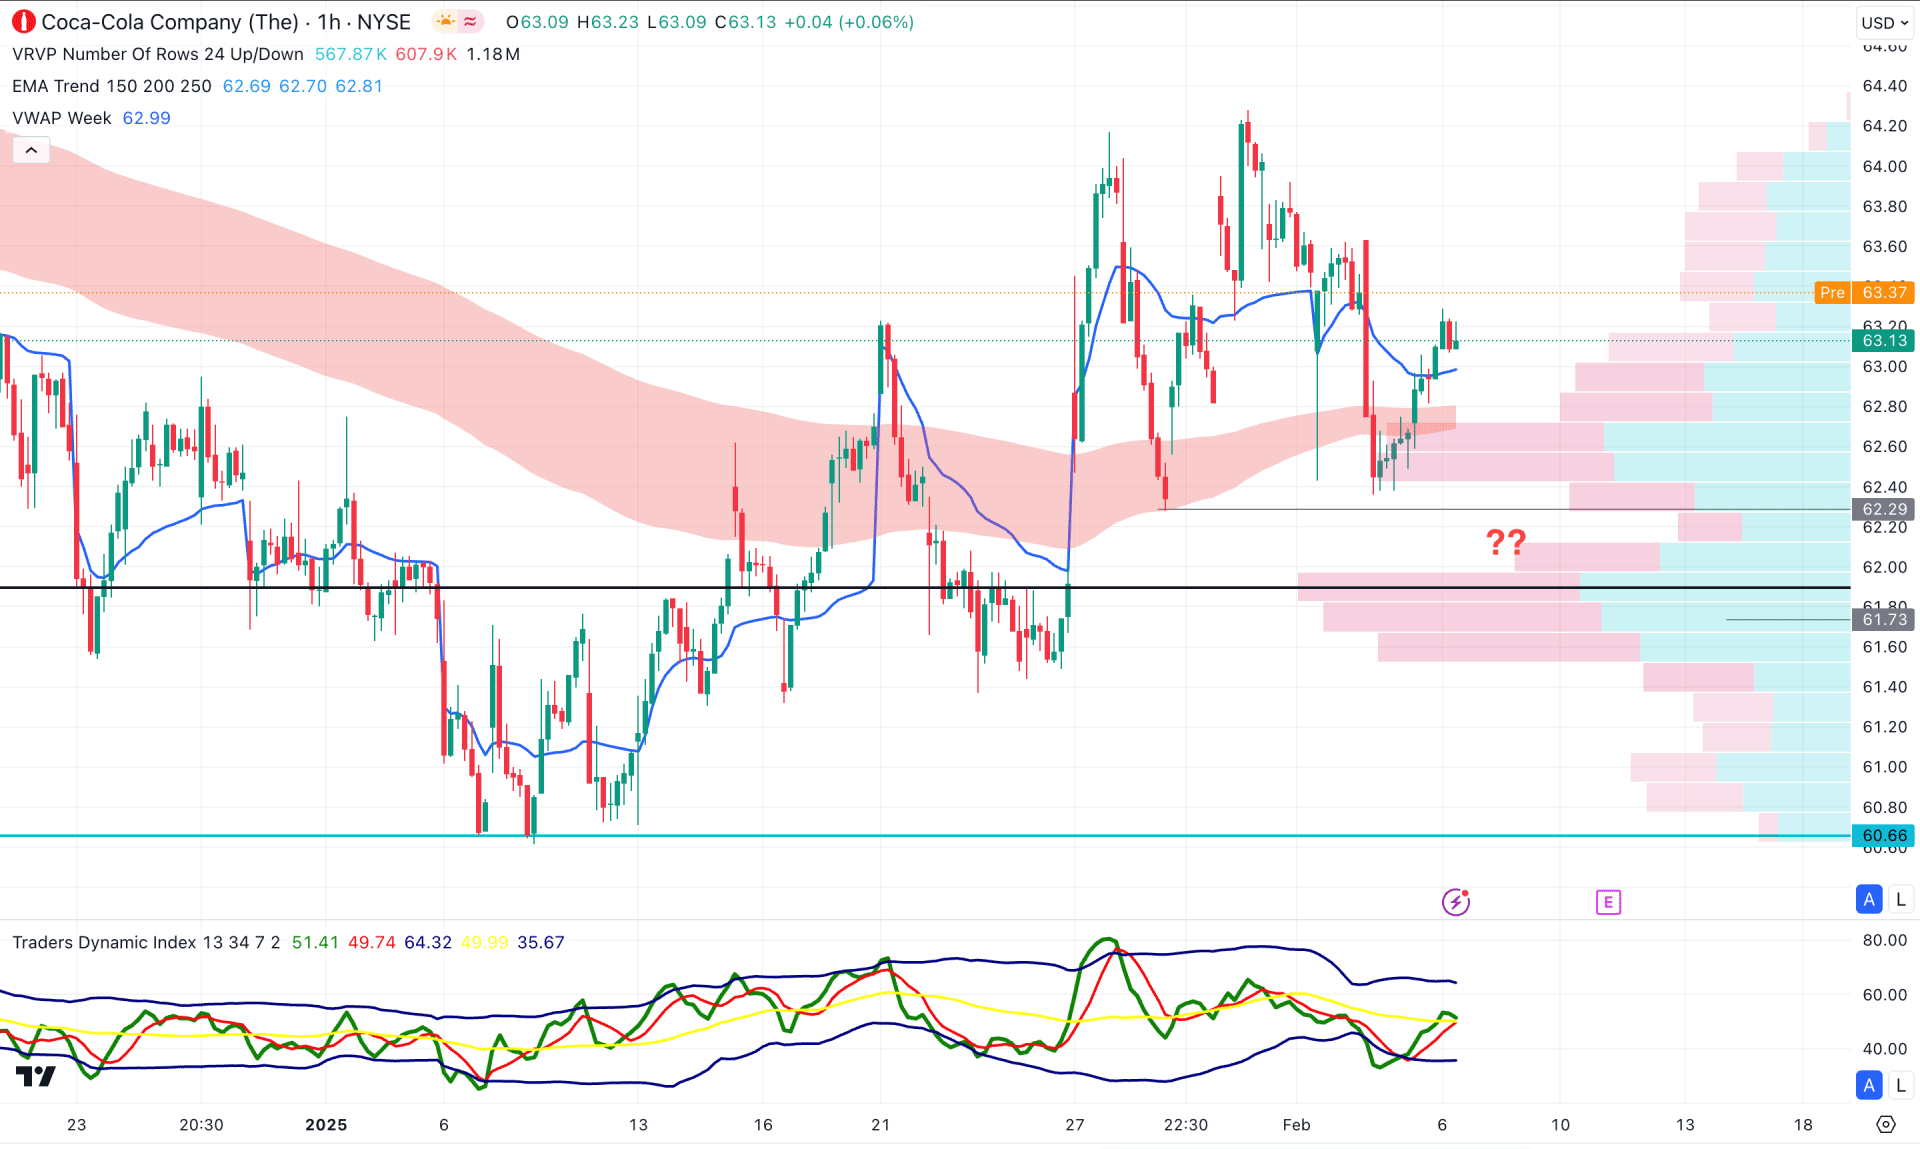
In the hourly time frame, the Coca Cola stock is facing an intraday buying pressure as the high volume line is below the current price. Moreover, the Moving Average wave is below the current price and acting as an immediate support.
In the indicator window, a bullish recovery is visible as the TDI line recovered and formed a stable position above the 50.00 neutral line.
Based on this outlook, investors should monitor how the price reacts in the current area. As long as the dynamic weekly VWAP is below the current price, bulls are likely to show dominance in the market.
On the bullish side, the immediate resistance to look at is the 64.40 level. Overcoming this swing point could extend the buying pressure above the 70.00 psychological area.
On the other hand, a selling pressure is likely to appear if the price comes below the 61.95 high volume line.
Based on the current scenario, investors need a solid reason from the fundamental perspective before opening a long position. On the other hand, KO still holds a stable position in value stocks, which might attract long-term investors to join from a dip.


