
Published: December 28th, 2022
Cloudflare makes the internet safer and faster. Its global cloud platform improves corporate software's infrastructure, performance, and security. Meanwhile, it frees customers from the expensive burden of maintaining their network hardware.
Its network directly connects with the public cloud, every major enterprise, and internet service provider, allowing it to deliver content to 95% of global Internet users within 50 milliseconds.
Not astonishing that the company is growing at a rapid clip. Over the past year, the customer count reached 156,000 jumping 18%. The average customer spent 24% more, evidencing the stickiness of its platform. As a result, Q3 revenue jumped by 47% to $254 million, and the company reported positive cash of $43 million from operations, up from a $7 million loss in the same period last year.
Inclination to the future, Cloudflare is well-positioned to create value for patient shareholders and has only scratched the surface of its $115 billion market opportunity. Cloudflare achieved a $1 billion annual revenue run rate in Q3, and management says by 2027, that figure will rise fivefold to $5 billion. It implies a 38% annualized revenue growth over the following five years.
In the meantime, shares trade at 18.4 times sales, a bargain compared to the 41.7 times sales three-year average, which is a sign of a strong bullish possibility in this instrument.
Let’s see the future price direction from the Cloudflare Stock (NET) technical analysis:
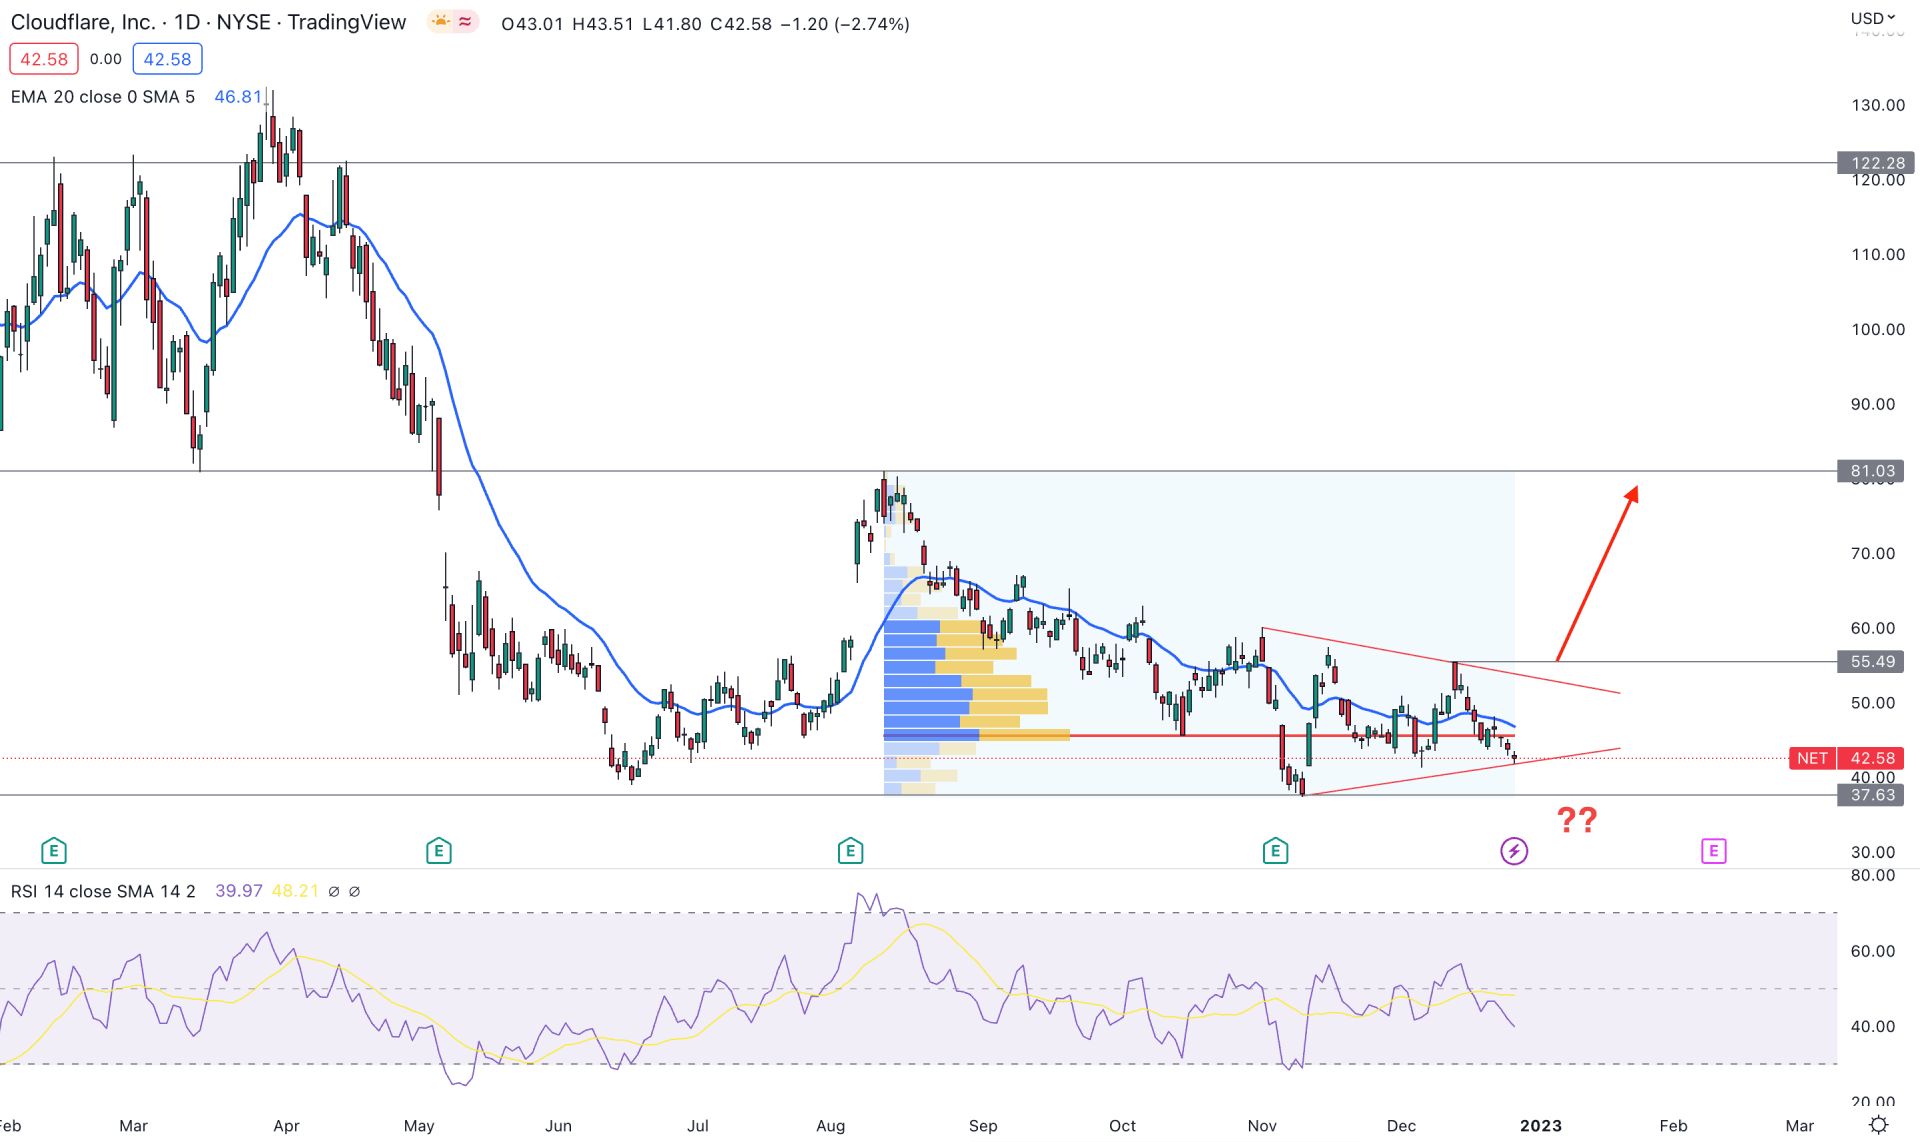
In the daily chart of Cloudflare Inc stock (NET), the broader outlook is bearish in the present timeframe. The stock is currently trading at 68% down from the yearly high, where any bullish opportunity from the discounted price could be a great source to make money.
If we look from left to right, the NET daily price is moving down, whereas the near-term bearish Quasimodo is at the 81.03 level. Therefore, the 81.03 level would be the top of the current trading range but on the downside, there is no solid bottom. In that case, the broader outlook for this instrument will be bearish until a new swing high forms.
Based on the fixed range high volume level the latest high activity area is found at 42.34, which is just above the current price. As the selling pressure is still present below the high volume level, investors should seek a bullish breakout above this level before opening a long position.
On the other hand, the current price is trading within a triangle, where a breakout is needed before forming a trend trading opportunity. The dynamic 20 DMA is still above the price, while the RSI is bearish below the neutral 50% level.
In this price behavior, a strong buying opportunity is present if a bullish daily candle appears above the triangle resistance. In that case, the upside pressure could take the price higher towards the 81.03 resistance level, with a 48% gain.
On the other hand, the lower limit for the bullish possibility is the 37.63 support level. If a bearish daily candle appears below this level, the bearish trend continuation opportunity could lower the price in the coming days.
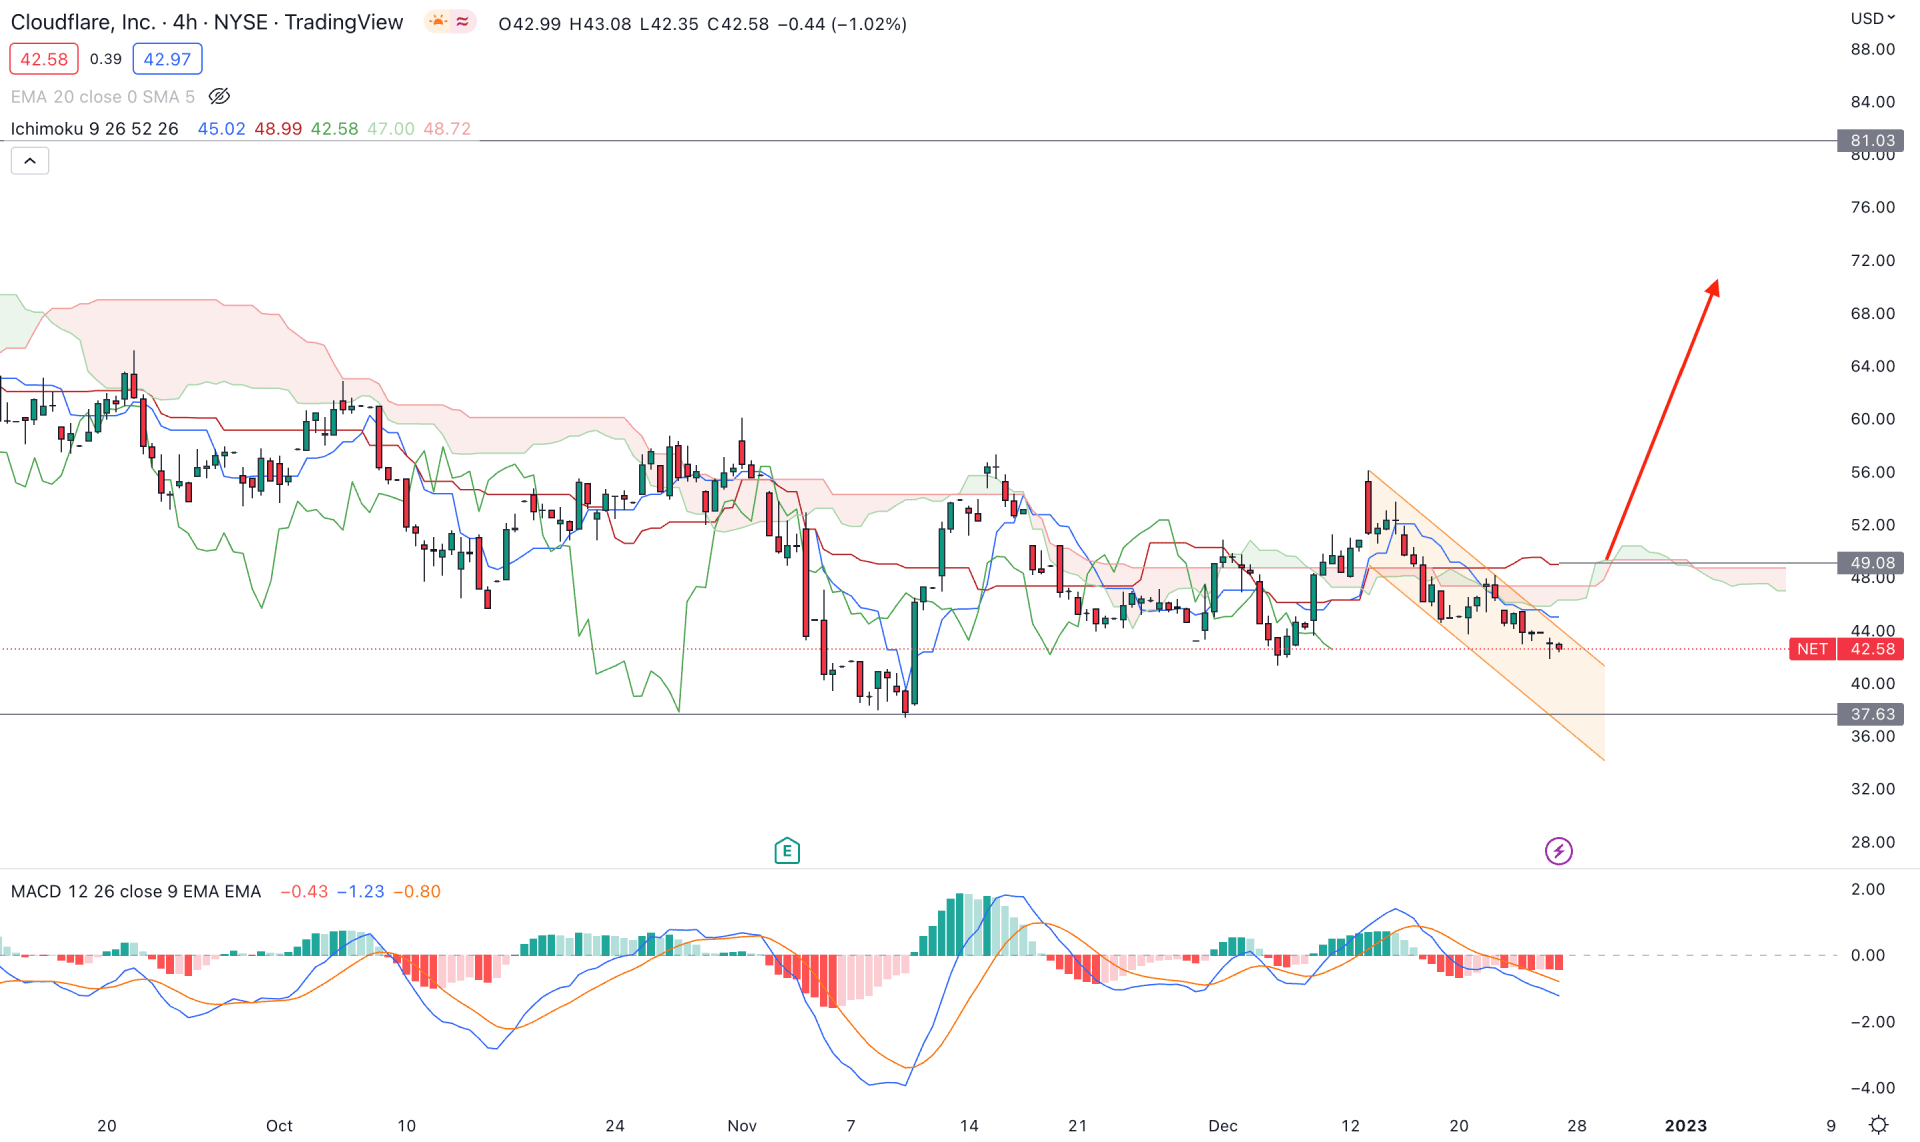
In the H4 timeframe, the broader outlook for the Cloudflare stock is bearish as it is trading below the Ichimoku Kumo Cloud. Therefore, any bearish trend continuation opportunity from the near-term resistance level would be a trading opportunity in this pair.
The future cloud of the Ichimoku Indicator shows that the Senkou Span A is below the Senkou Span A, which is also a bearish signal. However, the recent channel formation with a bearish momentum indicates that the selling pressure is becoming weaker.
In the indicator window, the MACD Histogram is still bearish, where the current MACD Histogram is bearish below the neutral zero level. Moreover, the dynamic Tenkan Sen and Kijun Sen are above the price, working as resistance levels.
Based on the current H4 structure, a strong bullish breakout above the 49.08 level could offer a long opportunity, where the main aim is to test the 81.03 resistance level.
The alternative trading approach is to wait for a bearish rejection from dynamic Kijun Sen that can offer a bearish trend continuation opportunity. In that case, the bearish possibility could lower the price toward the 34.00 area.
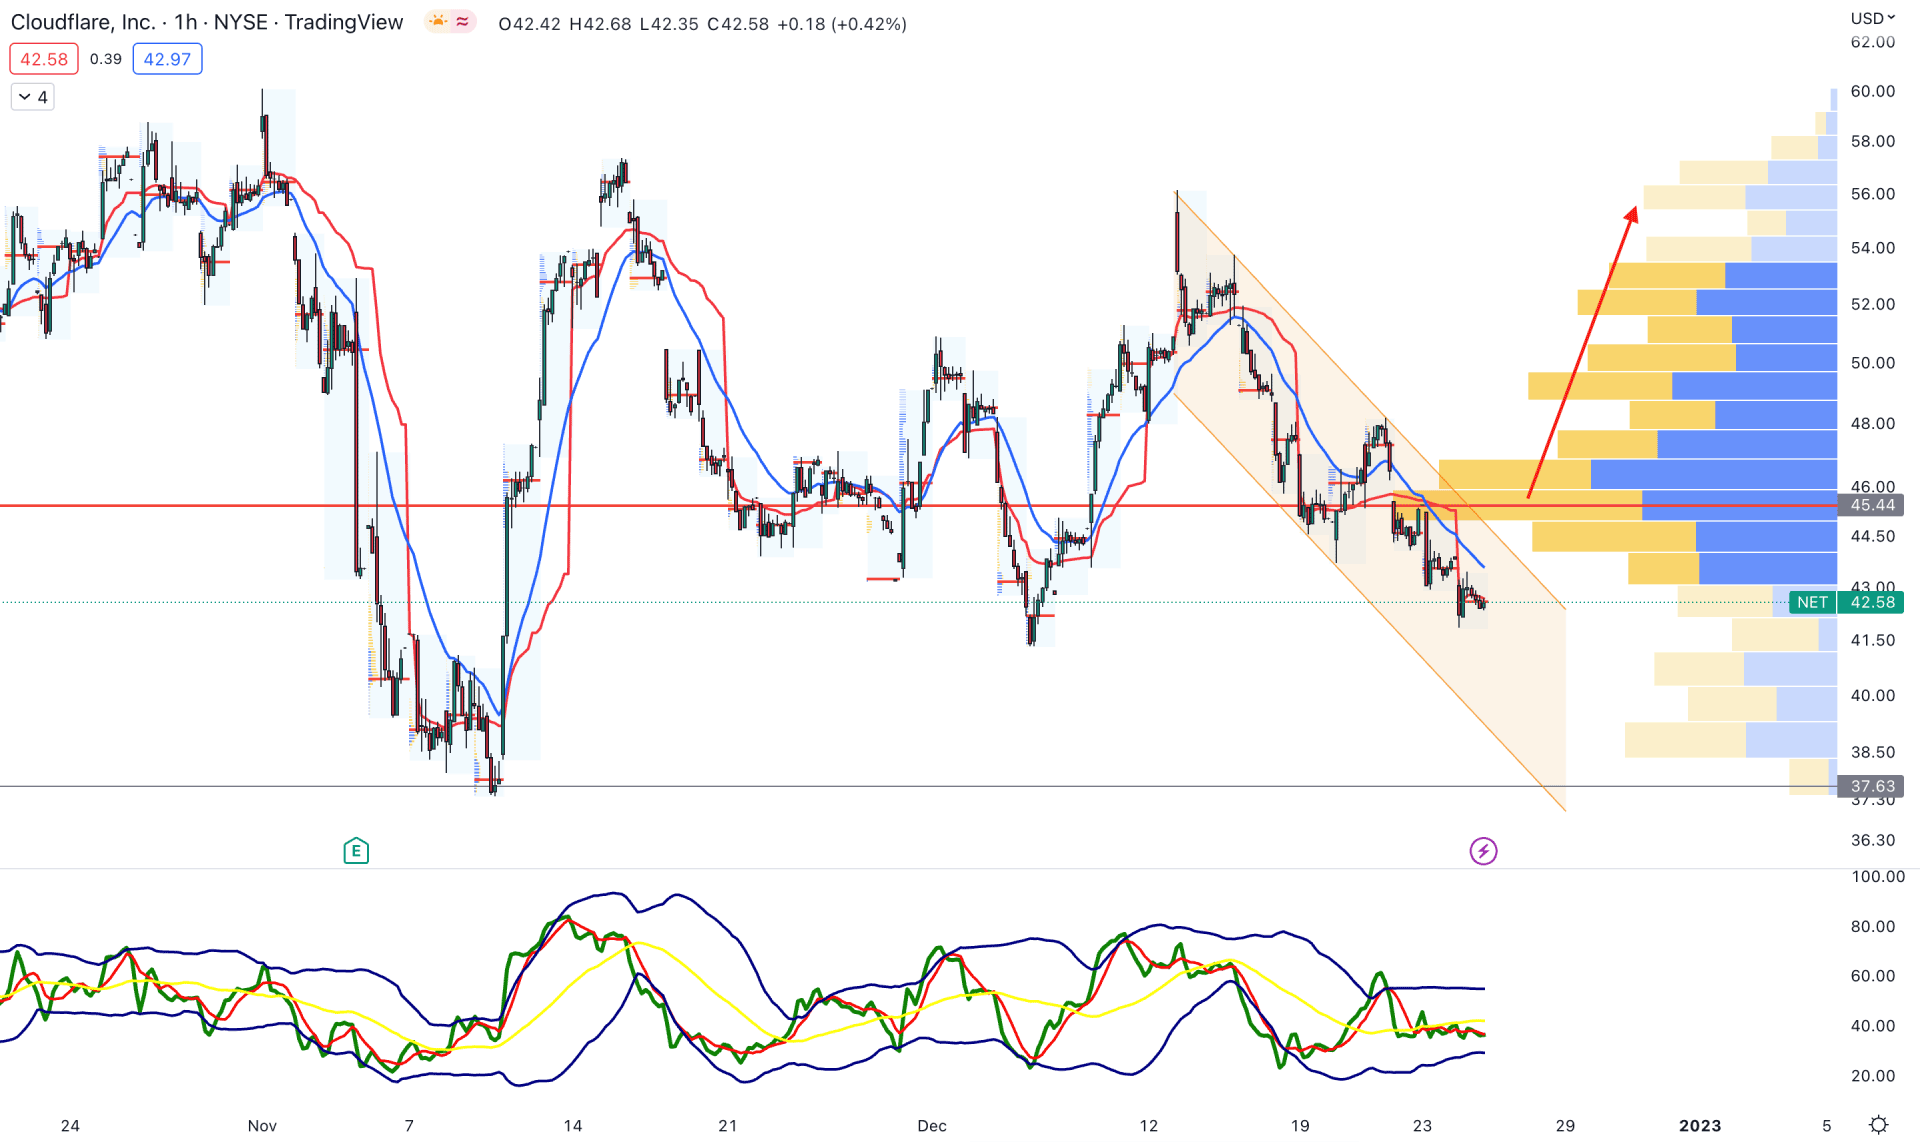
In the NET h1 chart, the current price is trading below the visible range high volume level at 45.44. In that case, bulls should wait for a breakout from the range with a candle close above the high volume level.
The dynamic 20 EMA and weekly VWAP are still above the price, which needs to be overcome before going long in this instrument. The TDI is also corrective and waiting for a clear direction from the current range.
In that case, the bearish opportunity is valid as long as the current price trades below the dynamic 20 EMA. However, a bullish break from the channel could be an aggressive buying opportunity following the broader daily outlook.
Based on the current price outlook, the NET outlook is still bearish and bulls should wait for a breakout before opening a long position. On the other hand, the short-term bearish trend continuation opportunity is present as long as it trades within the daily trendline resistance.


