
Published: March 23rd, 2021
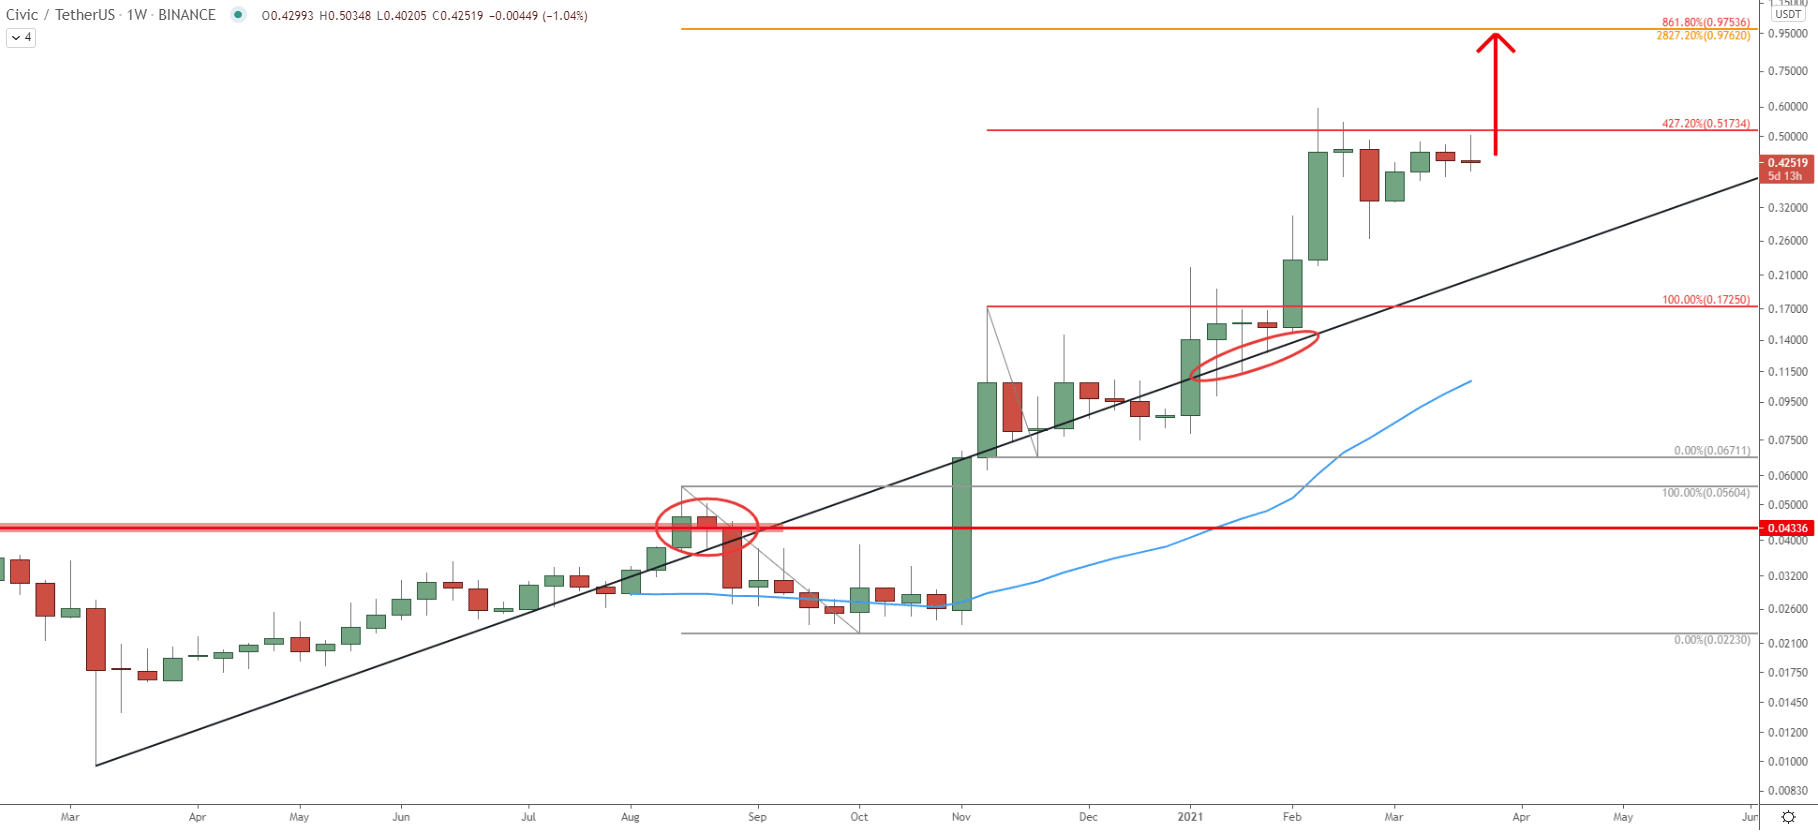
On the weekly chart, the price remains heavily bullish because the trendline is very steady and during the rise, there were no major corrective moves down. Since March 2020 price has risen from $0.01 up to $0.5 resistance area, which is a huge x50 growth that took less than 1 year. The first confirmation that the uptrend has started was to break above the $0.043 resistance, after which a noticeable pullback followed. However, since November 2020, price continued to increase very steadily.
CVC/USDT remains above the average price uptrend trendline, and in fact, it bounced off the trendline at the beginning of the year. Ther a strong 2-week exponential growth followed. Considering such bullish price action, the trend is highly likely to continue. The nearest resistance is seen near the $1 psychological area, to be precise, at $0.97. This resistance level corresponds to two Fibonacci retracement levels, 2827.2% and 861.8% Fibs, applied to two previous corrective waves down.
This means that there is a possibility that the price will more than double in the coming weeks, which makes it a very attractive coin to hold for the short to medium and perhaps even long term.
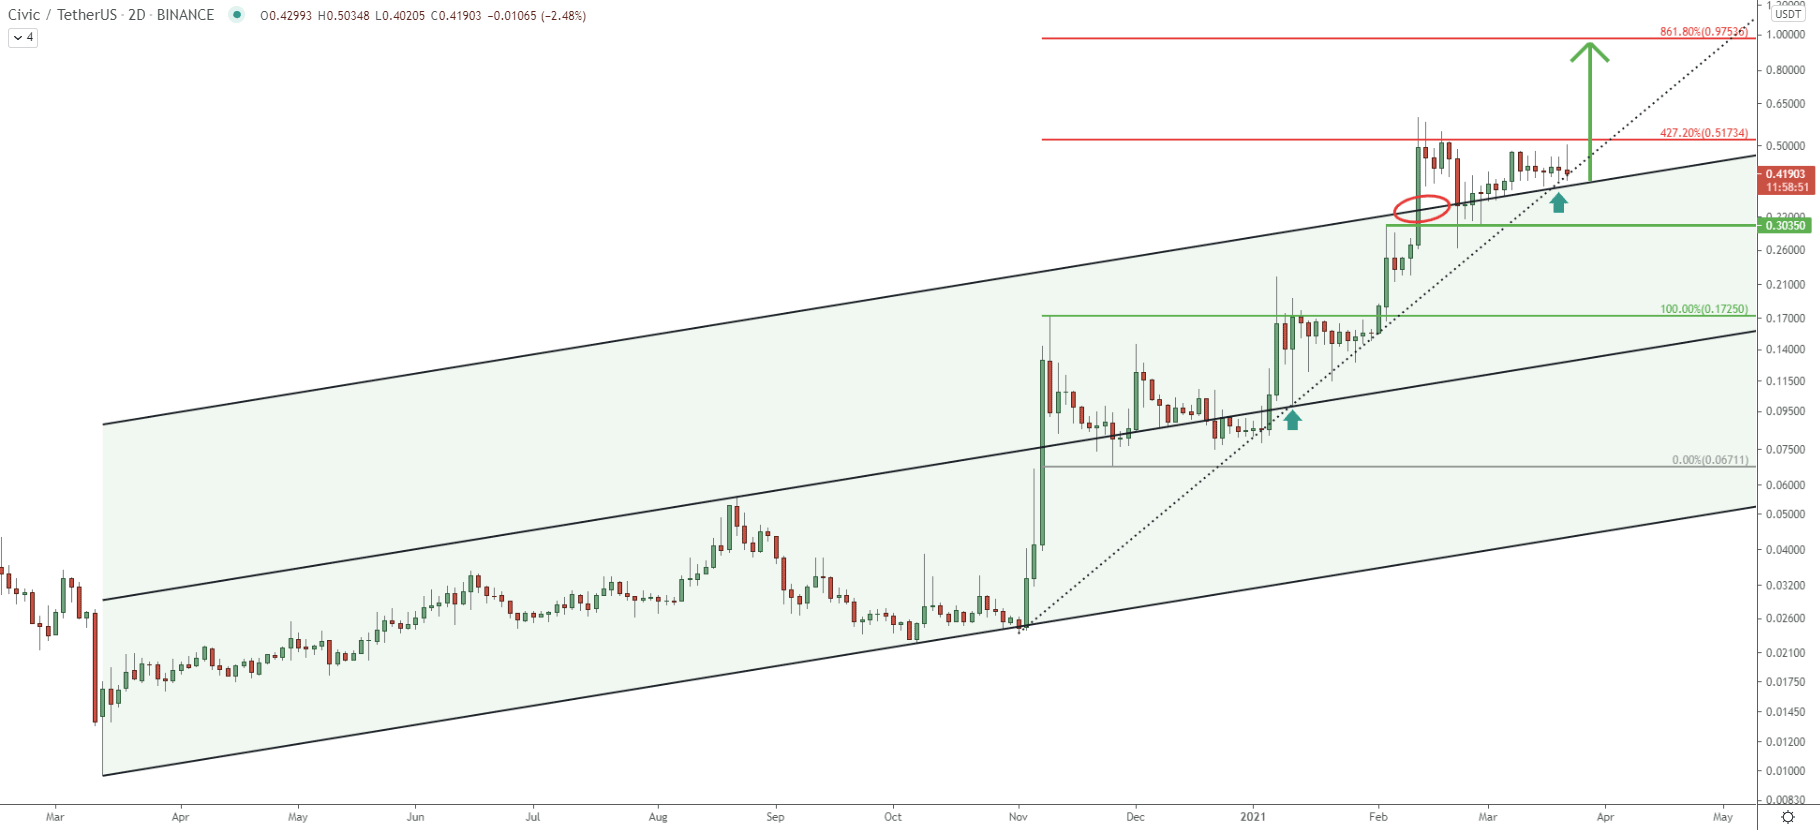
The most interesting price action on this timeframe is the break above the top of the ascending channel on the logarithmic chart. This occurred in early February when the price broke above the $0.30 resistance. CVC has reached the 427.2% Fibs at $0.51 and corrected down. The $0.30 support became the resistance, which during the past 3 months has been respected. There were absolutely no attempts to break below this support, which implies an extremely bullish case for the CVC/USDT.
During the past 4 days, the price has been bouncing off the uptrend trendline, and if it will continue to get rejected, the uptrend continuation is imminent. Besides. The top of the extended ascending channel has become the support, which is also being respected. Therefore, the uptrend might continue at any moment, even as soon as this week.
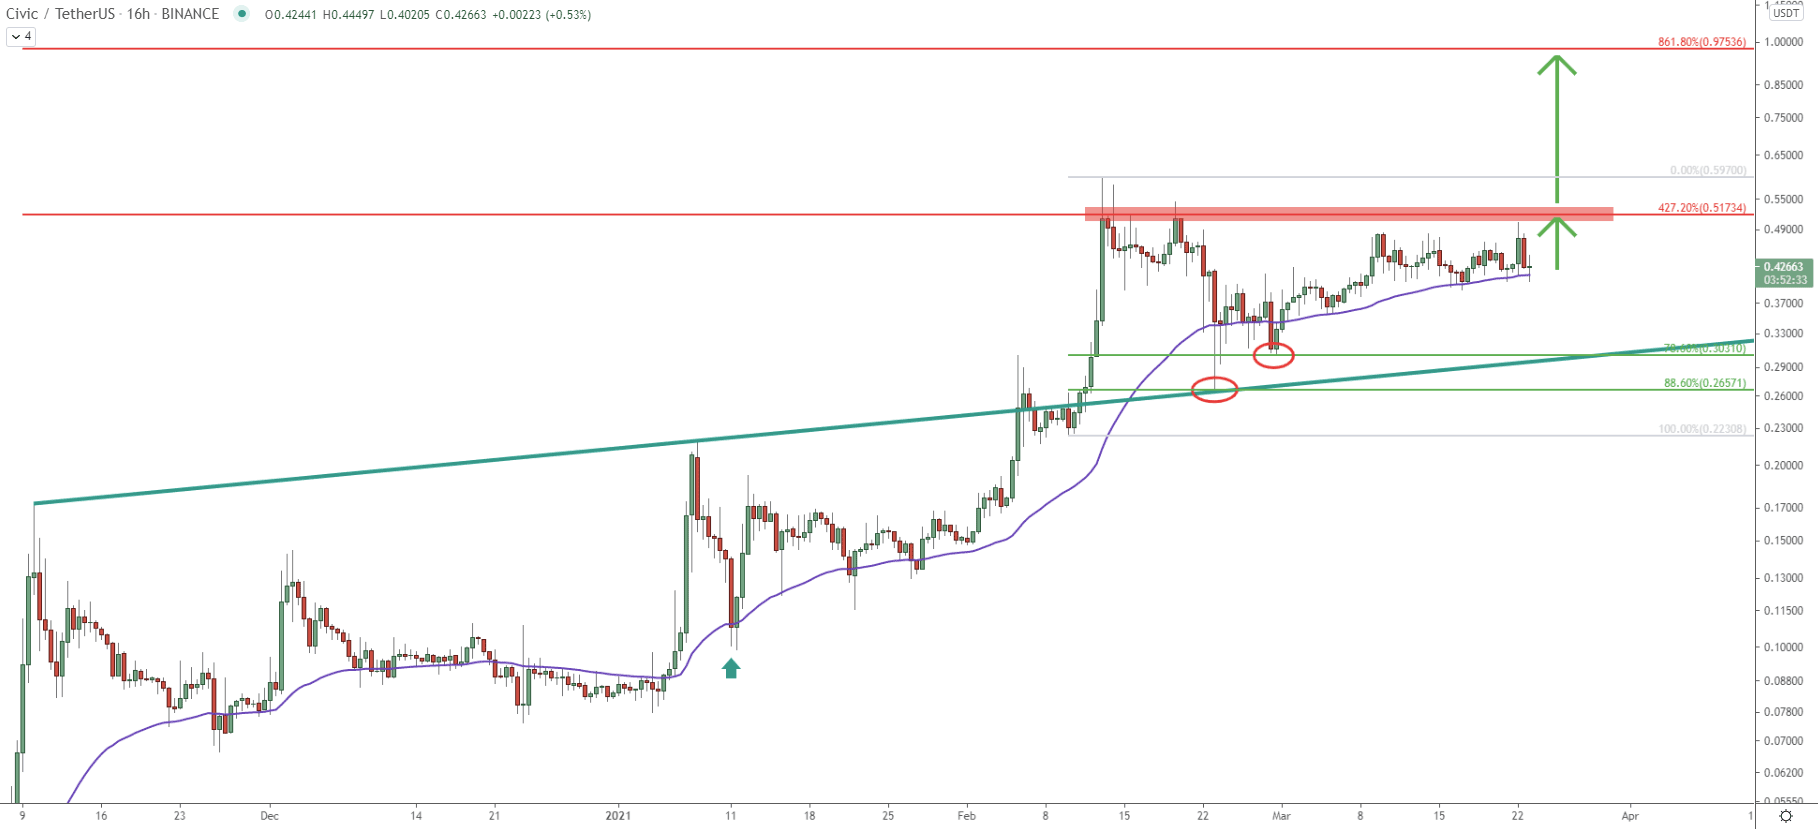
At the end of February, the resistance trendline has become the support. There was an extremely precise bounce off the trendline along with the 88.6% Fibonacci retracement level at $0.26. Moreover, simultaneously Civic rejected the 50 Exponential Moving Average, followed by the bounce off the 78.6% Fibs at $0.30. This is clearly a very bullish scenario and considering that the price remains above the 50 EMA, there is nothing that can stop bulls from pushing the price higher.
But, to confirm a strong buying momentum, the price must break above the previously formed resistance area near $0.51, which corresponds to the 427.2% Fibs. Upon the breakout, the uptrend can be expected to accelerate, heading towards the $1.00 psychological resistance area.
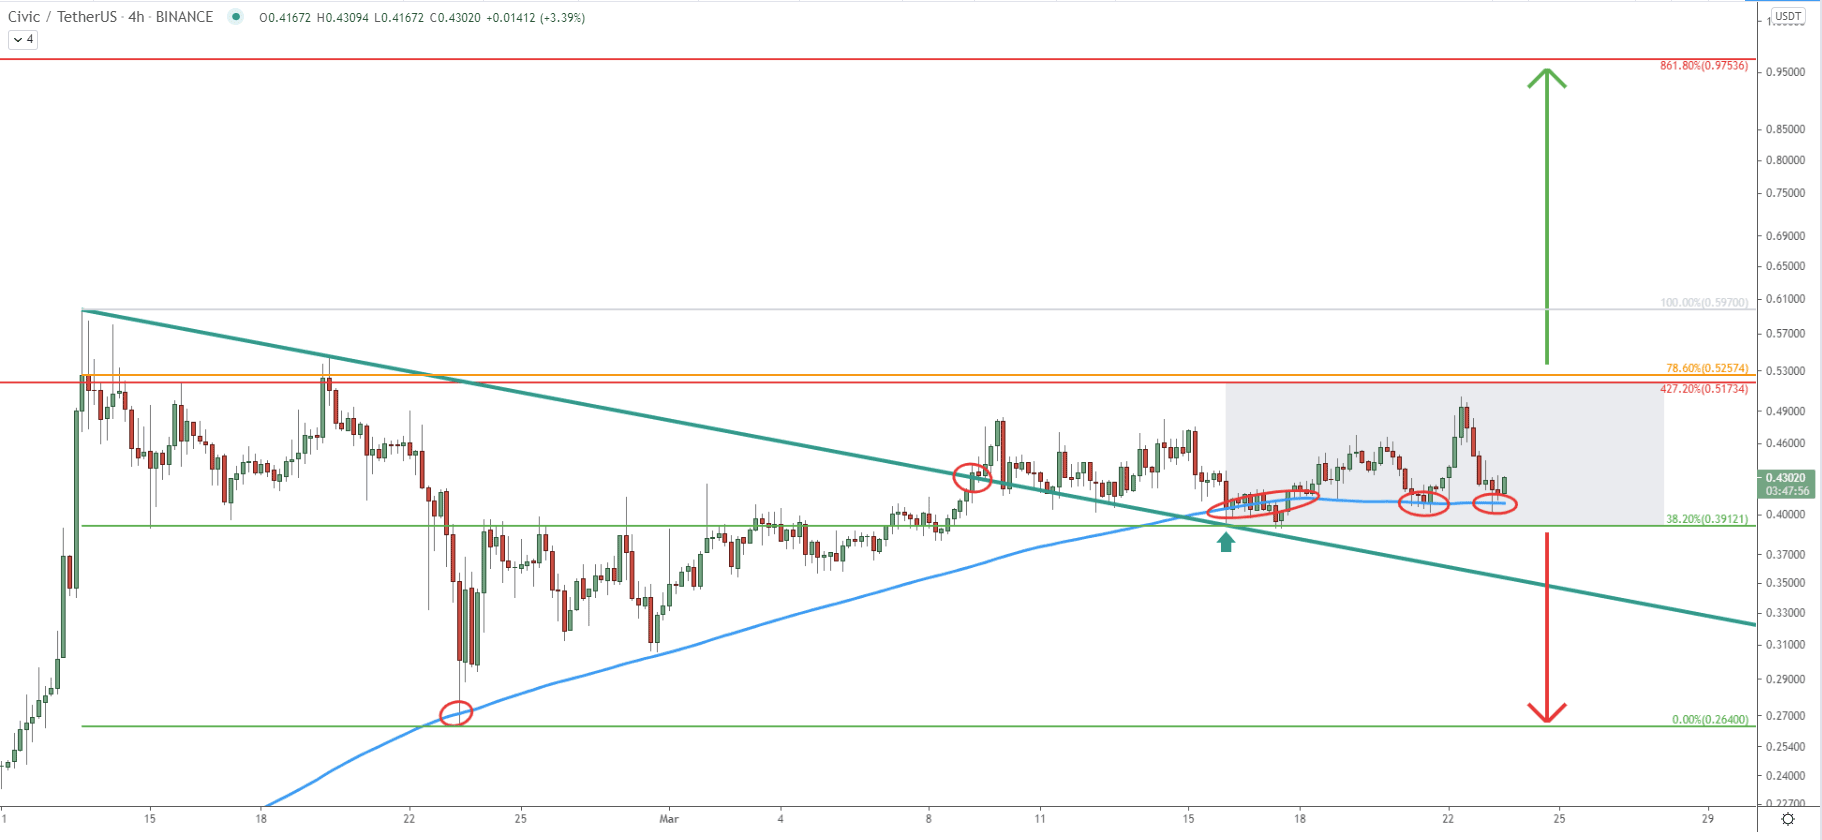
Price remains above the 200 SMA, confirming the validity of an uptrend. At the same time, CVC/USDT broke above the simple downtrend trendline, which later became the support. The trendline was rejected along with the 200 SMA, making $0.39 the nearest key support level to watch. As long as CVC remains above this support, bulls will continue to dominate.
The most recent price action shows that Civic formed a double bottom near $0.40, where it rejected the 200 EMA multiple times. Therefore, a fast move to the upside, towards the $0.51 resistance area might start within the next 48 hours. When/if the price will break above the “consolidation box”, which is between $0.39 -0.51, more buyers are likely to step in, and this is the point when the price can go ballistic.
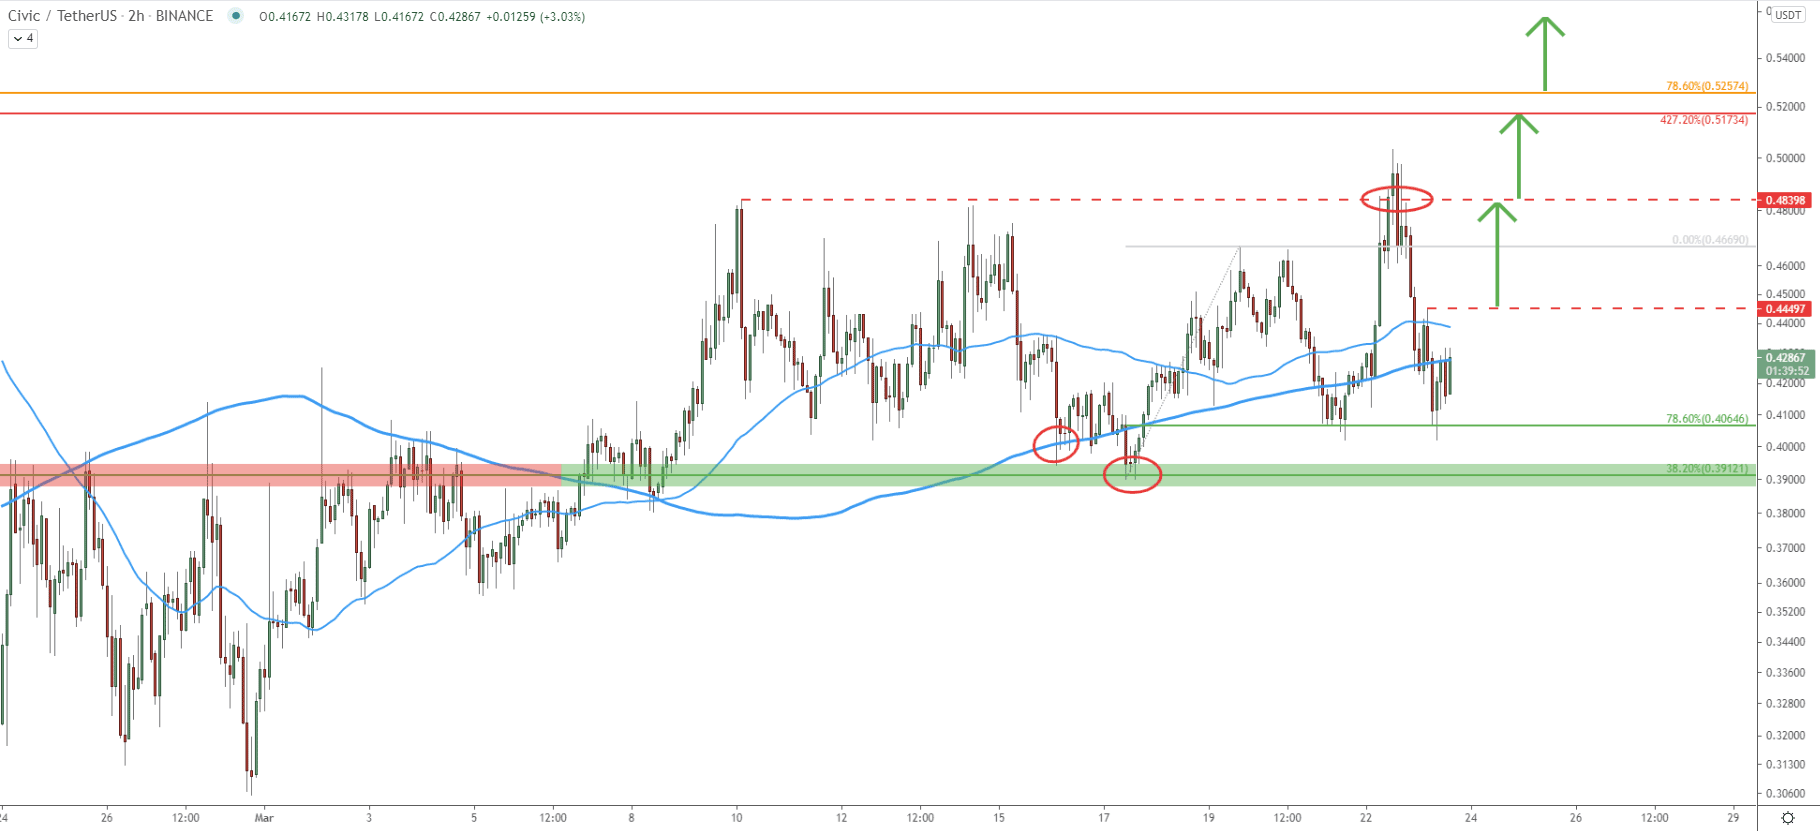
On this chart, it is clearly visible how the support at $0.39 became the reistance. Price bounced off the $0.40 support area two consecutive times, where the 200 SMA was also rejected. Then the price went up, and on the pullback found the support at $0.40, which is confirmed by 78.6% Fibonacci retracement level.
The nearest minor resistance, where CVC bounced off the 50 SMA, is located at $0.44. Break above this level should be the first bullish signature, which should result in a further price increase. The next resistance is $0.48, and then $0.51 - 0.52. Up until the point where Civic breaks above the $0.52, no major upside moves will take place.
Civic remains in a heavy uptrend, due to the extremely small pullbacks throughout the entire price increase of the past year. There are multiple factors pointing out that price is about to start rising, and this can easily be a 100% increase during the next couple of weeks.
As per the weekly chart, the key resistance is located at $0.97, which is confirmed by two Fibonacci retracement levels. Very possible that the $1.00 psychological level will be tested before/if the downside correction will take place.
As per the 4-hour chart, the key support is located at $0.39. Break below this level will invalidate bullish outlook and in this case, Civic might drop towards the $0.26 support once again.
Support: 0.40, 0.26
Resistance: 0.51, 0.97


