
Published: August 12th, 2025
Cisco reported $14.15 billion in revenue last quarter, increasing 11.4% year over year and 0.7% above analysts' revenue projections. Analysts predict that Cisco's revenue will grow 7.3% year over year to $14.64 billion this quarter, reversing the 10.3% decline it saw in the same period last year. It is anticipated that adjusted earnings will be $0.98 per share.
Some of Cisco's competitors in the information technology services and other tech sectors have already released their Q2 results, which gives us an idea of what to anticipate. EPAM announced revenues increased 18%, exceeding predictions by 1.5%, while Applied Digital's sales fell 13% year over year, meeting the projections of analysts. Following the findings, EPAM was up 4.4% and Applied Digital was up 31.3%.
In 2025, there will be a lot of volatility due to concerns about possible tariffs and adjustments to corporate taxes. The group has fallen short overall, with its stock price dropping 3.1% over the past month, while certain IT services and other IT stocks have performed well in this volatile climate.
Let's see the complete outlook from the CSCO technical analysis:
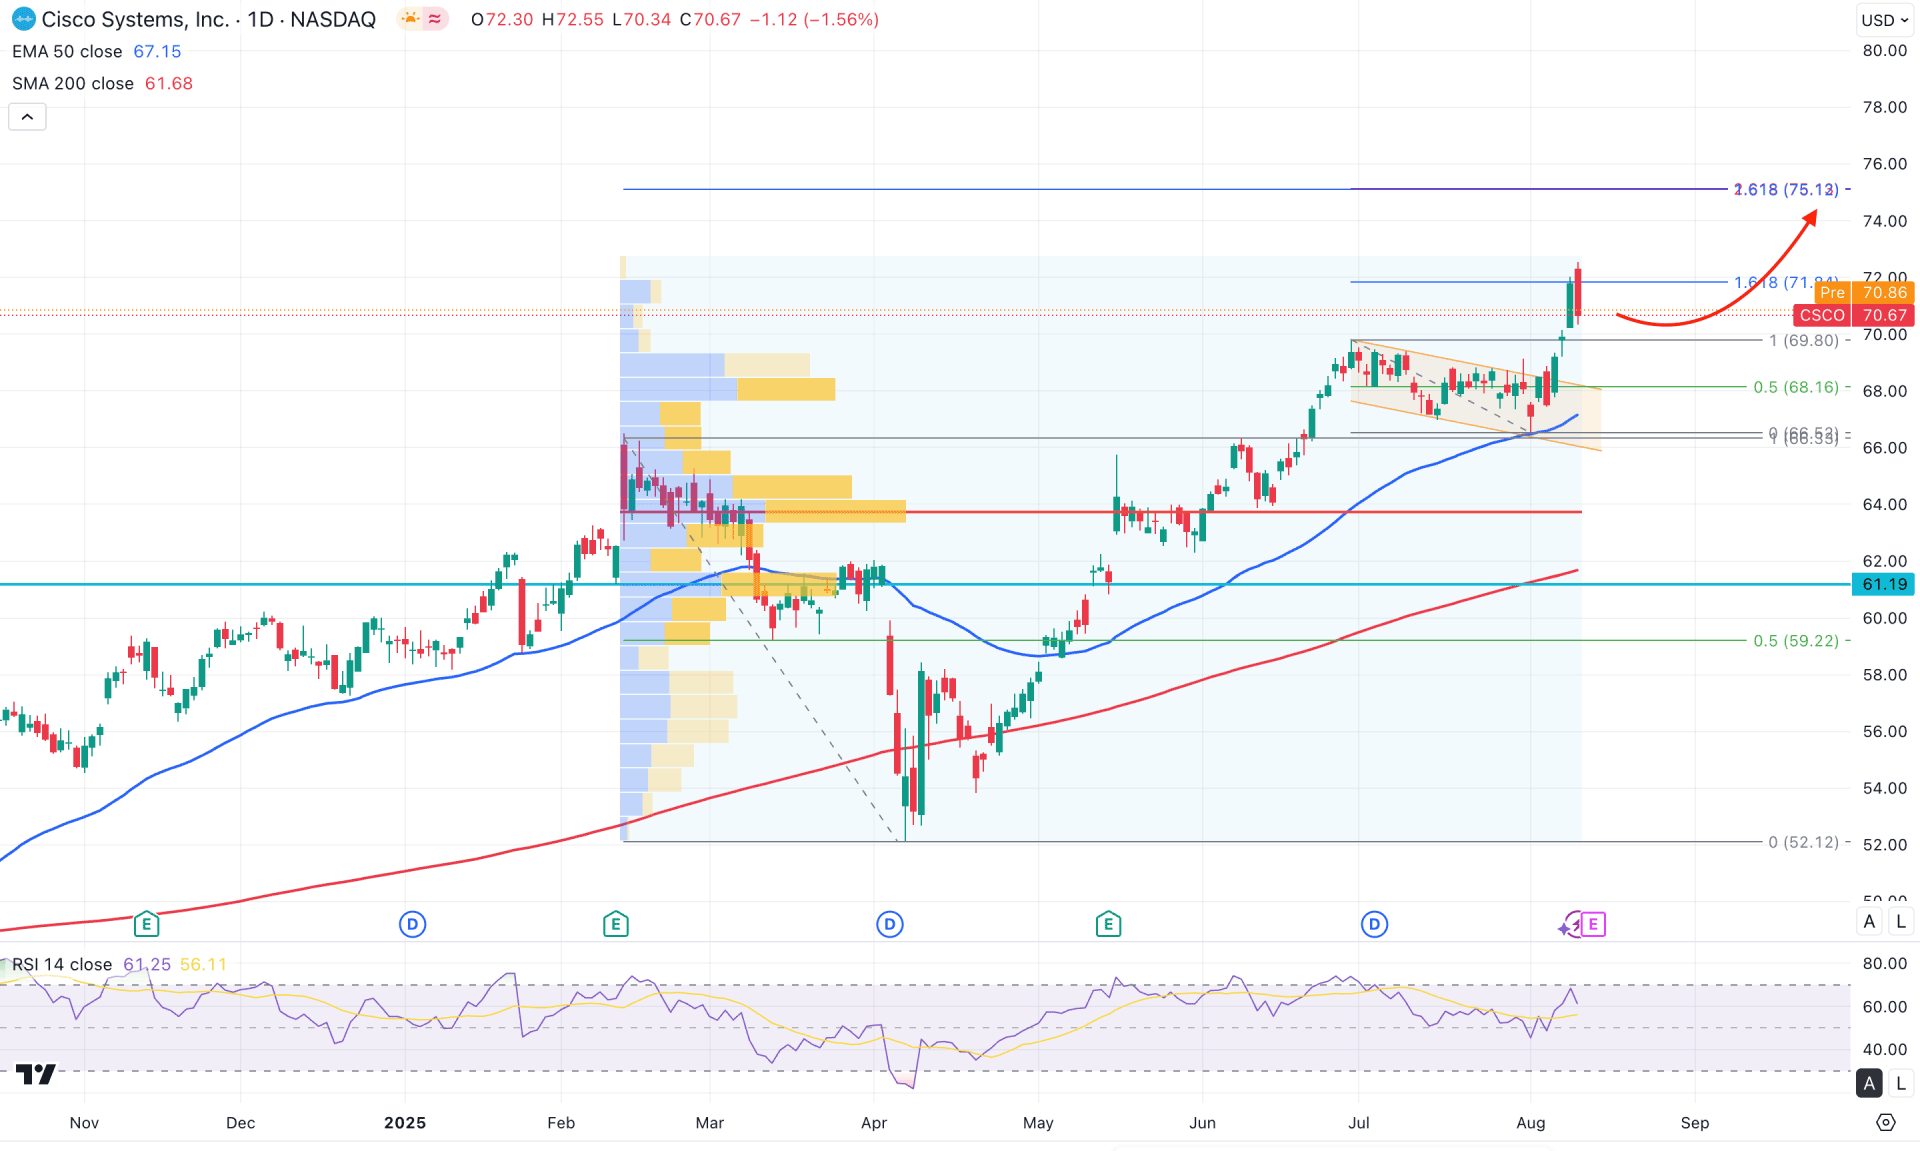
In the daily chart of Cisco stock, a prolonged bullish trend is visible as the current price is trading in the all-time high area. Although the price is in the premium zone, there is no sign of a bearish recovery.
Looking at the higher timeframe, the monthly chart suggests a strong bullish continuation with an inside bar breakout. The price has managed to move above the 69.81 monthly high and is still hovering above it, indicating strong buyer presence in the market. Moreover, the weekly chart is also trading higher after a valid rally–base–rally formation, though a potential downside correction is pending before extending the buying pressure.
In terms of volume, the bullish momentum is still valid, although the gap between the price and dynamic lines has widened. According to the high-volume level indicator, the most active level since February 2025 is 63.79, which is almost 9% below the current price. As long as the price holds above the 63.79 level, bullish continuation remains possible.
On the main price chart, a descending channel breakout is evident as multiple daily candles have closed above it. Although a downside correction is still pending, the bullish momentum remains valid as long as the price trades above the channel resistance.
In the medium- and long-term outlook, the 200-day SMA is acting as a strong support at the 62.00 level. Furthermore, the 50-day EMA has served as an immediate support at 66.53, from where a bullish rebound occurred. Primarily, as long as the price trades above these crucial dynamic lines, the ideal approach would be to look for long trades only, depending on how the price reacts after completing the downside correction.
In the secondary indicator window, the Relative Strength Index (RSI) is in the buyers' zone, with recent readings hovering between 70.00 and 50.00. Although the RSI has shown minor downside pressure without revisiting the 70.00 level, it remains above the 50.00 line. As long as the RSI stays above the 50.00 neutral band, we may expect the bullish momentum to continue.
Based on the overall market structure, CSCO stock is more likely to extend buying pressure after completing the correction from the channel breakout. Investors should closely monitor how the price retraces to the channel area, as a valid bullish candlestick formation from the 69.00–66.00 zone could signal a trend continuation setup.
On the other hand, an extended decline below the 50-day EMA could initiate a consolidation. In that case, a failure to hold the 63.79 level could trigger downside pressure toward the 200-day SMAe. Furthermore, additional selling pressure below the 61.19 level, coupled with consolidation, might invalidate the current bullish structure, potentially driving the price below the 52.00 support level.
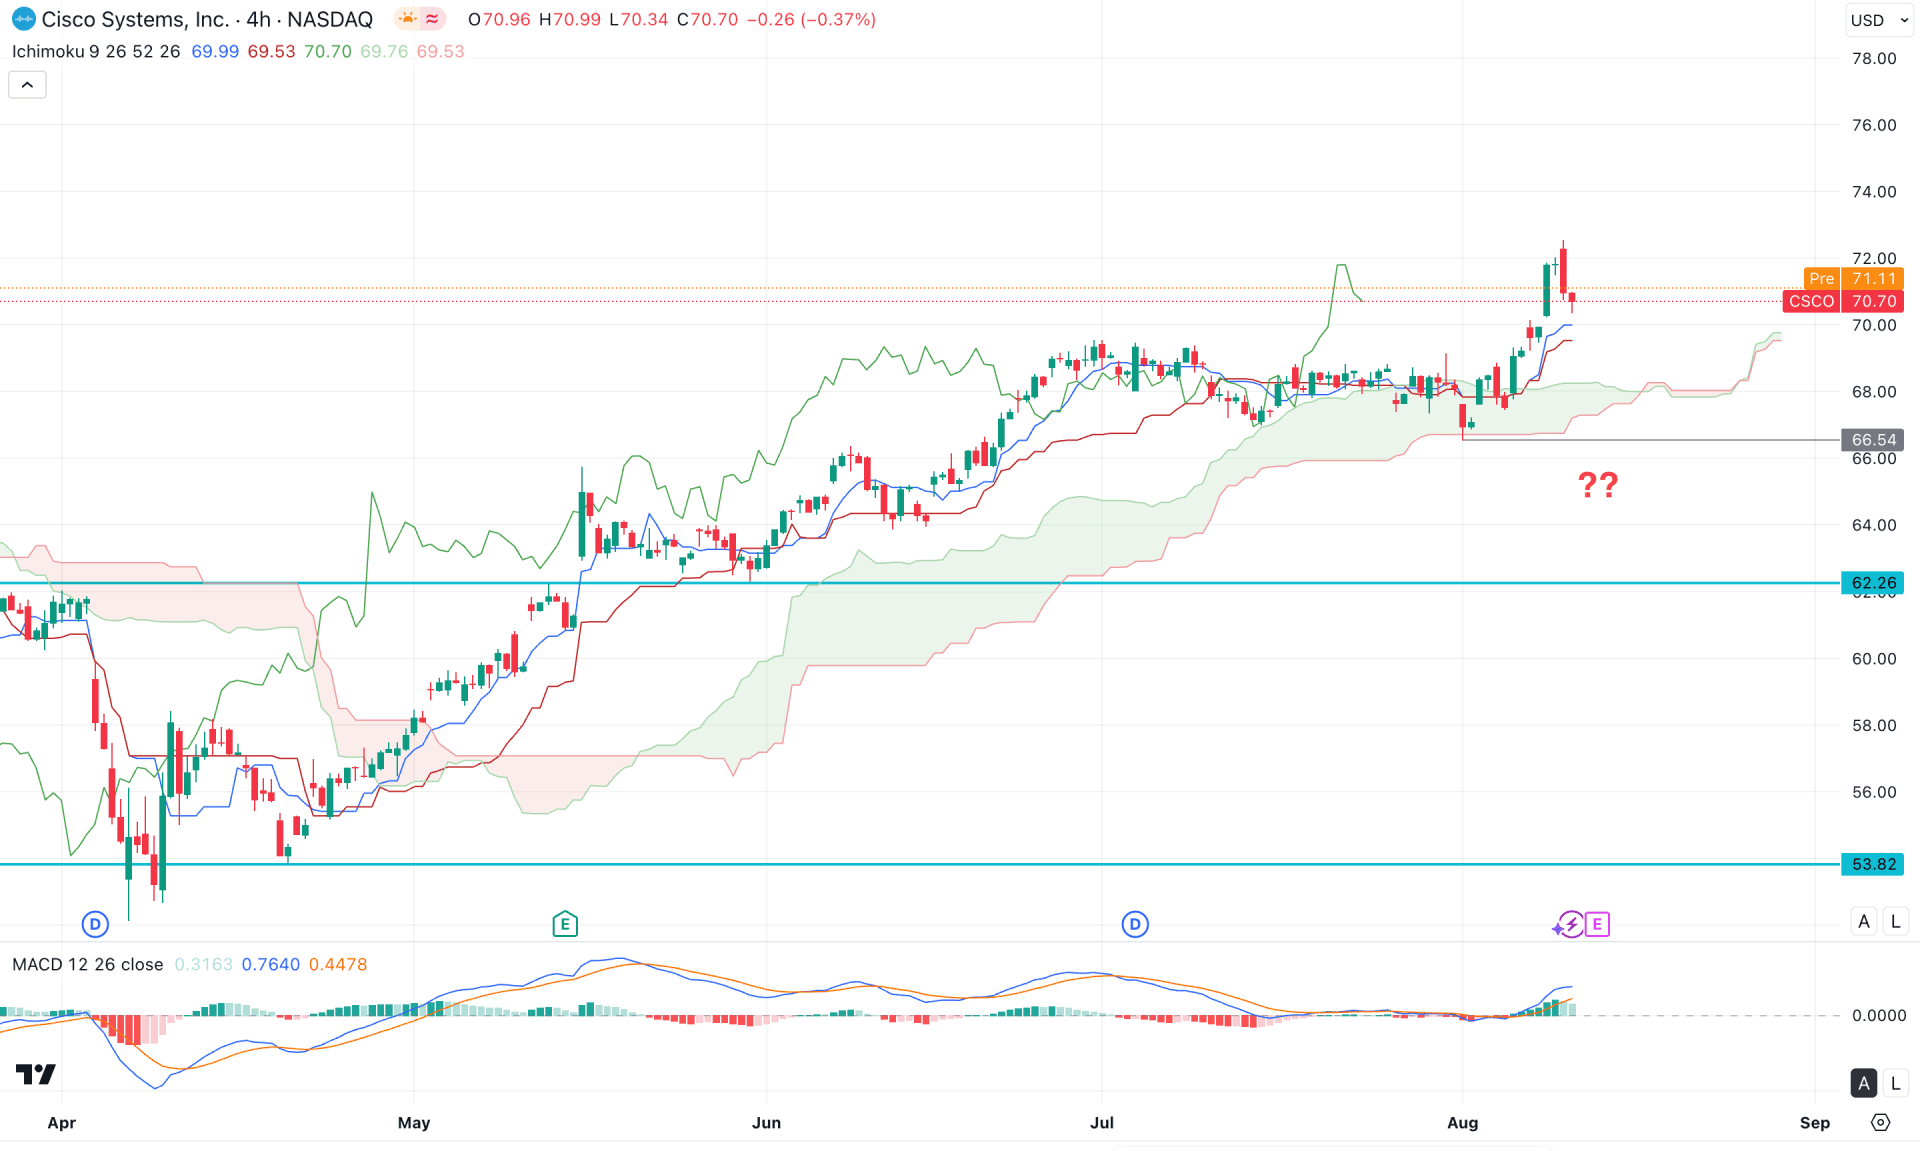
In the four-hour timeframe, the ongoing bullish trend is visible as the price found support at the dynamic Kumo cloud before extending higher above the 72.00 psychological line. Moreover, the recent price is holding momentum above dynamic levels, signaling strong buyer presence in the market.
In the secondary indicator window, the MACD histogram has maintained a buying position by remaining above the neutral line for a considerable period. However, the signal line has reached the upper band area, from where a potential recovery is possible. Moreover, the thinness of the future cloud suggests a weaker possibility for a strong bullish continuation.
Based on the overall market outlook, investors should pay attention to the dynamic levels. A recovery with an immediate bullish reversal above the dynamic line could offer a continuation opportunity toward the 74.00 level.
On the other hand, immediate selling pressure with consolidation below the 68.54 low could invalidate the current price action and open a short opportunity, following a buy-side liquidity sweep. In that case, a failure to hold the 62.26 level could be an alarming sign, as it may lead the price toward the key 53.82 support level.

In the hourly timeframe, the CSCO stock is trading at the premium zone as the dynamic EMA wave is below the current price. Moreover, the intraday high volume line is below the current price and working as a confluence of buying pressure.
In the secondary window, the Traders Dynamic Index (TDI) represents downside pressure as the latest TDI line has rebounded from the upper Bands level.
Based on this outlook, investors should closely monitor how the price trades at the 70.22 support level. A downside recovery with an immediate rebound could be a potential long opportunity aiming for the 74.00 level.
The alternative trading approach is to look for a short opportunity after dipping below the 68.47 high-volume line. In that case, the downside pressure might extend and lower the price towards the 66.00 area.
Based on the broader market outlook, CSCO stock is more likely to aim higher until a top is formed with a valid exhaustion. As the intraday price is trading higher, investors should find long trades once the daily correction is over.


