

Published: September 22nd, 2026
The first-quarter fiscal 2027 results of Cintas Corp CTAS will be released on September 23, before the market opens.
Analysts' consensus estimate for CTAS's fiscal first-quarter revenue is $2.97 billion, up 9.2% from the same period last year. With an average beat of 1.8%, the company has a strong earnings-surprise record, beating consensus in each of the last four quarters. Its profits of $1.29 a share in the most recent quarter were 4% higher than the consensus forecast of $1.24.
The company expects strong customer retention and the penetration of new goods and services into current clients to have driven success in the fiscal first quarter. The segment's revenues are expected to reach $2.27 billion, which is an 8.7% increase over the reported figure from the previous year.
The First Aid and Safety Services segment's performance was likely supported by strong demand for the company's AED rentals. Additionally, a better sales mix and high client retention rates probably boded well for the market.
However, CTAS's profitability is at risk due to rising selling, general, and administrative (SG&A) costs. The company's first-quarter margins were likely pressured by higher SG&A expenses, driven by rising employee-partner-associated costs.
Let's see the full price projection from the CTAS technical analysis:
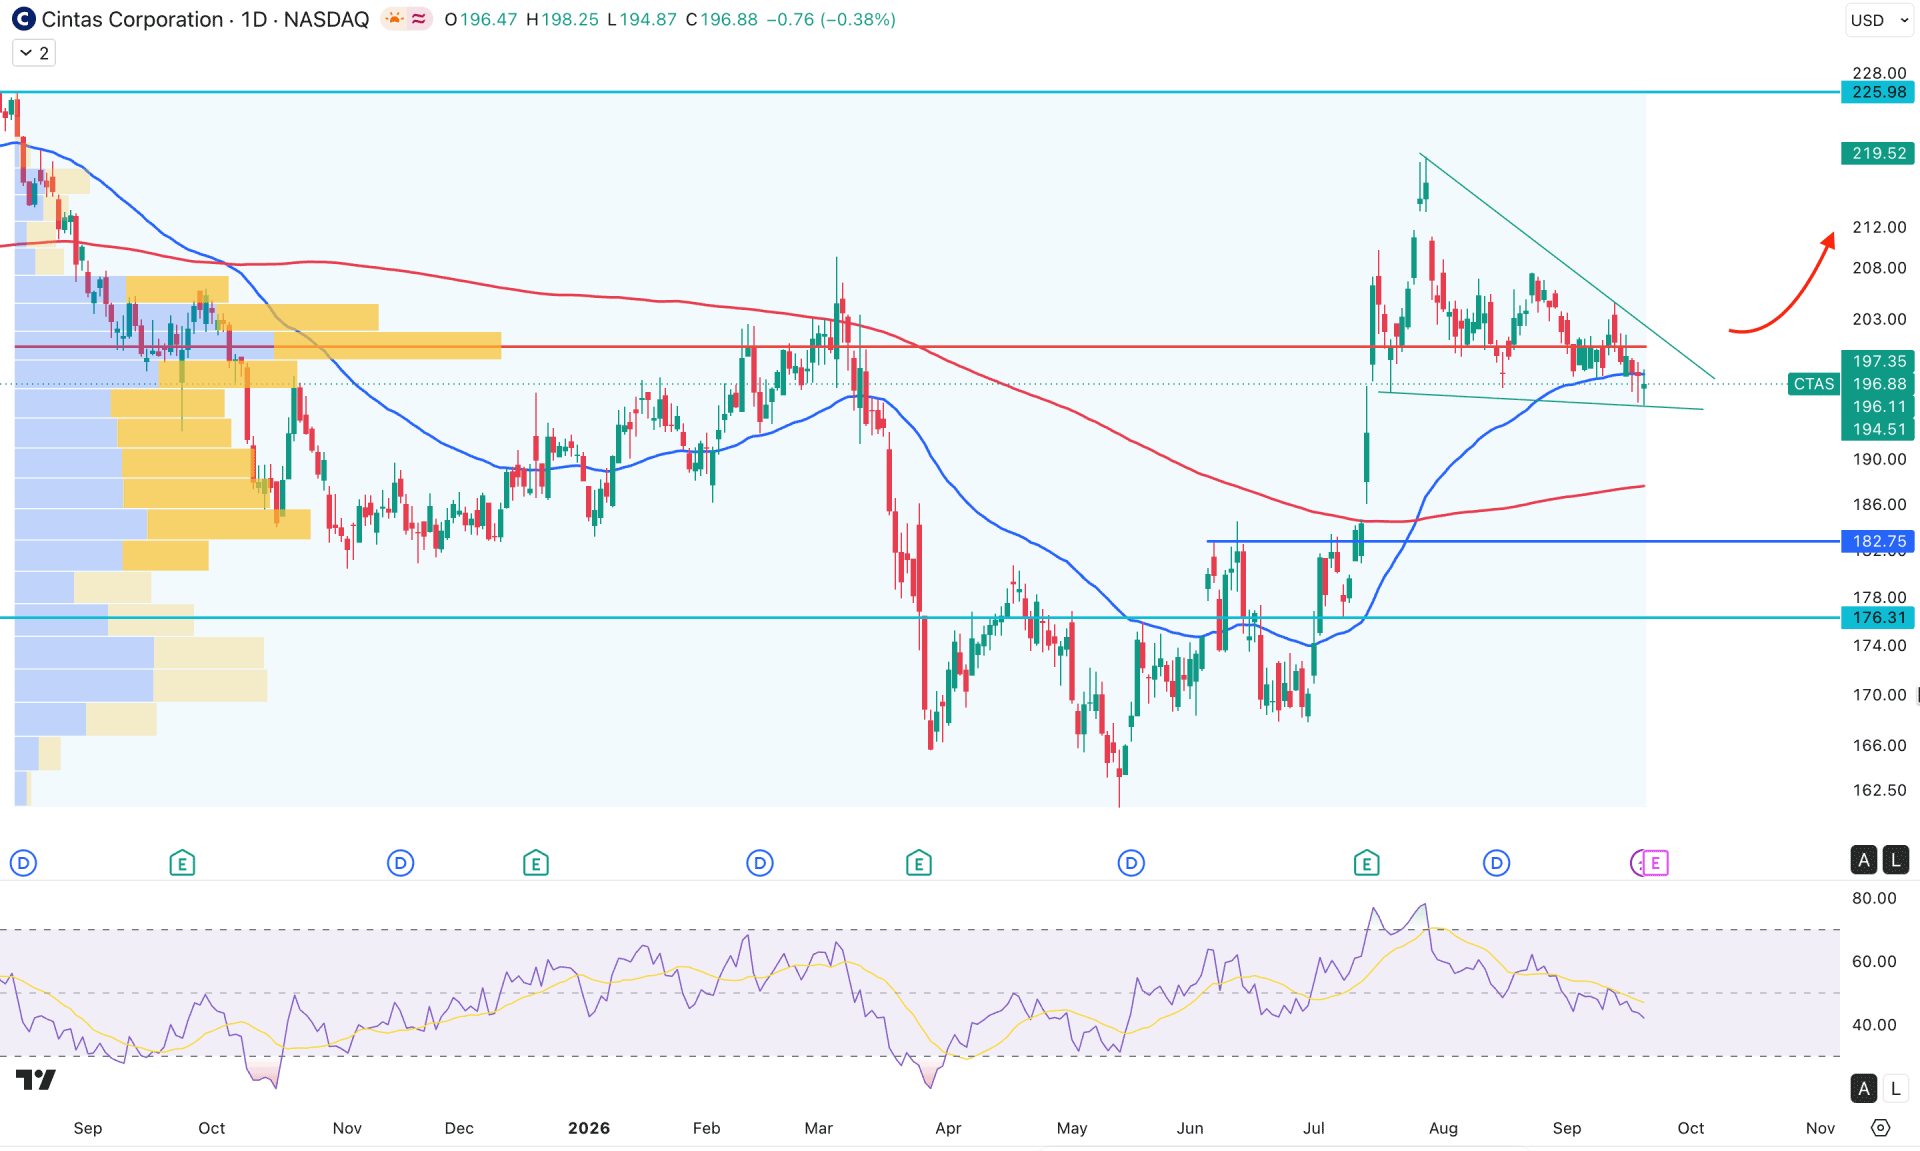
On the daily chart of Cintas Corp stock, recent market momentum is bullish, as the price rebounded after a valid inverse head-and-shoulders breakout. As a result, the price formed bullish momentum with a new swing high in July 2026. As minor profit-taking is visible, investors may see a bottom formation before the existing bullish trend continues.
On the higher timeframe, bullish momentum remains solid, even though price has traded in a consolidation phase since mid-2024. The recent monthly candle is trading as an inside bar, followed by a strong bullish breakout in July 2026. This signals active buying pressure in the market, with further bullish continuation possible. A similar structure is visible on the weekly timeframe, where a strong bullish rejection is clear at the 209.17 weekly resistance level. Primarily, it signals a significant correction, but it is not enough to confirm a trend reversal.
In terms of volume, the most active level since August 2025 is 200.42, which is above the current daily candle. However, multiple violations in the recent chart around the high-volume level signal consolidation.
In the main price chart, the buying pressure is struggling to maintain momentum at the 50-day EMA, where multiple indecision candles are visible. Moreover, the 200-day SMA remains below the current price and is acting as major support beneath the current pennant pattern.
The oscillator shows corrective selling pressure, where the current RSI is hovering below the 50.00 neutral level for a considerable time. Still, the Relative Strength Index has more room to move lower and test the 30.00 oversold level, signaling selling pressure in the main chart.
Based on the overall market structure, the primary aim is to look for a long trade after a valid bullish pennant breakout. A stable price above the pennant resistance and high-volume level could increase the possibility of testing the 225.98 level and moving beyond it.
The alternative scenario is a corrective bearish extension that tests the 182.75 support level before offering another long opportunity. In that case, a rebound above the 50-day EMA could increase the bullish possibility at any time.
As the current price struggles to hold momentum above the 50-day EMA, immediate bearish pressure is possible. Moreover, extended selling pressure below the 176.31 level could increase the possibility of testing the 160.00 area.
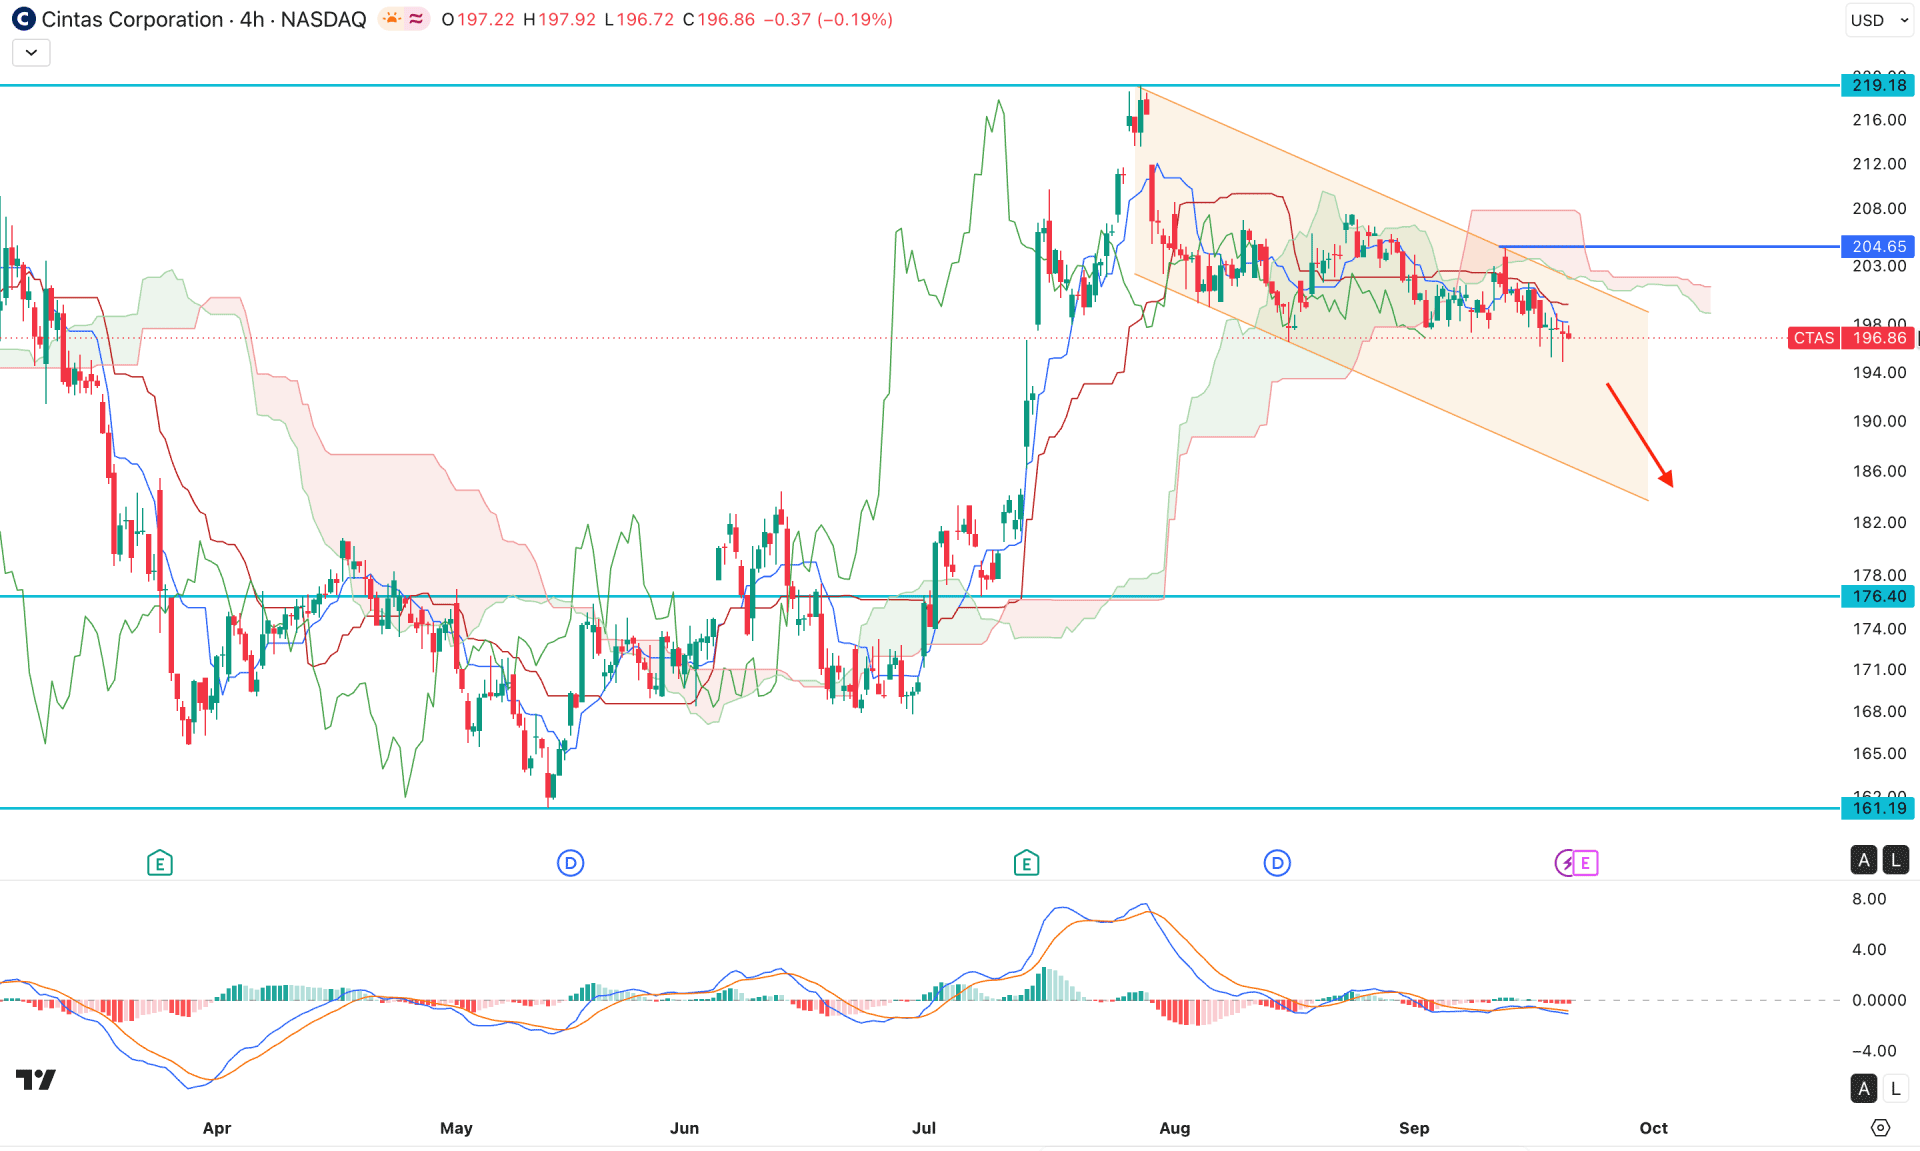
In the four-hour timeframe, the recent price is trading within corrective momentum below the Kumo cloud area. The future cloud has shifted position, and the Chikou Span is below Span B. This primarily signals corrective bearish continuation momentum, supported by dynamic resistance above the current price.
In the secondary indicator window, the MACD signal line remains below the neutral area for an extended period. Moreover, the histogram maintains selling pressure, while a weakness of bearish momentum is visible. Still, as the histogram remains below the neutral level, a bullish flip could limit the selling pressure at any time.
Based on market structure, price is likely to extend selling pressure toward the support level before forming a bullish opportunity. In the current price action, the immediate support level is at 176.40, which could be tested before offering a long opportunity.
An alternative approach is to look for an immediate bullish breakout above the cloud area, which could increase the chance of testing the 219.19 key resistance level.
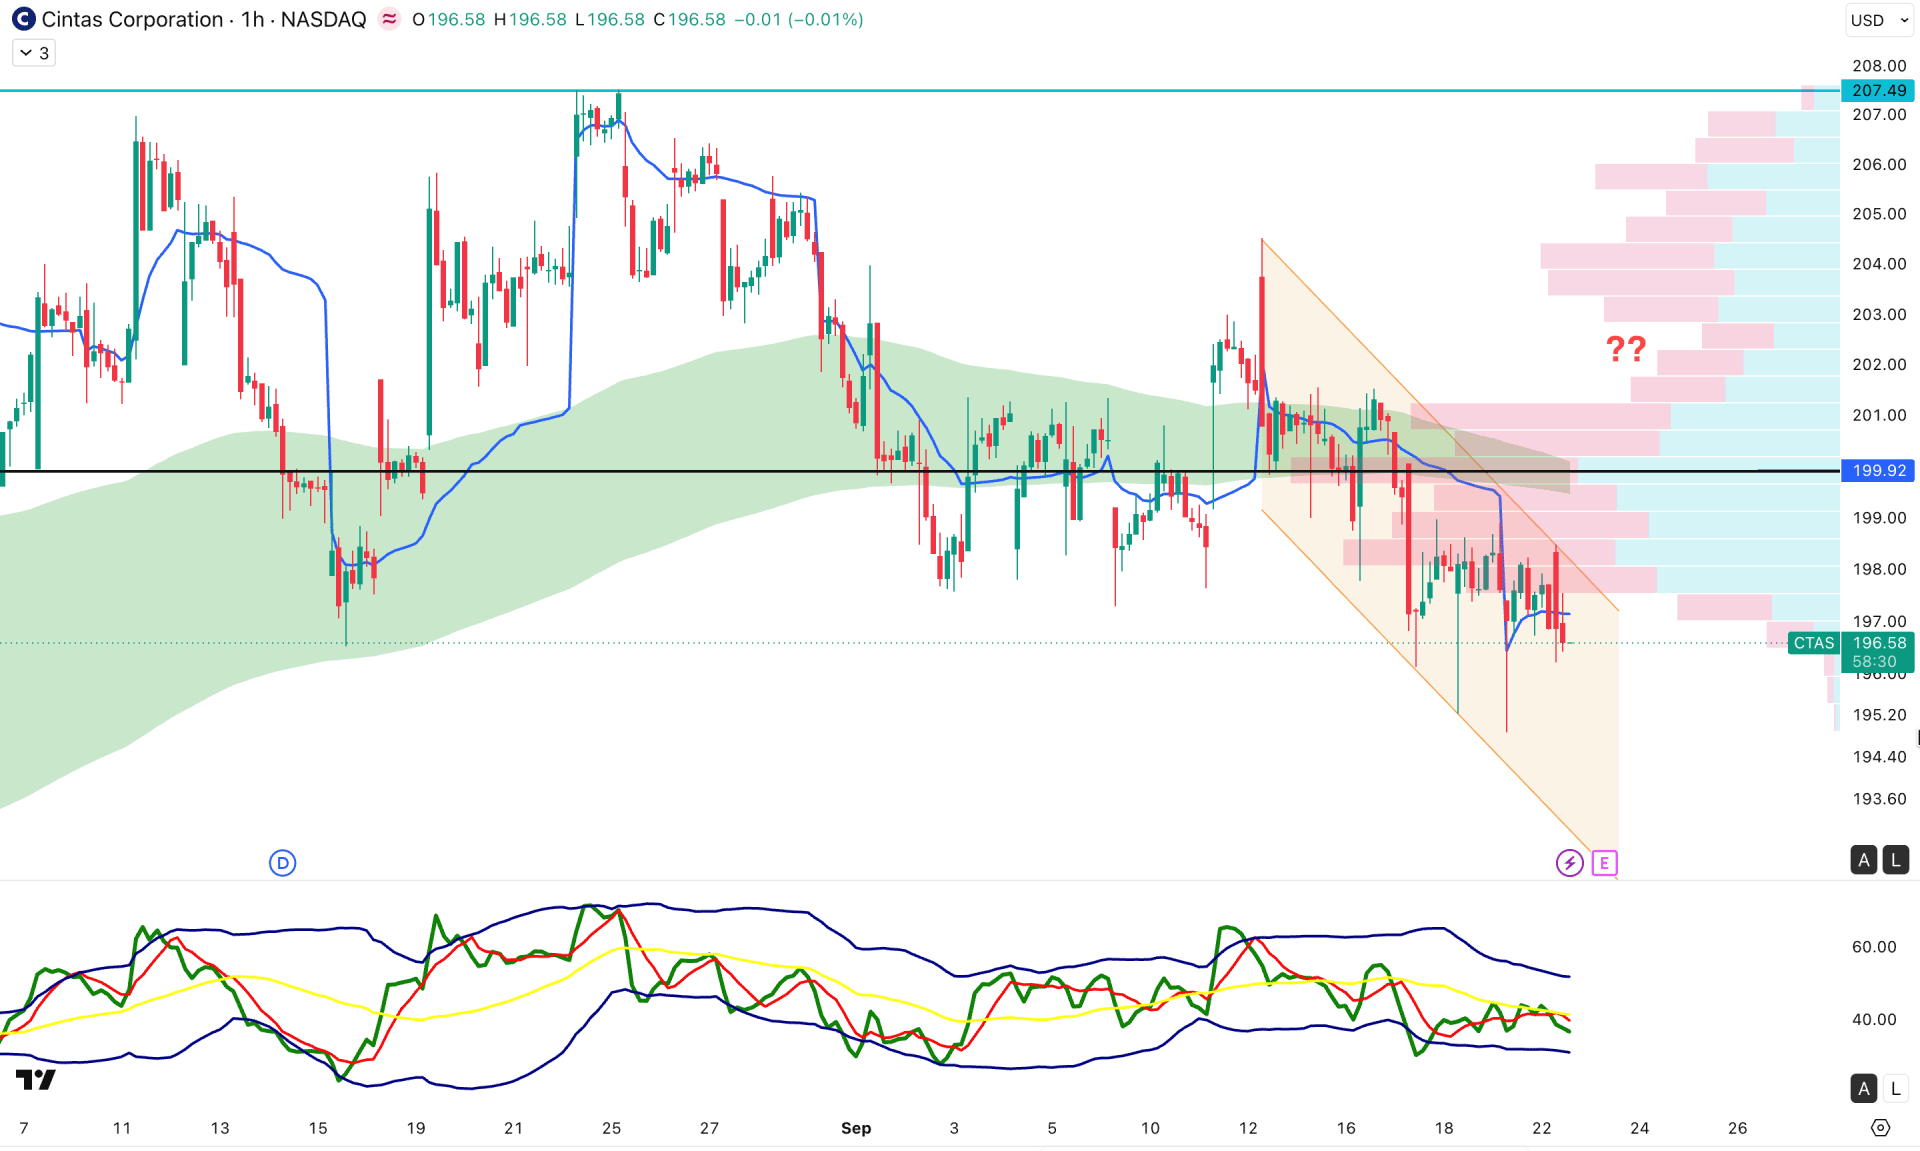
On the hourly timeframe, CTAS is trading under corrective bearish pressure, as the price recently faced a bearish reversal at the descending channel resistance.
The weekly VWAP and EMA waves are above the current price and sloping downward, signaling major selling pressure on the hourly chart.
In the indicator window, the Traders Dynamic Index (TDI) remains steady below the neutral 50.00 level, signaling bearish pressure.
Based on the hourly structure, market momentum is bearish, with the immediate support level to watch at 193.60. However, price action within the channel is corrective, and a bullish breakout with a recovery above the 200.00 level could signal a market reversal.
Based on the overall market structure, the price is trading within a bullish structure, while the intraday price has created a top. In that case, the price is likely to extend the current corrective bearish pressure. Any sign of a liquidity grab from the near-term low, followed by a bullish rebound, could be an early long opportunity.


