
Published: April 1st, 2026
Over the past week, the price of CHZ has increased by almost 28%, breaking out of a stabilization range between $0.037 and $0.044. A fair long/short ratio and a 13% increase in open interest underpin the rally, suggesting sound trend growth rather than speculative congestion.
Top Indonesian football team Persija Jakarta is proceeding with the launch of its fan token (PRSJ) through Chiliz's platform. The goal of this collaboration, first announced in 2022, is to increase blockchain-based fan engagement in a significant Southeast Asian market. Although reports on the token's live state have been inconsistent, the development emphasizes Chiliz's continued growth of its athletics ecosystem.
This is encouraging for CHZ, as it shows practical use and uptake, connecting token interest with fan interaction. Network utilization can be sustained by successful launches in important football markets.
Concrete ecosystem expansion and strong market momentum are shaping CHZ's trajectory, although it is currently facing technological challenges. Let's see the upcoming price direction from the CHZ market analysis:
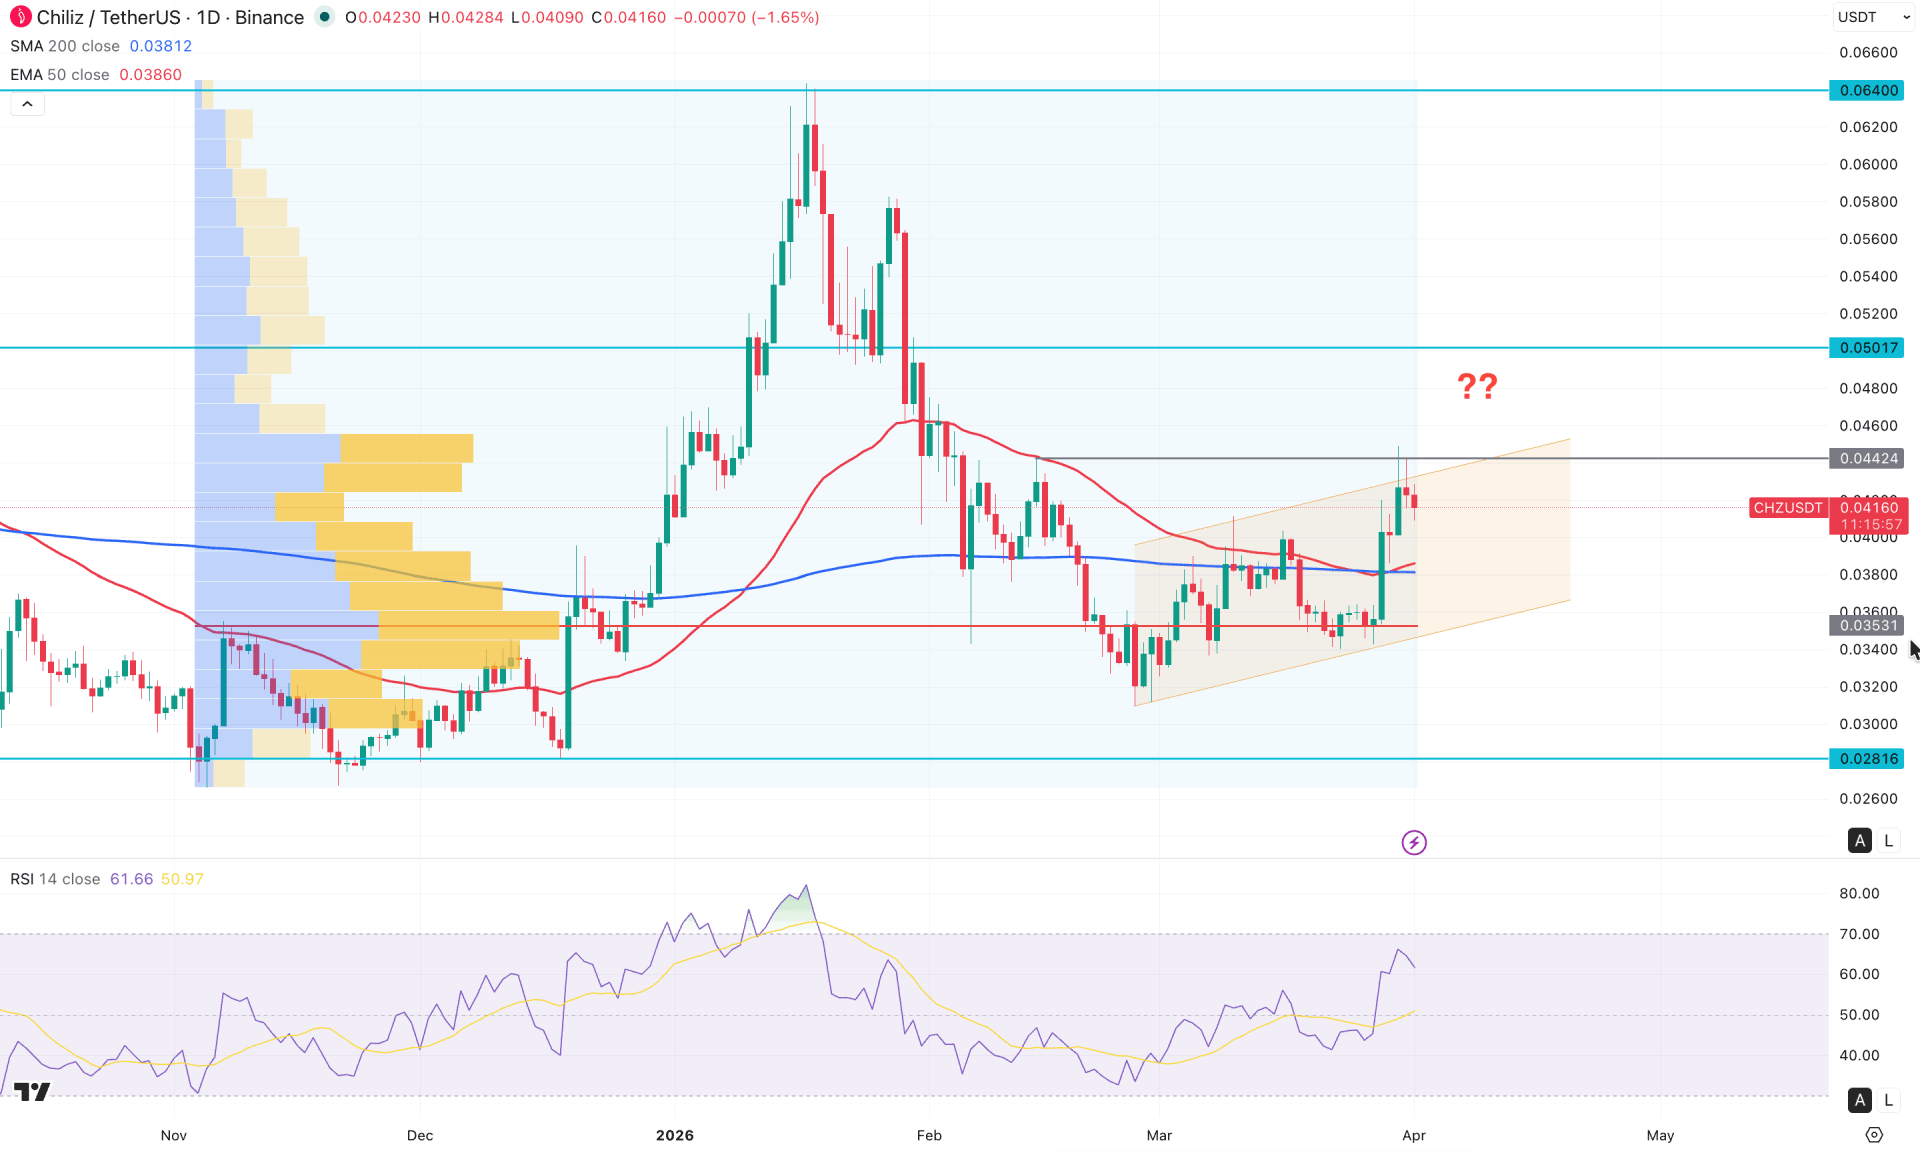
On the daily CHZ/USDT chart, a strong pump-and-dump is visible, with recent price action trading below the 50% Fibonacci retracement level of the existing bearish swing. As the price is currently trading in a discount zone, investors should closely monitor how it reacts to nearby resistance levels before opening any short positions.
CHZ/USDT is trading in an overbought condition, as indicated by the Relative Strength Index (RSI), which is near the 70.00 overbought level. Typically, an elevated RSI at this level signals a potential downside correction; however, further validation from price action is required.
Before focusing further on the daily chart, it is important to assess the higher timeframe context. The monthly chart shows strong consolidation, with recent price action forming an inside bar pattern. As the price is near the existing monthly high, a bullish breakout remains a strong possibility. On the weekly timeframe, a minor buy-side liquidity sweep is visible, while the current price is trading below the key weekly resistance at the 0.0421 level.
In terms of volume, bullish pressure is supported, as the highest trading activity since November 2025 is located below the current price, near the ascending channel support. This suggests that bullish momentum remains intact. However, the price is currently testing the channel resistance, and additional buying pressure is required to confirm a bullish breakout.
On the daily chart, the 200-day SMA remains flat below the current price, signaling mild bullish pressure from a long-term perspective. The 50-day Exponential Moving Average follows a similar structure and has formed a bullish crossover above the 200-day SMA, indicating a potential continuation of the upward trend.
Based on the current market structure, the bullish corrective trend could extend after a healthy bearish pullback toward the 0.0364 level, followed by a valid bullish reversal. Alternatively, an immediate bullish breakout with a daily close above the 0.0460 level could also confirm trend continuation. In both scenarios, the key resistance to watch is the 0.0501 level, which must be breached before targeting the 0.0600 level.
On the downside, minor selling pressure is emerging from the channel resistance, as the price has failed to break above the 0.0442 resistance level. In this case, the price is more likely to form a bearish correction toward the 50-day EMA.
However, extended selling pressure, confirmed by a daily close below the 0.0351 horizontal support level, could accelerate losses and push the price below the 0.0300 region.
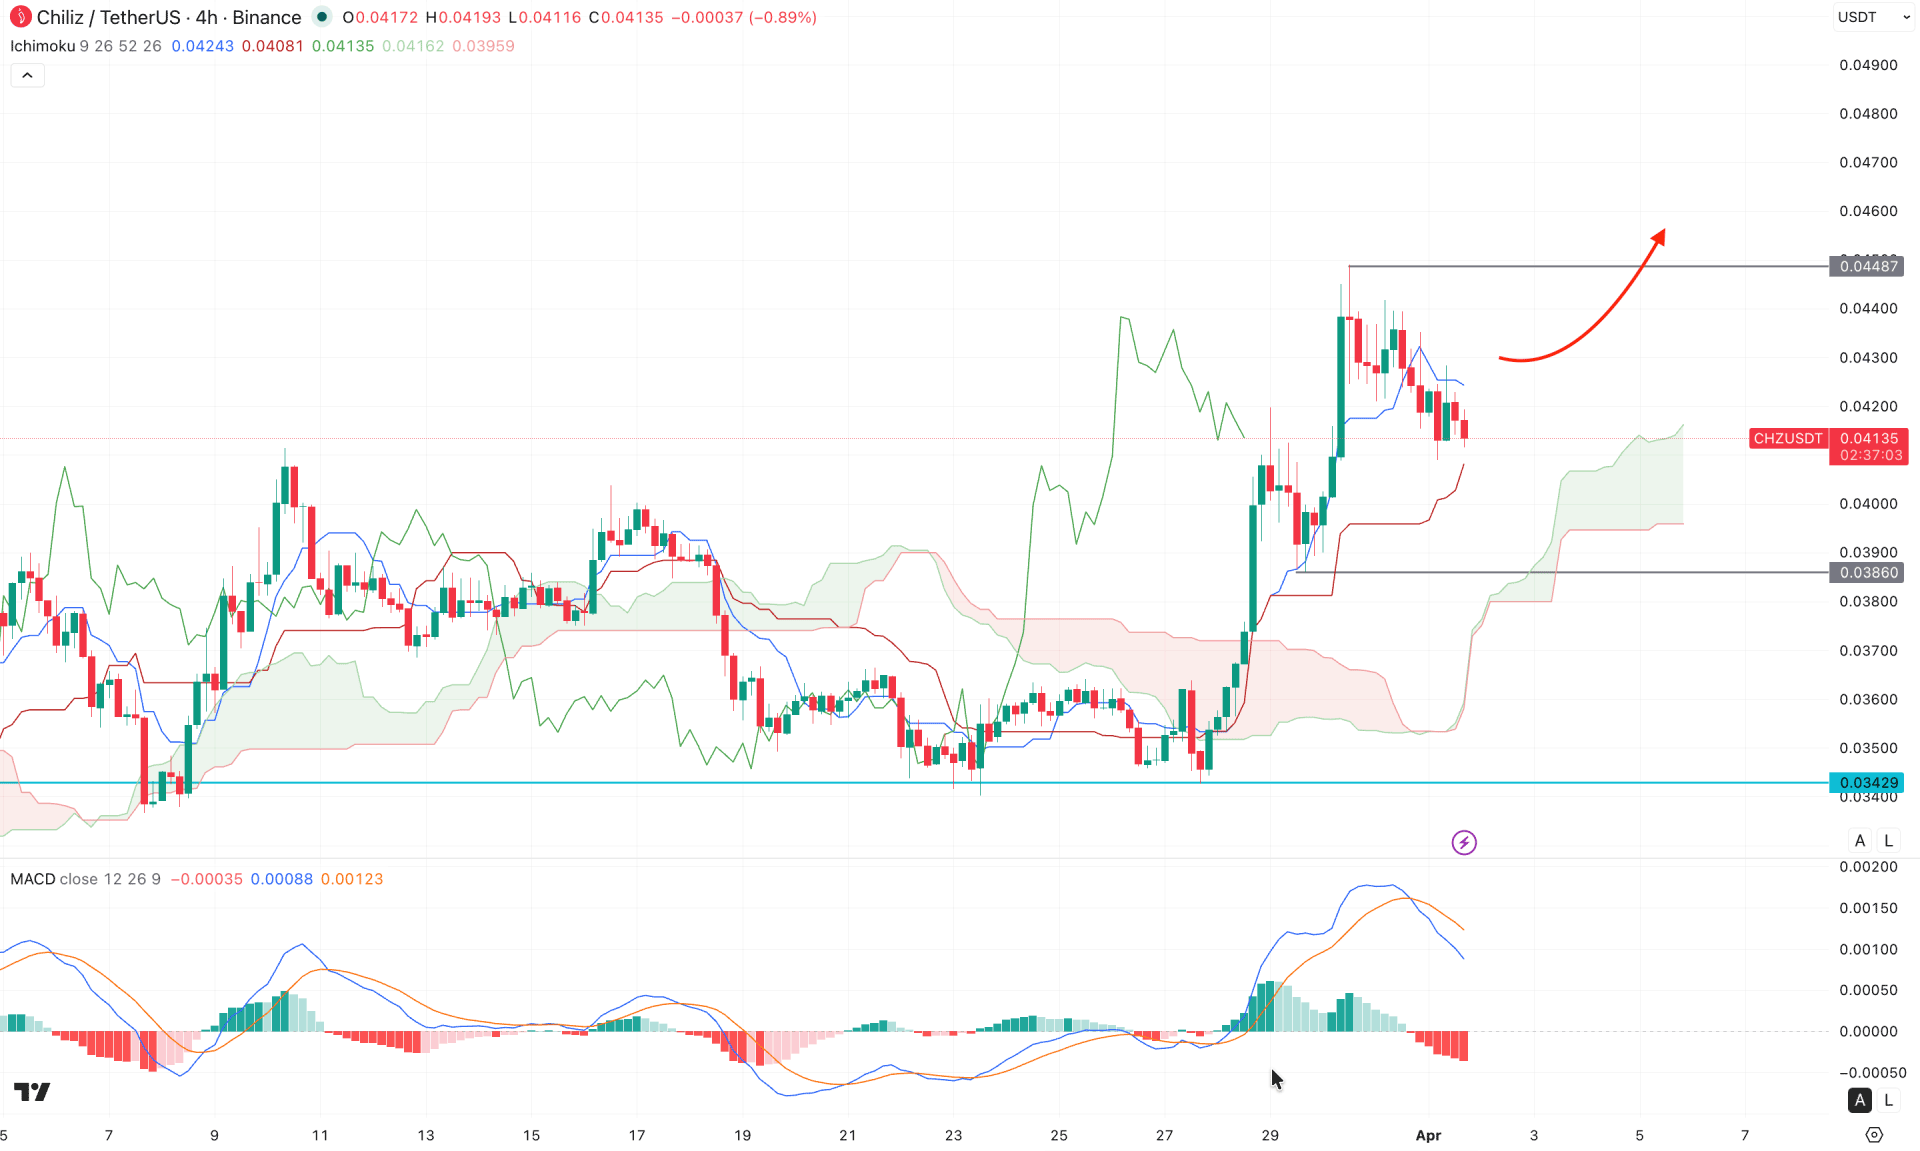
In the four-hour timeframe, CHZ/USDT is trading above the Kumo cloud, suggesting a bullish trend. However, the price recently peaked at the 0.0448 level, from which a downside correction has started below the Tenkan-sen level. Despite this pullback, the future cloud remains positive, as both leading spans are trending upward with a widening gap.
In the indicator window, a bearish crossover is visible on the MACD, with the signal line indicating potential selling pressure on the main chart. The histogram has remained below the neutral level for a considerable period, which may act as an additional bearish signal.
Based on the current market outlook, the ongoing bearish corrective pressure could find support around the 0.0386 level before forming a bullish setup. A valid bullish reversal, confirmed by a four-hour close above the Kijun-sen level, may push the price higher and create a new swing high above the 0.0480 level.
On the other hand, the current buying pressure may weaken if the price fails to maintain momentum above the 0.0386 level. In that case, the next immediate support to watch is the 0.0342 level, followed by the 0.0300 level.
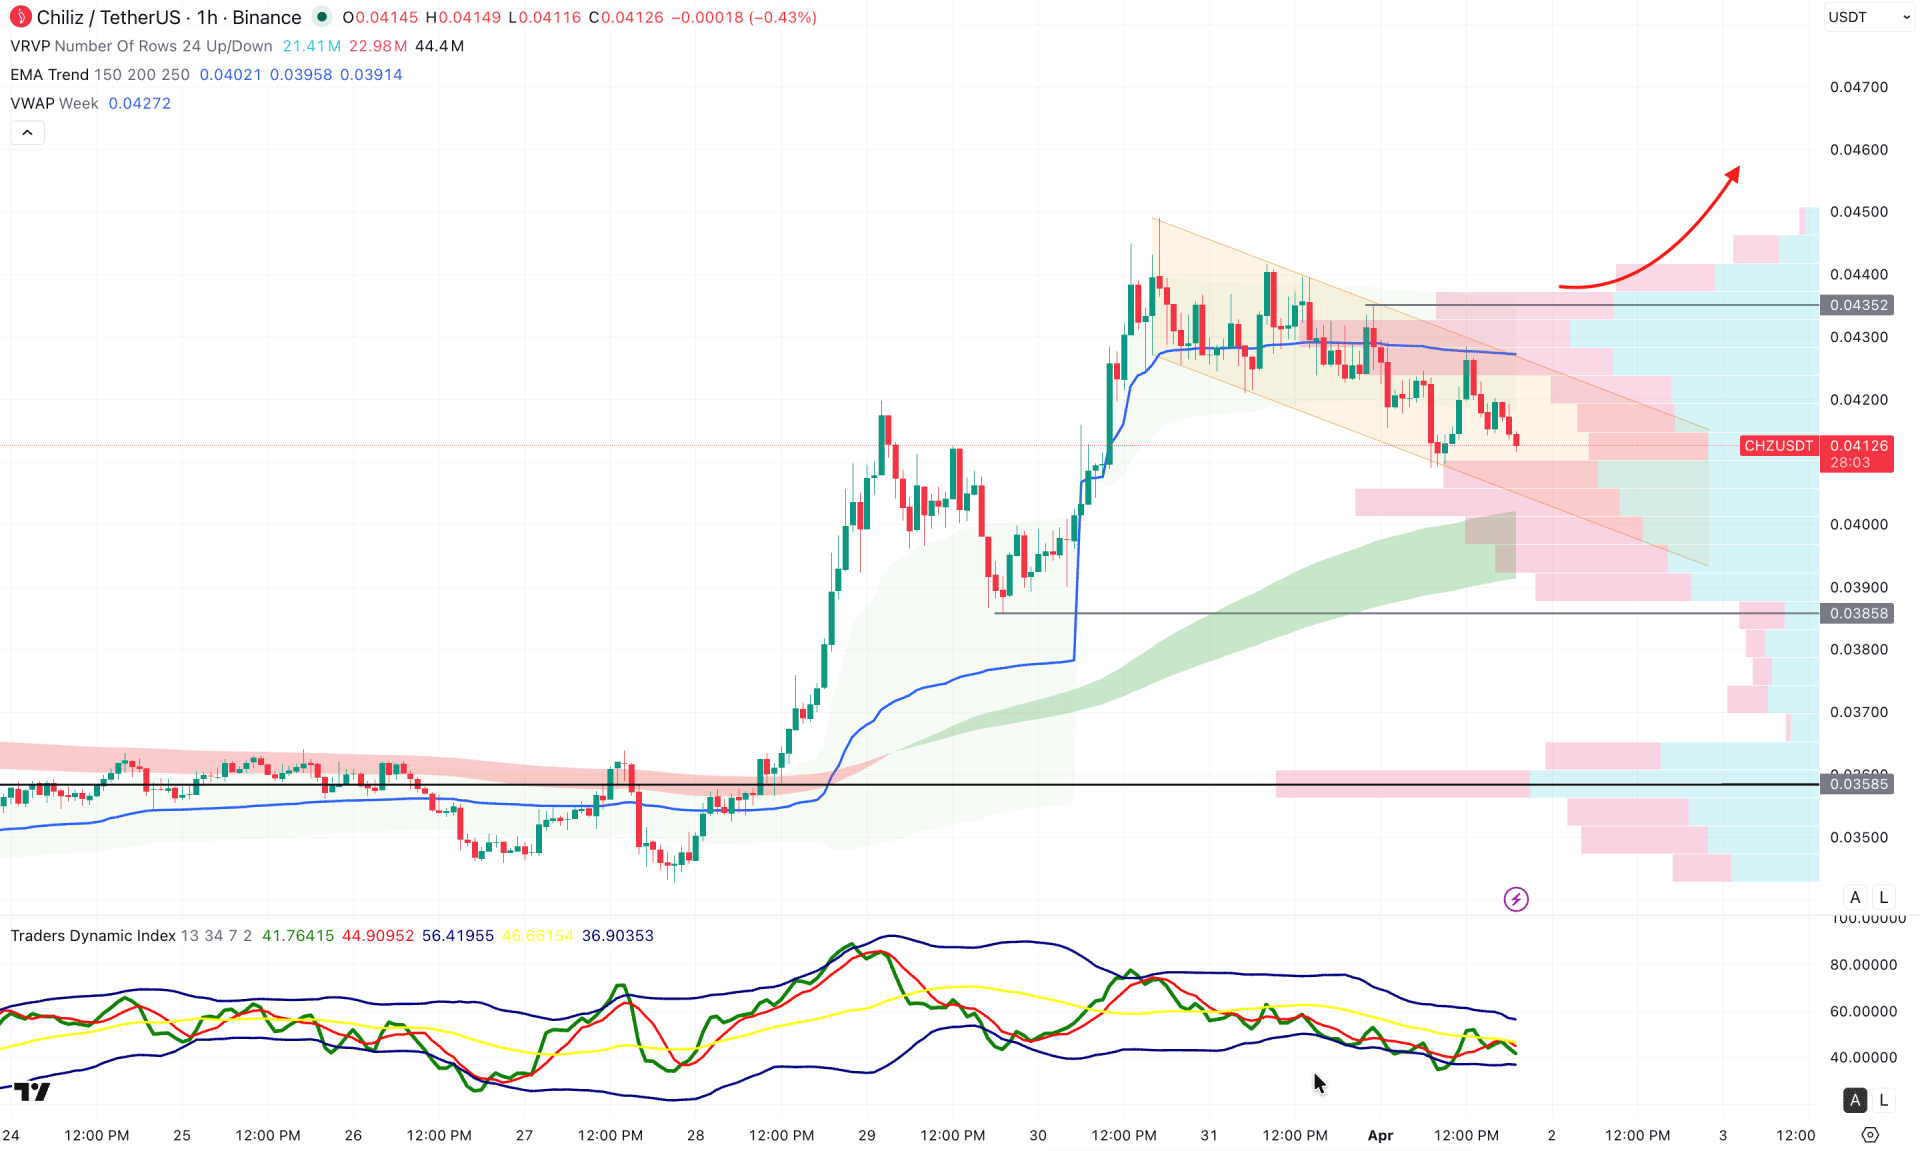
On the hourly timeframe, the recent price action has been moving within a sideways corrective phase inside a broader bullish structure. Moreover, the dynamic EMA wave is positioned below the current price, acting as immediate support. Additionally, high-volume support lies beneath the current price, reinforcing the bullish outlook.
In the indicator window, the Dynamic Index shows weak momentum, with the TDI line remaining below the 50.00 neutral level.
Based on the current market structure, the price is trading within a descending channel, while the weekly VWAP is acting as resistance. In this scenario, the price is likely to move lower and find support around the 0.0385 level.
On the other hand, any strong bullish move with an hourly close above the 0.0435 level could invalidate this bearish outlook and push the price toward the 0.0480 level.
Based on the overall market structure, CHZ/USDT remains in a bullish trend; however, the most recent price has reached a critical resistance zone, increasing the probability of a short-term bearish correction. Investors should wait for a healthy pullback followed by renewed buying pressure before considering long positions.


