
Published: May 29th, 2025
US President Donald Trump's proposed retaliatory trade tariffs were banned by the Court of International Trade on Wednesday, significantly improving risk sentiment worldwide. The court decision is likely to negatively impact the safe-haven Swiss franc (CHF), while Wall Street futures and stocks in Asia spike higher.
On the other hand, the Japanese yen (JPY) has moved away from a significant low against the basket of currencies. The JPY receives some support from predictions that the Bank of Japan (BoJ) will raise interest rates once more as investors process a federal court decision invalidating US President Donald Trump's "liberation day" trade penalties.
In the meantime, traders continue to factor in the potential for the Federal Reserve (Fed) to intervene in 2025 to boost economic expansion and further reduce borrowing prices. This represents a significant departure from hawkish BoJ forecasts, which may even help the lower-yielding JPY. However, a new wave of global risk-on trading may prevent traders from putting new bullish wagers on the safe-haven, the Japanese yen and serve as a push for the CHFJPY exchange rate.
Let's see the further outlook from the CHFJPY multi-timeframe analysis:
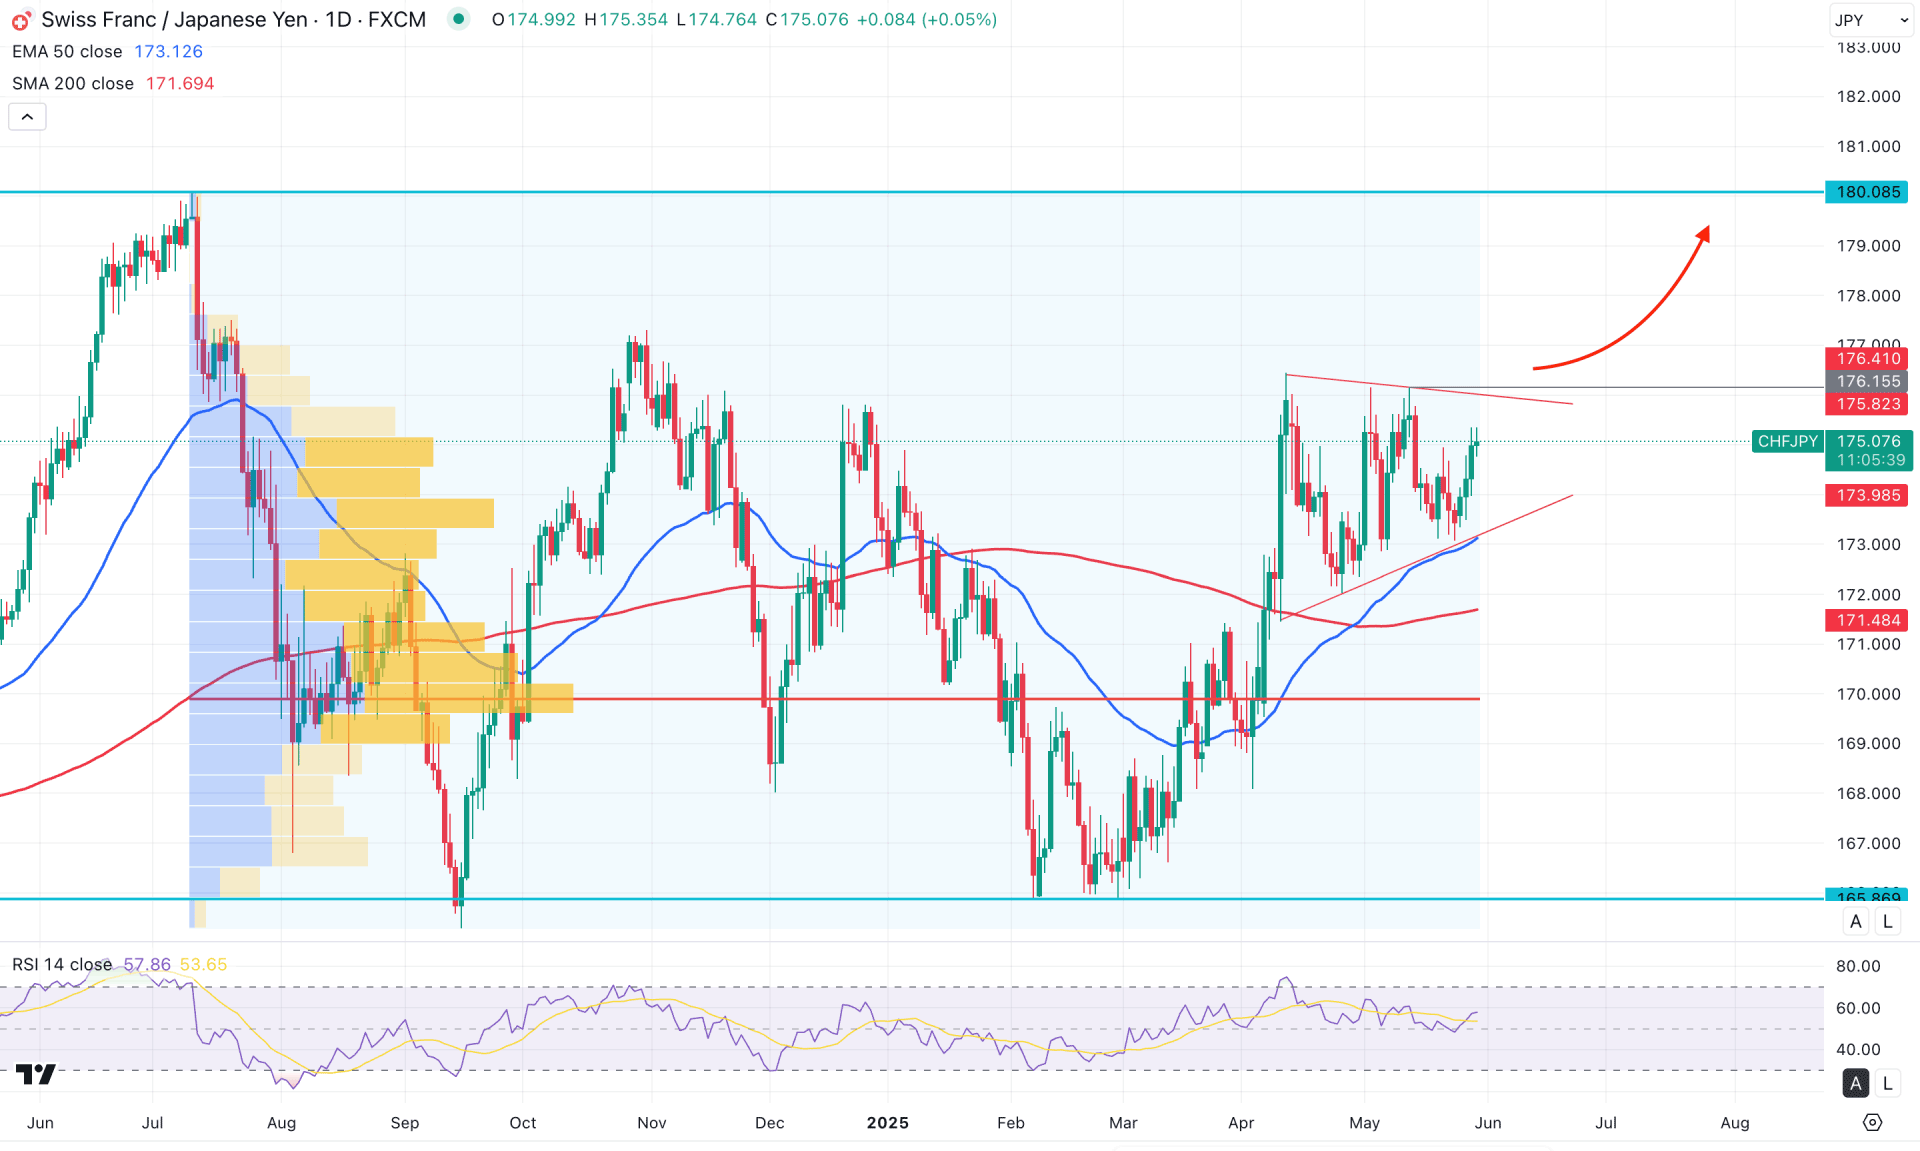
On the daily chart of CHFJPY, the market momentum is currently sideways after forming a bottom at the 165.89 level. The price created a bullish V-shaped recovery but lacked a clear directional trend after peaking at 176.44. Most recently, the price has been consolidating within a symmetrical triangle pattern. A valid breakout from this structure could establish a stable trend after sweeping liquidity.
On the higher time frame, the bullish rebound in March 2025 was a valid reversal signal, pushing the price higher for three consecutive months. Additionally, the weekly chart shows no signs of a downside correction, even though the price is trading in a premium zone. In this context, a valid sell-side liquidity sweep on the lower time frame, followed by a confirmed market reversal, could present a trend continuation opportunity.
The most active level since July 2024 lies below the triangle's lower boundary, acting as a key support zone. We may anticipate continued buying pressure until a high-volume level is established below the current structure.
The main price chart indicates strong bullish momentum, highlighted by a golden cross continuation pattern. The 50-day EMA aligns with the triangle support, suggesting sustained upward pressure. If the 50-day EMA remains below the current price, we may expect buying momentum to continue.
In the secondary indicator window, the Relative Strength Index (RSI) aligns with price action, holding above the 50.00 level for a considerable period. The RSI may continue to find support at the 50.00 line, with the main target being a move beyond the 70.00 overbought zone.
Based on the daily market outlook for CHFJPY, the primary target is to test the 176.15 resistance level before confirming any further trend direction. A failure to hold above the 176.15 level, followed by a bearish move below the 50-day EMA, could trigger a broader consolidation, potentially targeting the 170.500 area.
On the other hand, a minor bounce from the triangle support, particularly from the dynamic 50 EMA zone, could lead to a bullish reversal. A confirmed bullish reversal from the 173.50 to 172.50 zone would be significant in that case. However, an immediate bullish breakout with a daily candle closing above 176.15 could also extend the momentum toward 180.08. In both scenarios, the ultimate bullish target lies at the 183.50 level, corresponding to the 261.8% Fibonacci extension of the existing triangle swing.
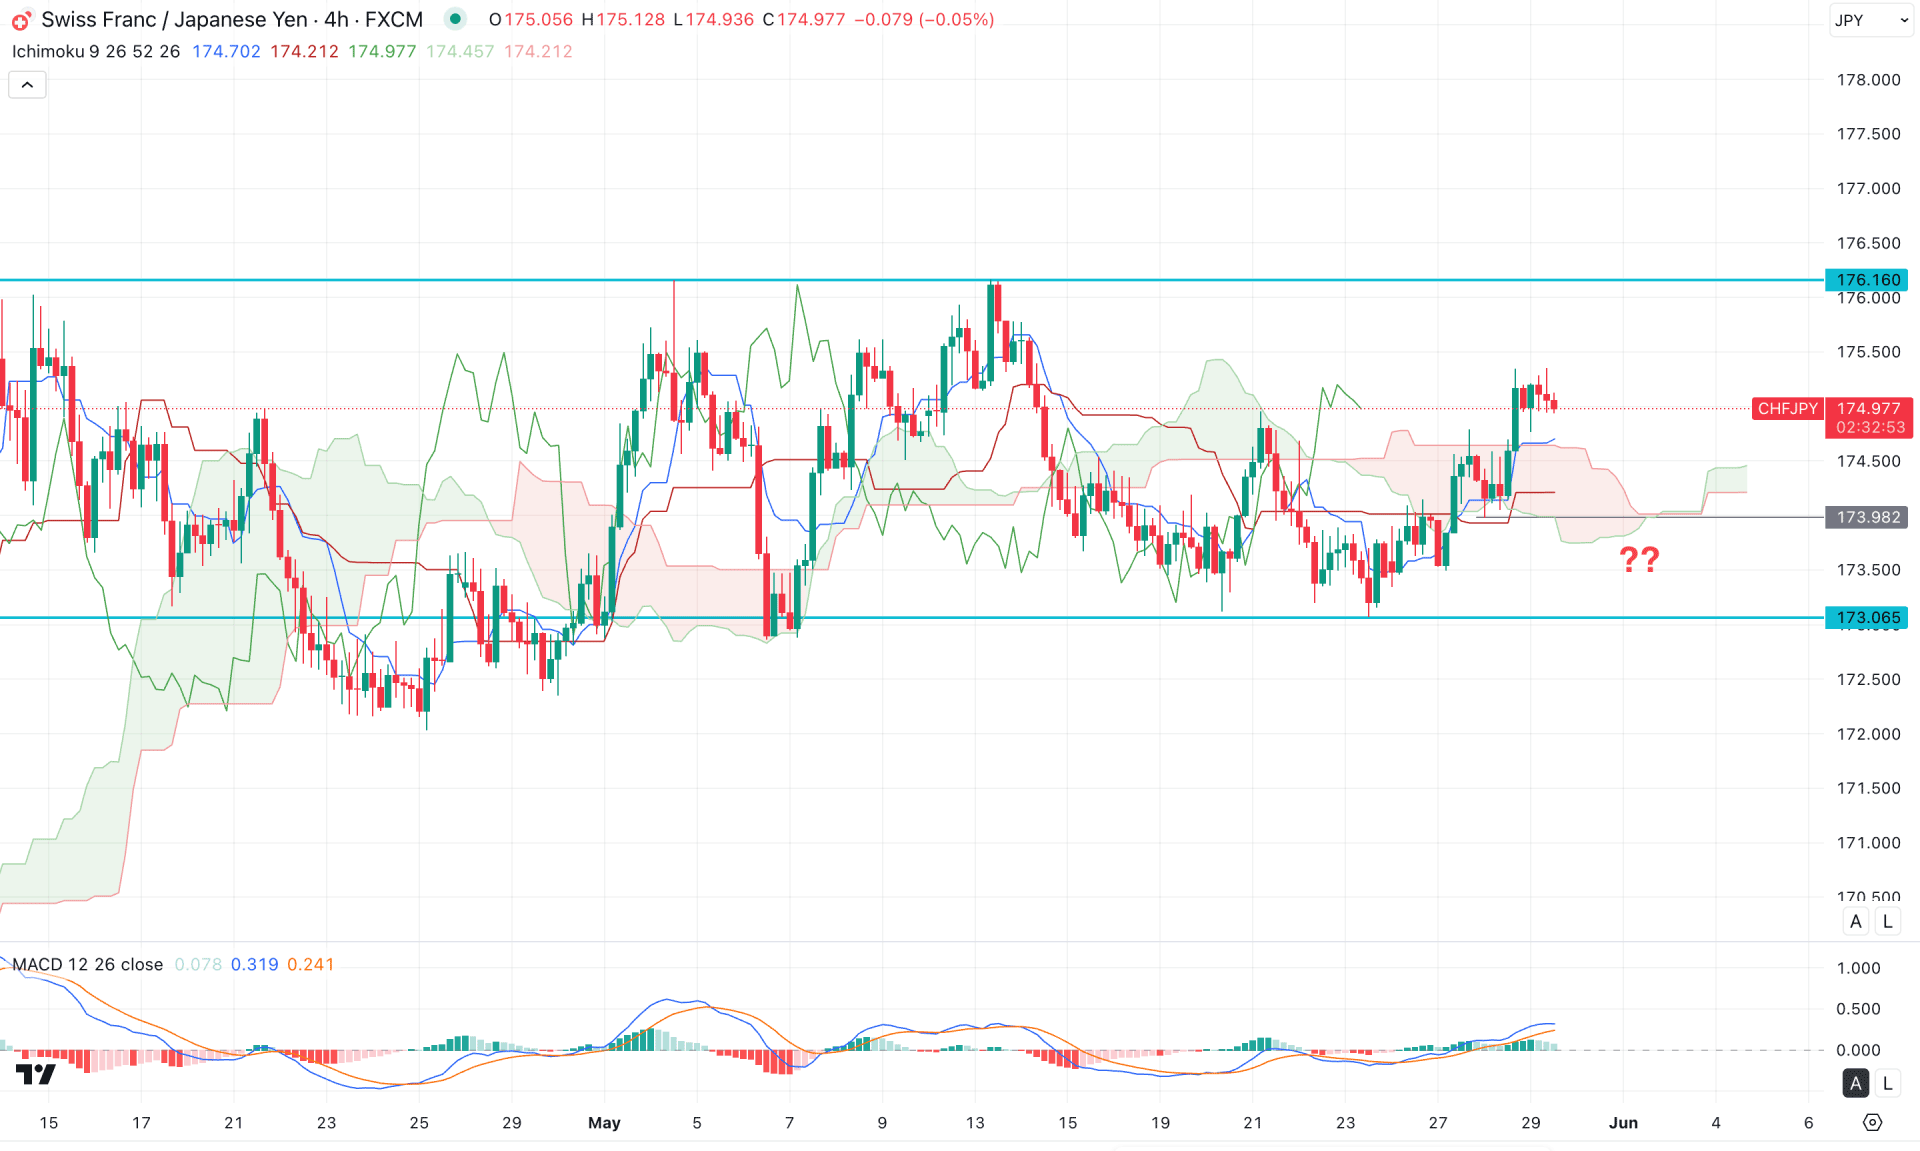
In the H4 timeframe, the recent price movement has been sideways, with the Ichimoku Kumo Cloud below the current price and working as strong support. Although the current price is trading above the cloud area, more confirmations are needed before anticipating a trend change from the range-bound market.
On the other hand, the Future Cloud shows a bullish continuation opportunity as both Senkou Span lines are aiming higher.
In the secondary indicator window, the MACD Histogram hovers at the neutral line, which signals a sideways momentum. Moreover, the signal line is at the positive zone from where further upside pressure is limited.
Based on the H4 market outlook, a minor downside correction is pending but any bullish reversal from the Kijun Sen could be an immediate long opportunity.
In the current scenario, the Kumo Cloud would work as a crucial bull hurdle. A solid downside recovery below this line could limit the upward momentum and lower the price in the coming session.
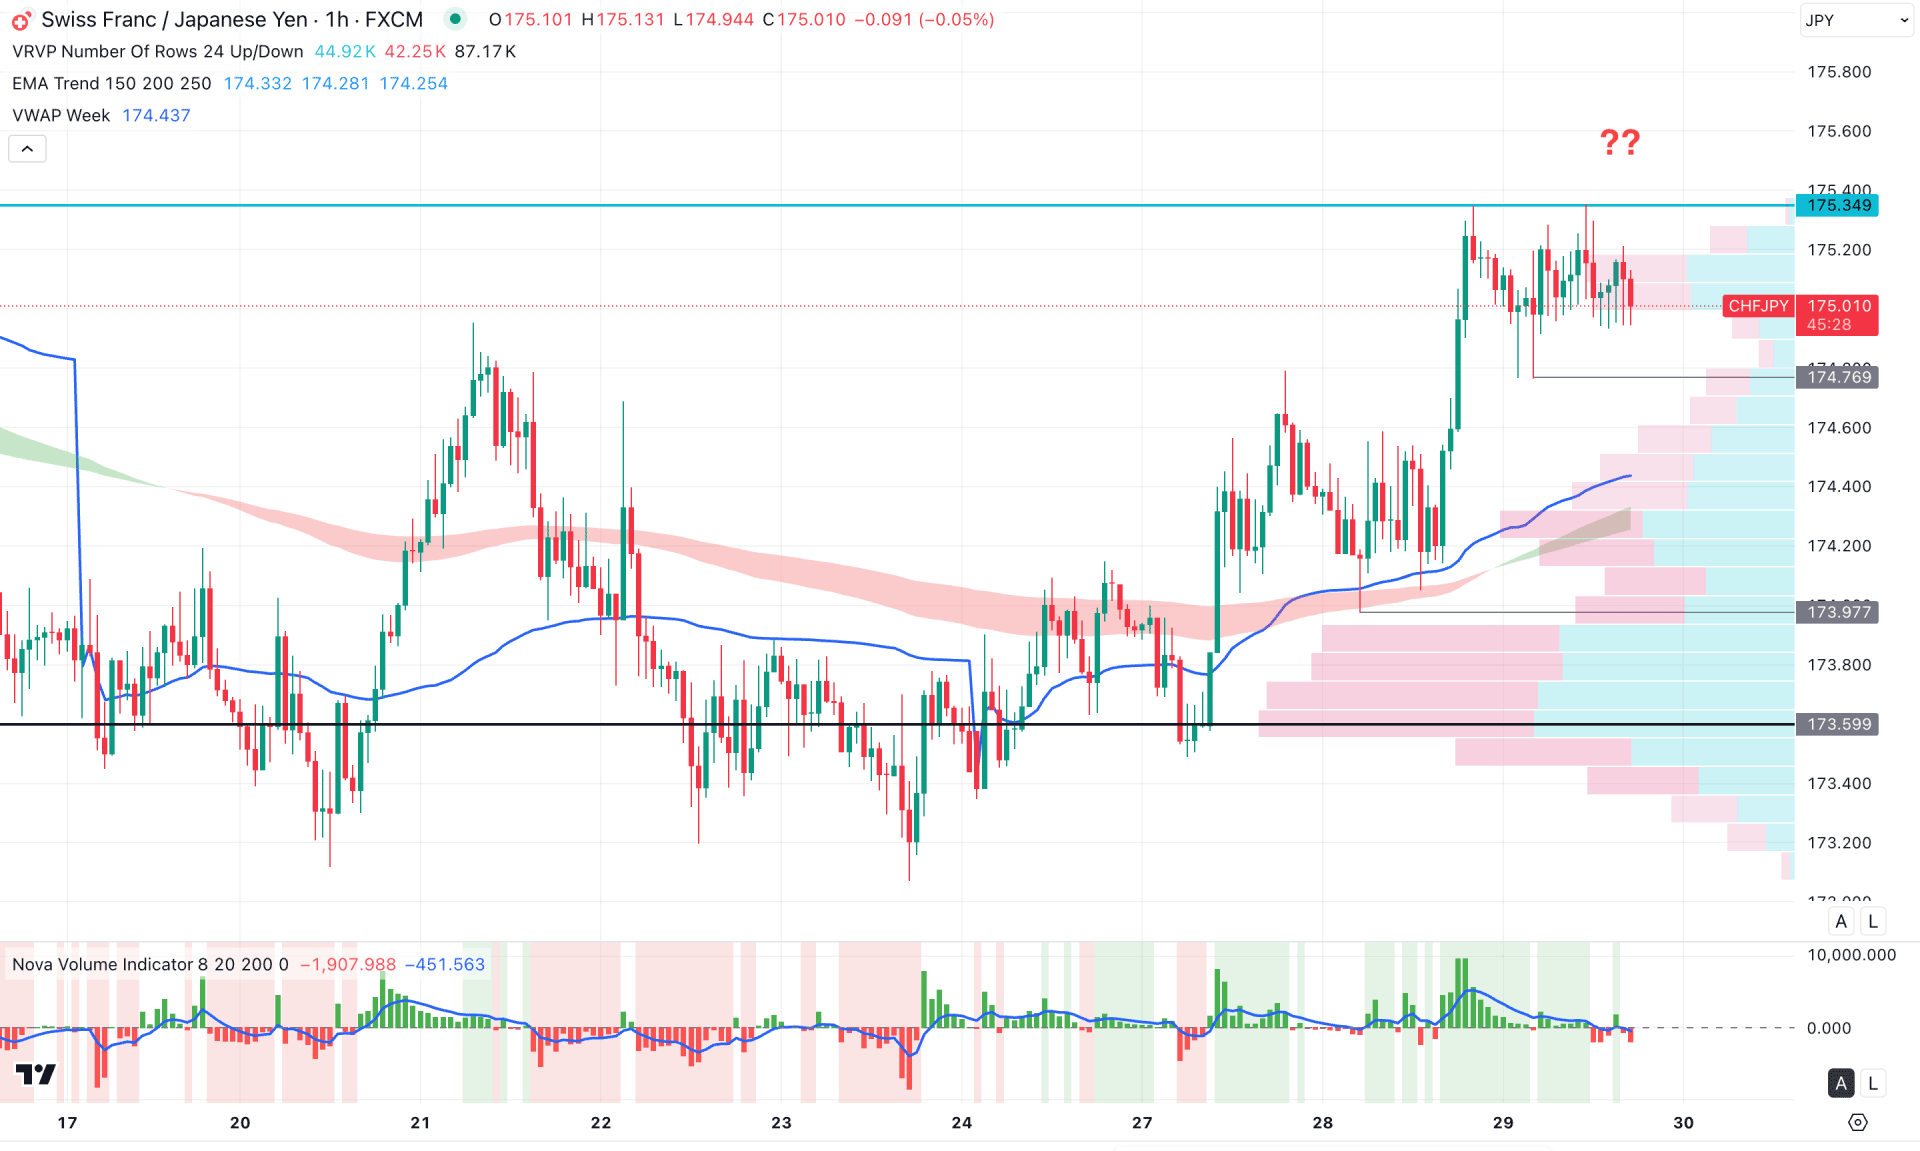
On the hourly time frame, the current price is trading at the session high, where a higher volatility is visible, although no significant high has been formed at the top. The gap between the dynamic weekly VWAP and price has widened. A period of sideways movement has created a double top formation, but proper validation is still needed from the 174.76 low.
In the secondary indicator window, the volume histogram has already flipped position and moved into the bearish zone, signalling high-volume seller activity in the market.
Based on this outlook, an extensive double top liquidity zone is above the 175.34 level. In this case, any immediate buying pressure above that level, followed by a recovery below the VWAP line, could present a bearish opportunity targeting the 173.90 and 171.10 levels.
On the other hand, any immediate selling pressure below the 174.76 level could signal a bullish continuation opportunity, which might need confirmation from the moving average wave. In that case, a bullish reversal setup from around 174.60 to 173.97 is possible, aiming for the 177.00 area.
Based on the ongoing multi-timeframe analysis, CHFJPY is trading within a bullish pre-breakout structure. Any bullish reversal from the triangle support could offer an early long opportunity. However, immediate buying pressure above the 175.34 resistance level could be an alternative bullish approach, depending on price action.


