
Published: April 9th, 2026
Swiss inflation reached its highest annual rate of 0.3% in March, driven by a recent spike in oil prices, which weakened the CHF and eased pressure on the Swiss National Bank to change policy. For the third continuous meeting in March, the SNB maintained its key rate at 0% and reaffirmed its willingness to limit Franc appreciation.
Currently, the SNB is under less pressure to return to negative interest rates due to rising inflation in Switzerland.
Speculation about a near-term interest rate increase by the Bank of Japan was heightened by the positive Japanese Labor Cash Earnings data released earlier this week. On Tuesday, Seiji Adachi, a former board member, supported this possibility. The Yen recovered from its minimum on Wednesday, but the rise was brief.
Let's see the further outlook of this instrument from the CHFJPY technical analysis:
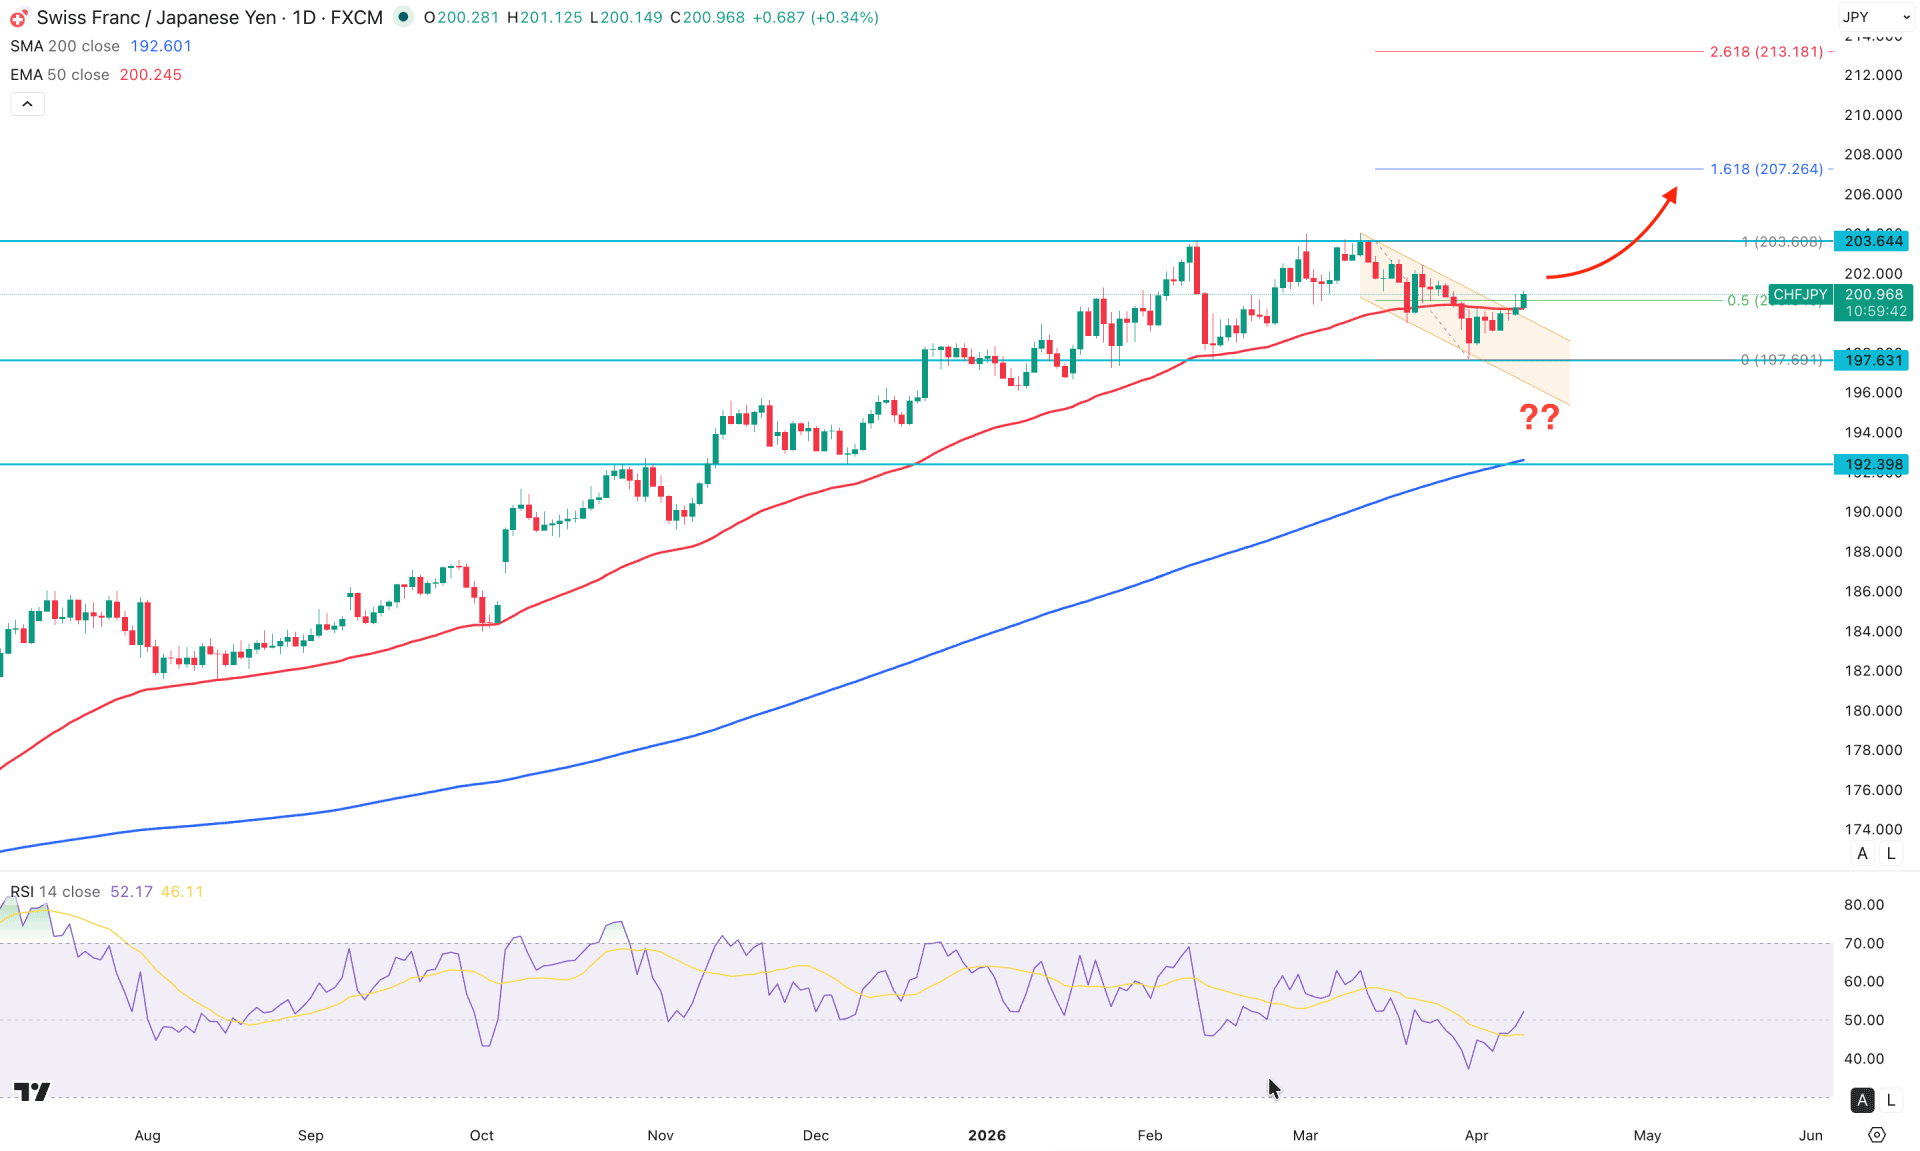
In the daily chart of CHFJPY, a prolonged bullish trend is visible since the beginning of 2025. However, the recent price shows extended volatility after reaching the peak at the 204.04 level. As the price is trading within a rectangle pattern, a bullish momentum is visible, as multiple bullish rejections are present at the pattern support.
Looking at the higher timeframe, the monthly candle suggests strong selling pressure with an engulfing bearish formation in March 2026. However, the price failed to break the existing monthly low; instead, it continued higher above the 50% level of the engulfing candle. The weekly price shows a bullish continuation signal as it broke above the existing weekly high with a sell-side liquidity sweep.
In the daily price, multiple bullish daily candles are present above the descending channel resistance, which is still a valid channel breakout supported by a rising exponential moving average at the bottom.
On the other hand, the 200-day SMA remains below the entire structure with an upward slope, which signals a long-term buyers' presence in the market.
In the indicator window, the relative strength index shows a similar structure with an opportunity to move to the overbought 70.00 level. The average directional index also remains above the 20.00 line, signaling a strong trend formation.
Based on the daily market outlook and ongoing bullish pressure, a hold above the 50-day EMA could increase the possibility of testing the 203.64 resistance level. Moreover, a break above 203.64 could open room for reaching the 212.00 level.
On the other hand, the price is yet to retest the channel breakout point before validating a long move. However, any immediate reversal with a daily close below the channel resistance could increase the possibility of testing the 196.13 support level before moving higher. An extended bearish correction is also possible toward the 192.39–191.00 zone, which is closer to the 200 SMA.
On the bearish side, immediate bullish pressure with a failure to break the 203.64 level may initiate a minor downside correction. However, a stable bearish trend might come with a break below the 195.00 psychological level with consolidation. In that case, the price might test the 187.50 level in the coming days.
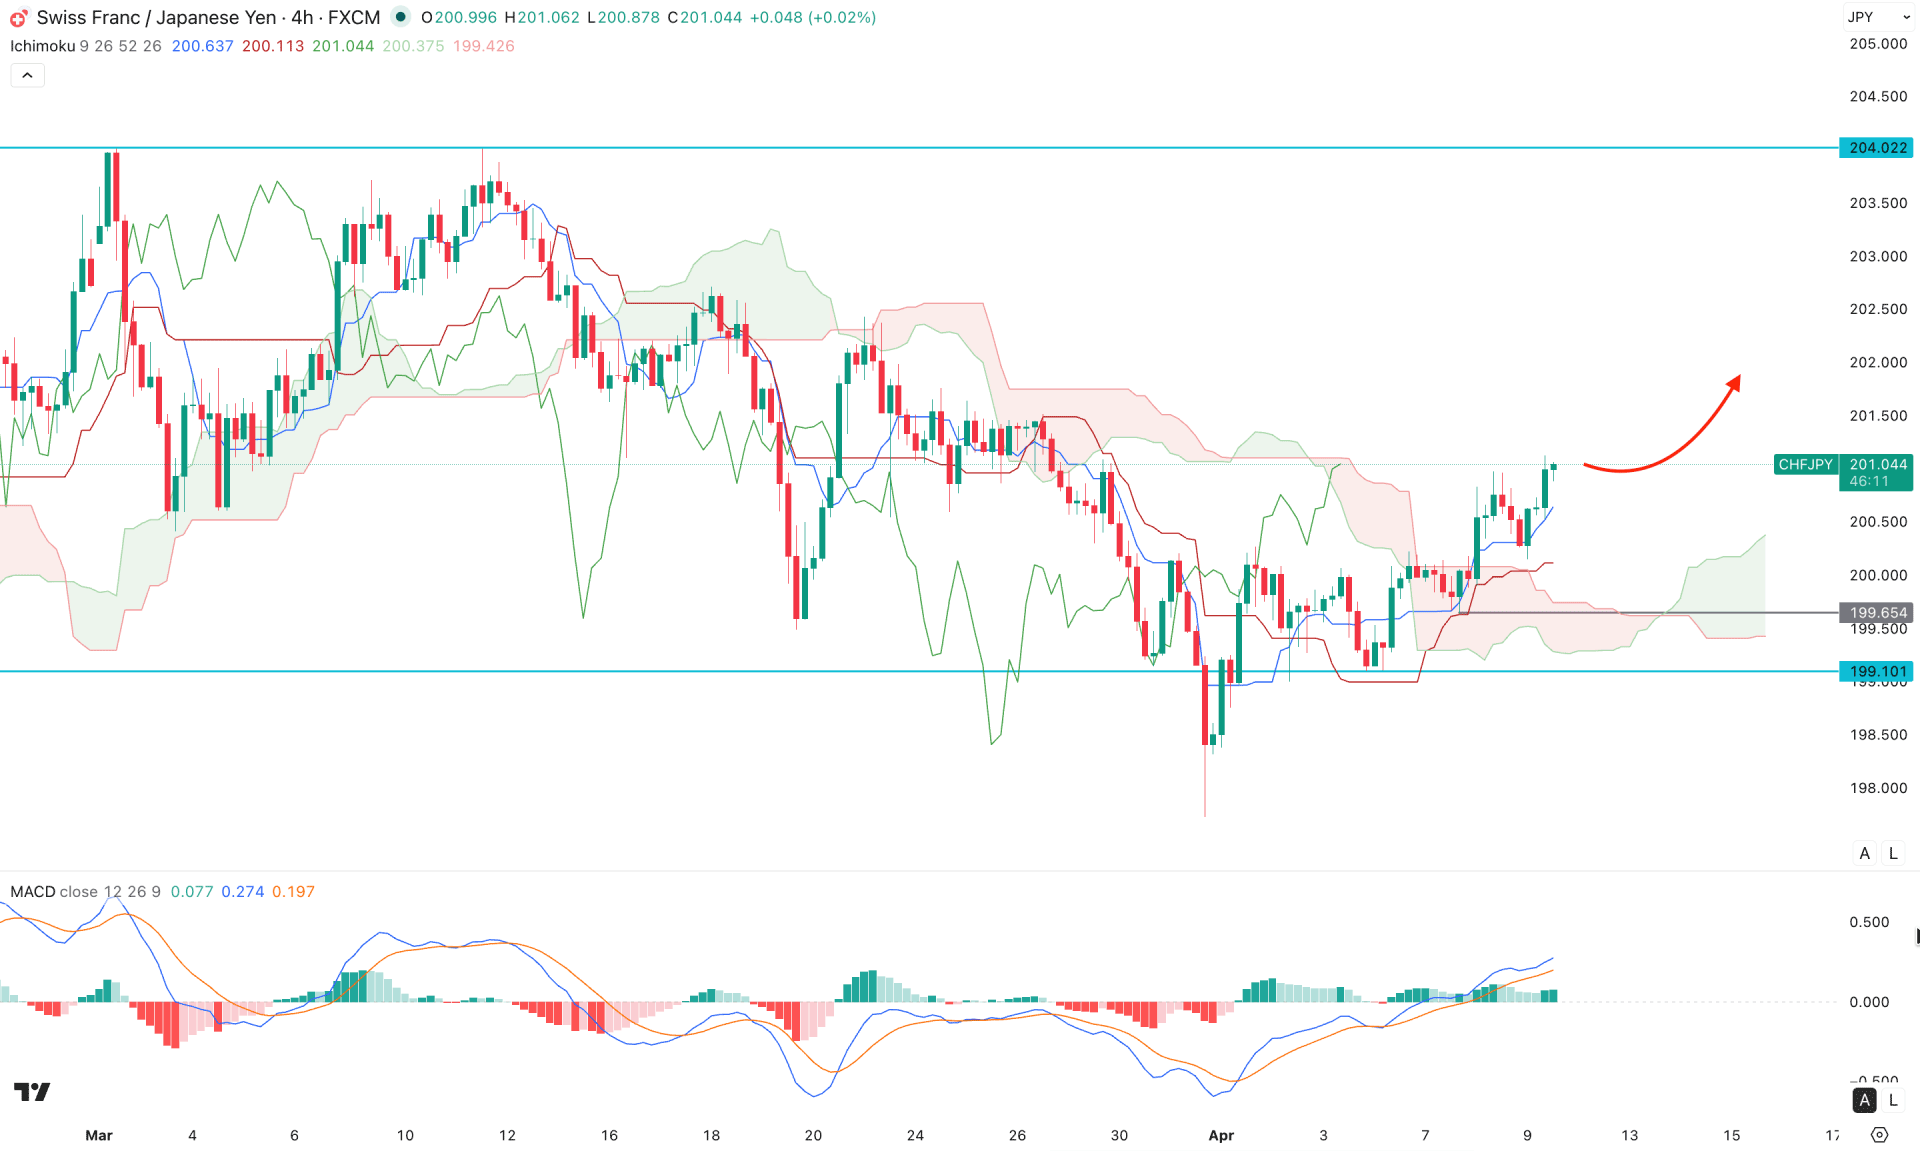
In the four-hour timeframe, the most recent price shows a bullish breakout above the cloud area, signaling a potential trend reversal. Moreover, the price tested the dynamic support above the Kumo cloud, which signals a strong continuation move. The future cloud also supports the buying pressure, where both lines are heading upward in a bullish continuation formation.
In the indicator window, the MACD histogram is hovering above the neutral line with a proper bullish formation. Moreover, the signal line is in the bullish area with no sign of a top formation.
Based on the market structure, the primary aim for this pair is to look for long trades as long as it remains above the dynamic cloud support. The immediate resistance is at the 202.40 level, which must be overcome before heading toward the 204.02 level.
On the other hand, a deeper bearish correction is possible to the 200.00 psychological level, but a break below the 199.10 support level might open room for moving toward the 197.74 low.
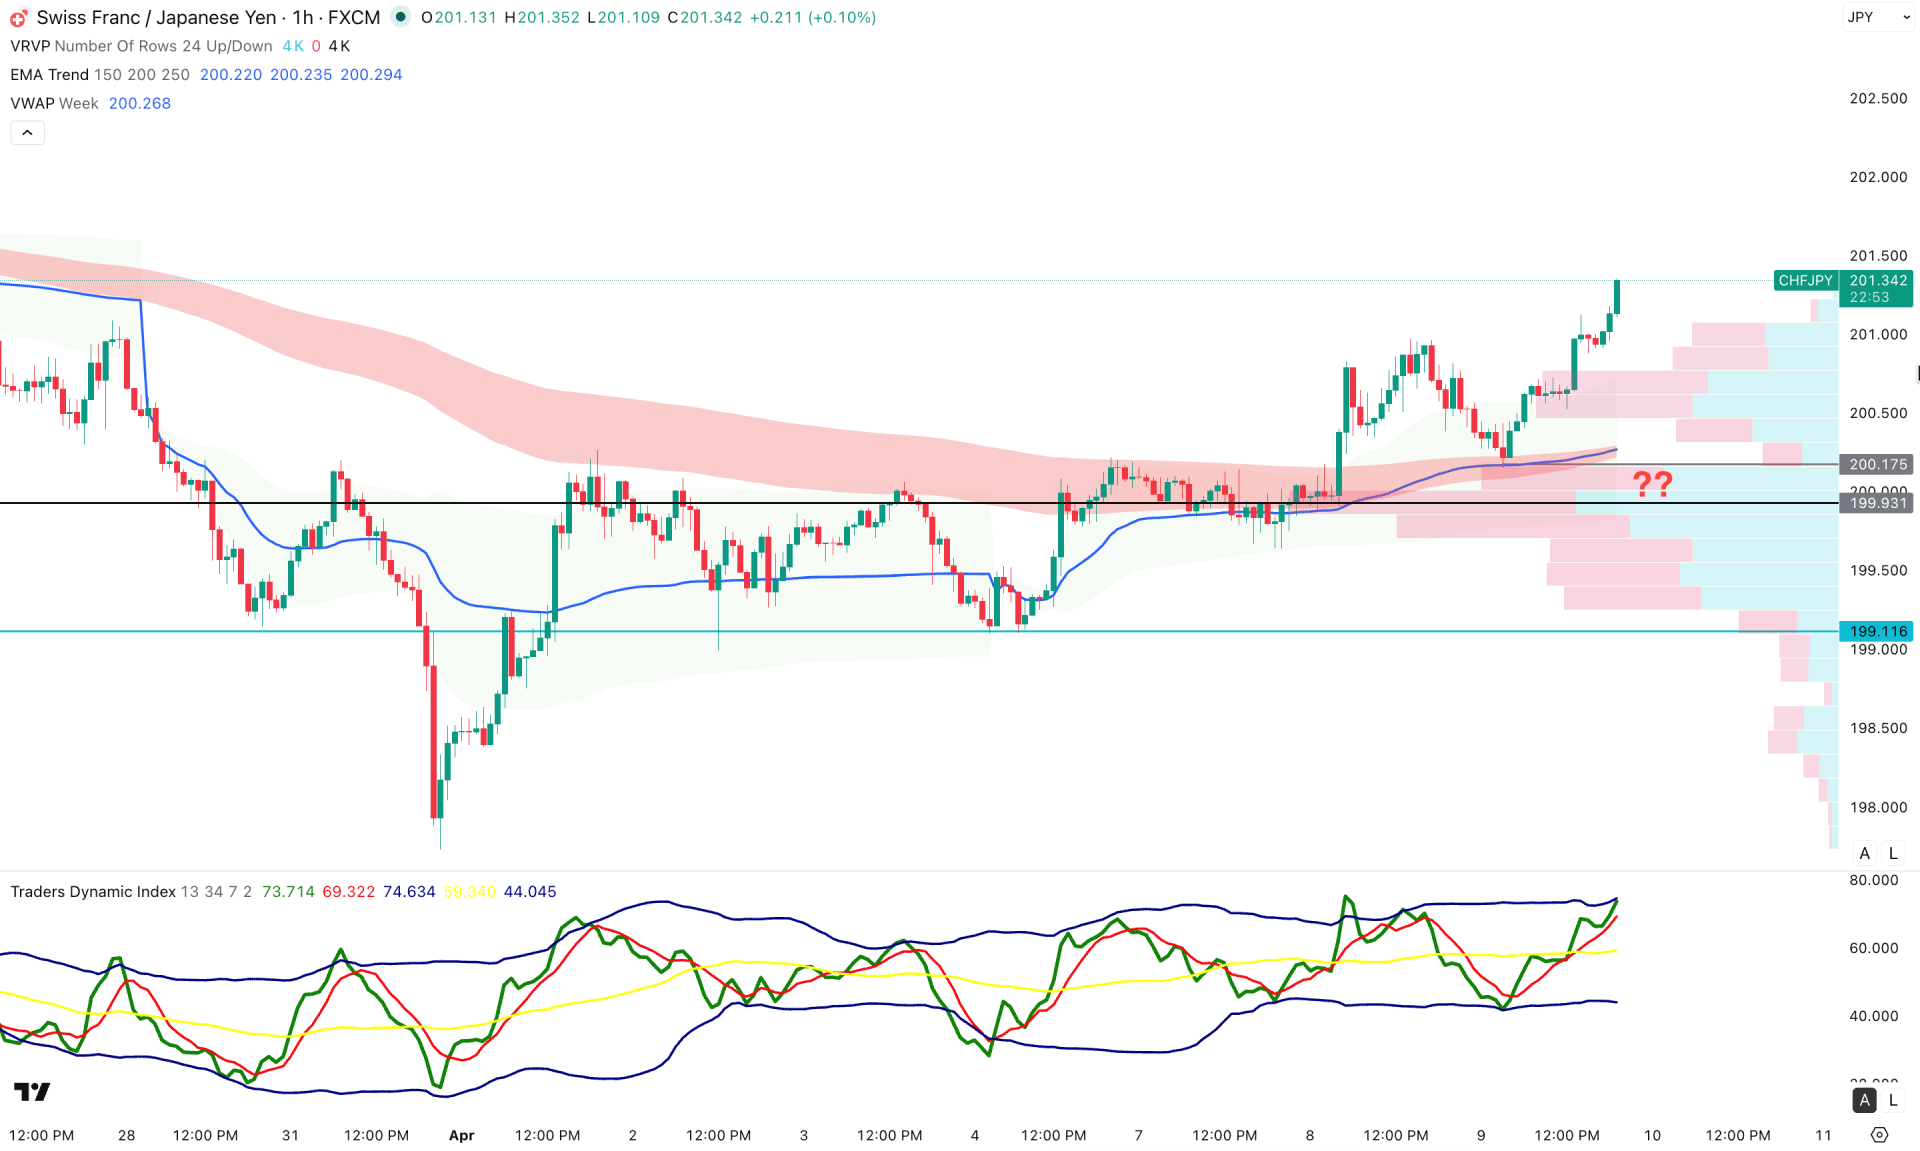
In the hourly timeframe, buying pressure is seen after a strong sell-side liquidity sweep from the 199.11 swing low. After a valid bullish recovery, the price consolidated before creating a new swing high above the 201.00 level.
As per the current findings, the price tested the EMA and weekly VWAP levels before creating a new swing high, which signals further upward continuation opportunity.
The indicator window shows a similar structure, as the current TDI line is above the 50.00 neutral level.
Based on the overall market structure, the intraday market momentum is bullish as the existing swing high has been taken. In that case, the price is likely to extend the buying pressure after a minor pullback. Immediate support is at the 200.50 level, which can be tested before heading toward the 202.60 area.
On the other hand, the high-volume support level is at 199.93, which can be tested for a deeper correction. A break below the 199.93 level with consolidation might increase the possibility of testing the 199.11 level in the coming hours.
Based on the overall market outlook, the fundamental direction is at odds with the technical outlook, suggesting a potential divergence. However, the bullish momentum is solid and one more push to the rectangle high is possible. Any sign of exhaustion at the top could be the first sign of a trend reversal, which needs to be validated by the price action.


