
Published: November 8th, 2022
In Japan, September's preliminary industrial production data declared a fall of -1.6% m/m with 4.5% y/y vs. in Aug 5.8% y/y. During the same period, consumption occurred better than production as it gained 4.5% y/y and 1.1% m/m. Also, the Finance Ministry declared spending 6.3 trillion JPY ($42.5bn) on currency intervention in Oct.
On the other hand, the total deposit in SNB for the week ending on 28 Oct came in at CHF581.6bn vs. the previous week’s CHF 597.6bn. The bank continues to sell dollars and euros as investors move their funds away. Since the year began, SNB reported a total loss of CHF597.6bn in nine months. A fatal combination of Swissy strength and rate hikes caused a loss in foreign investments for the bank.
Oct CPI was 3% y/y vs the expected 3.2% and lowered from 3.3% y/y in Sep. A continuous second month of decline as inflation proceeded slowly toward SNB’s target of 1.8% y/y core steady.
The buying pressure in CHFJPY could increase as the broader market trend is bullish. Let's see full price projection from the CHFJPY technical analysis:
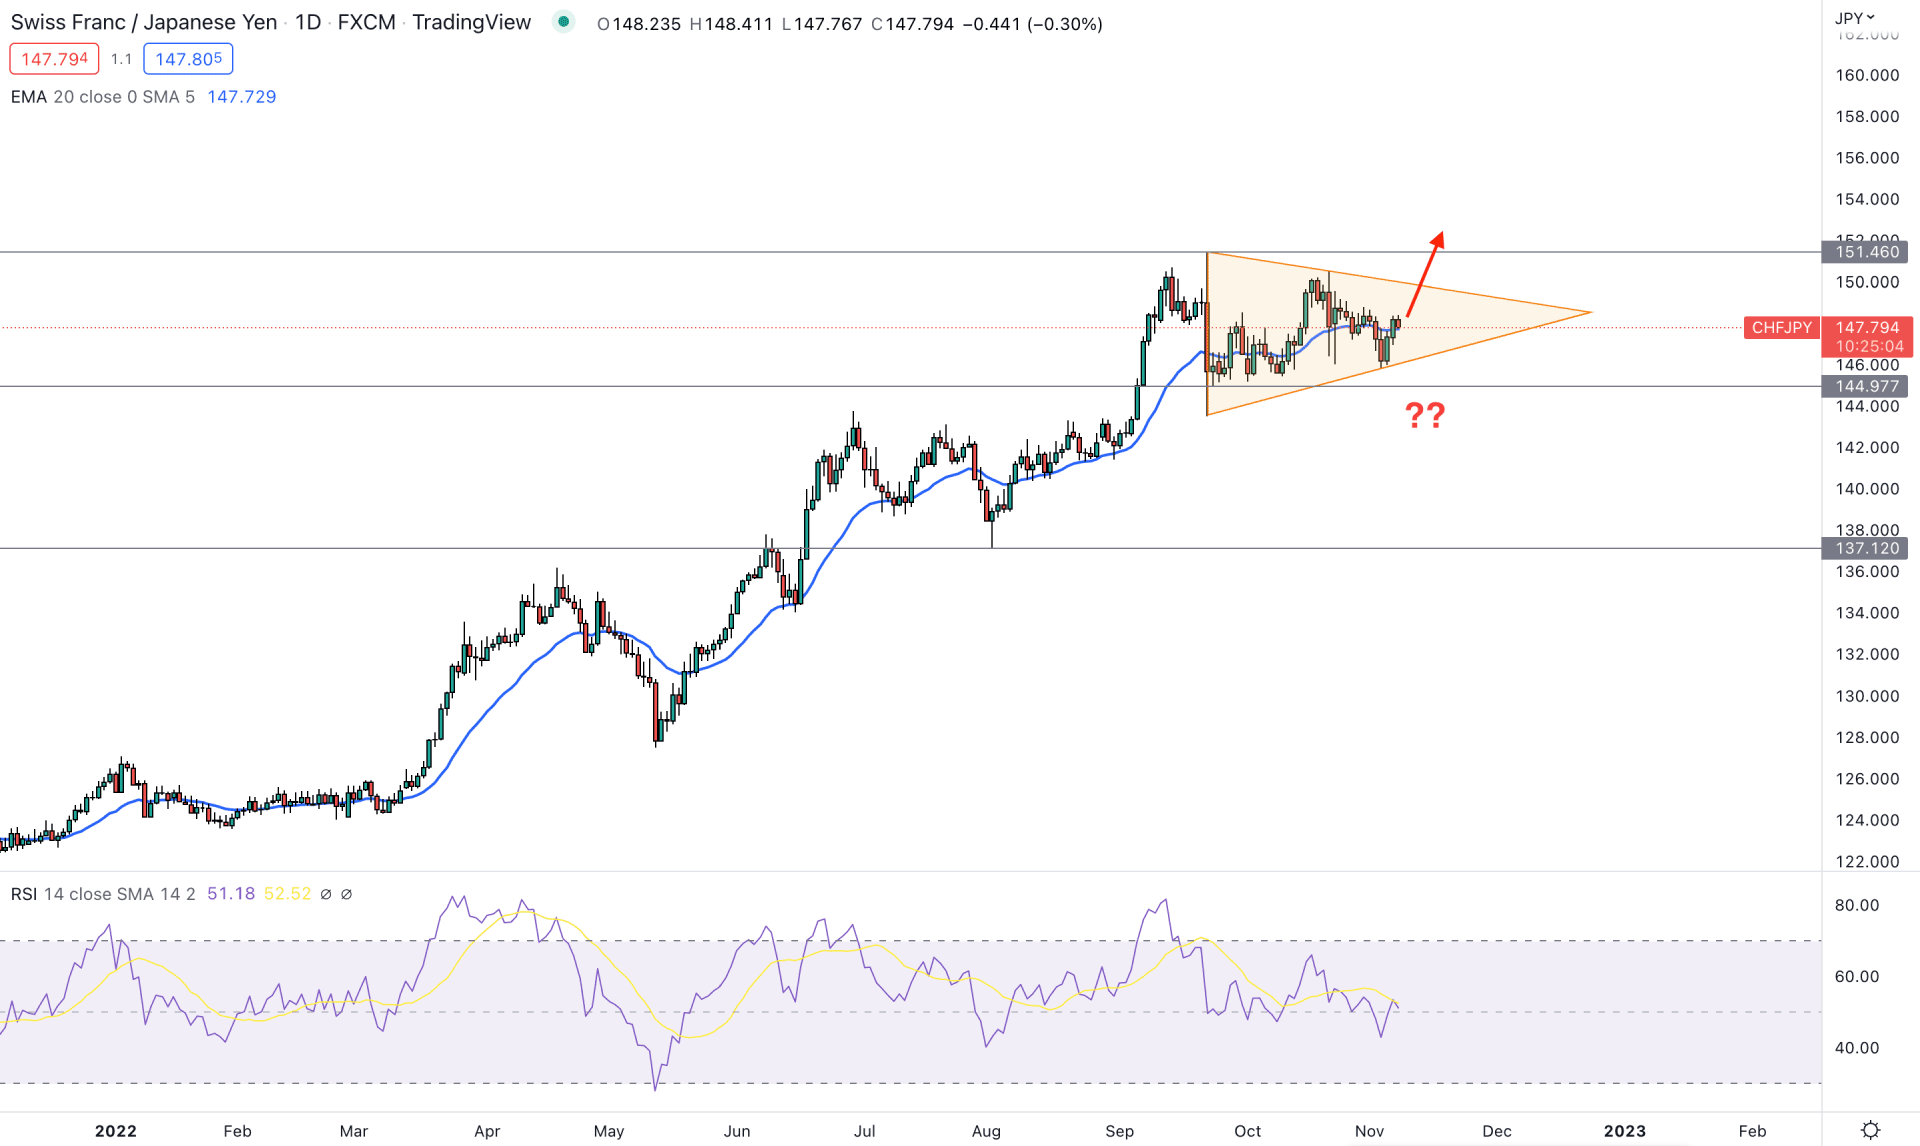
In the CHFJPY, the broader market outlook is clearly bullish; the price is aiming higher by creating higher highs.
The most recent excessive selling pressure on 22 September, from the 151.46 level, failed to hold the momentum. After making a bearish daily candle with 777 pips lower, the price went sideways within a symmetrical triangle. Instead of making a new swing low, the corrective price action provided a sign that bulls are still active in the market and can regain momentum at any time.
In that case, the primary approach in this pair is to seek bullish trading opportunities as long as it trades above the 144.97 support level.
In the indicator window, the relative strength index (RSI) indicates a corrective pressure as it stays near the 50% area. Moreover, the dynamic 20-day Exponential Moving Average is closer to the price, backed by a bullish V-shaped recovery.
Based on the current outlook, the primary aim of this pair is to look for bullish opportunities, where the main aim is to test the 151.46 key resistance level. Moreover, the bullish daily candle above the 151.50 level could influence bulls to test the 160.00 key psychological level.
On the other hand, strong bearish exhaustion with consolidation would be the primary indication of a trend reversal. As of the current market structure, a bearish symmetrical triangle breakout with a bearish price action below the 144.90 level would extend the loss toward the 137.12 support level.
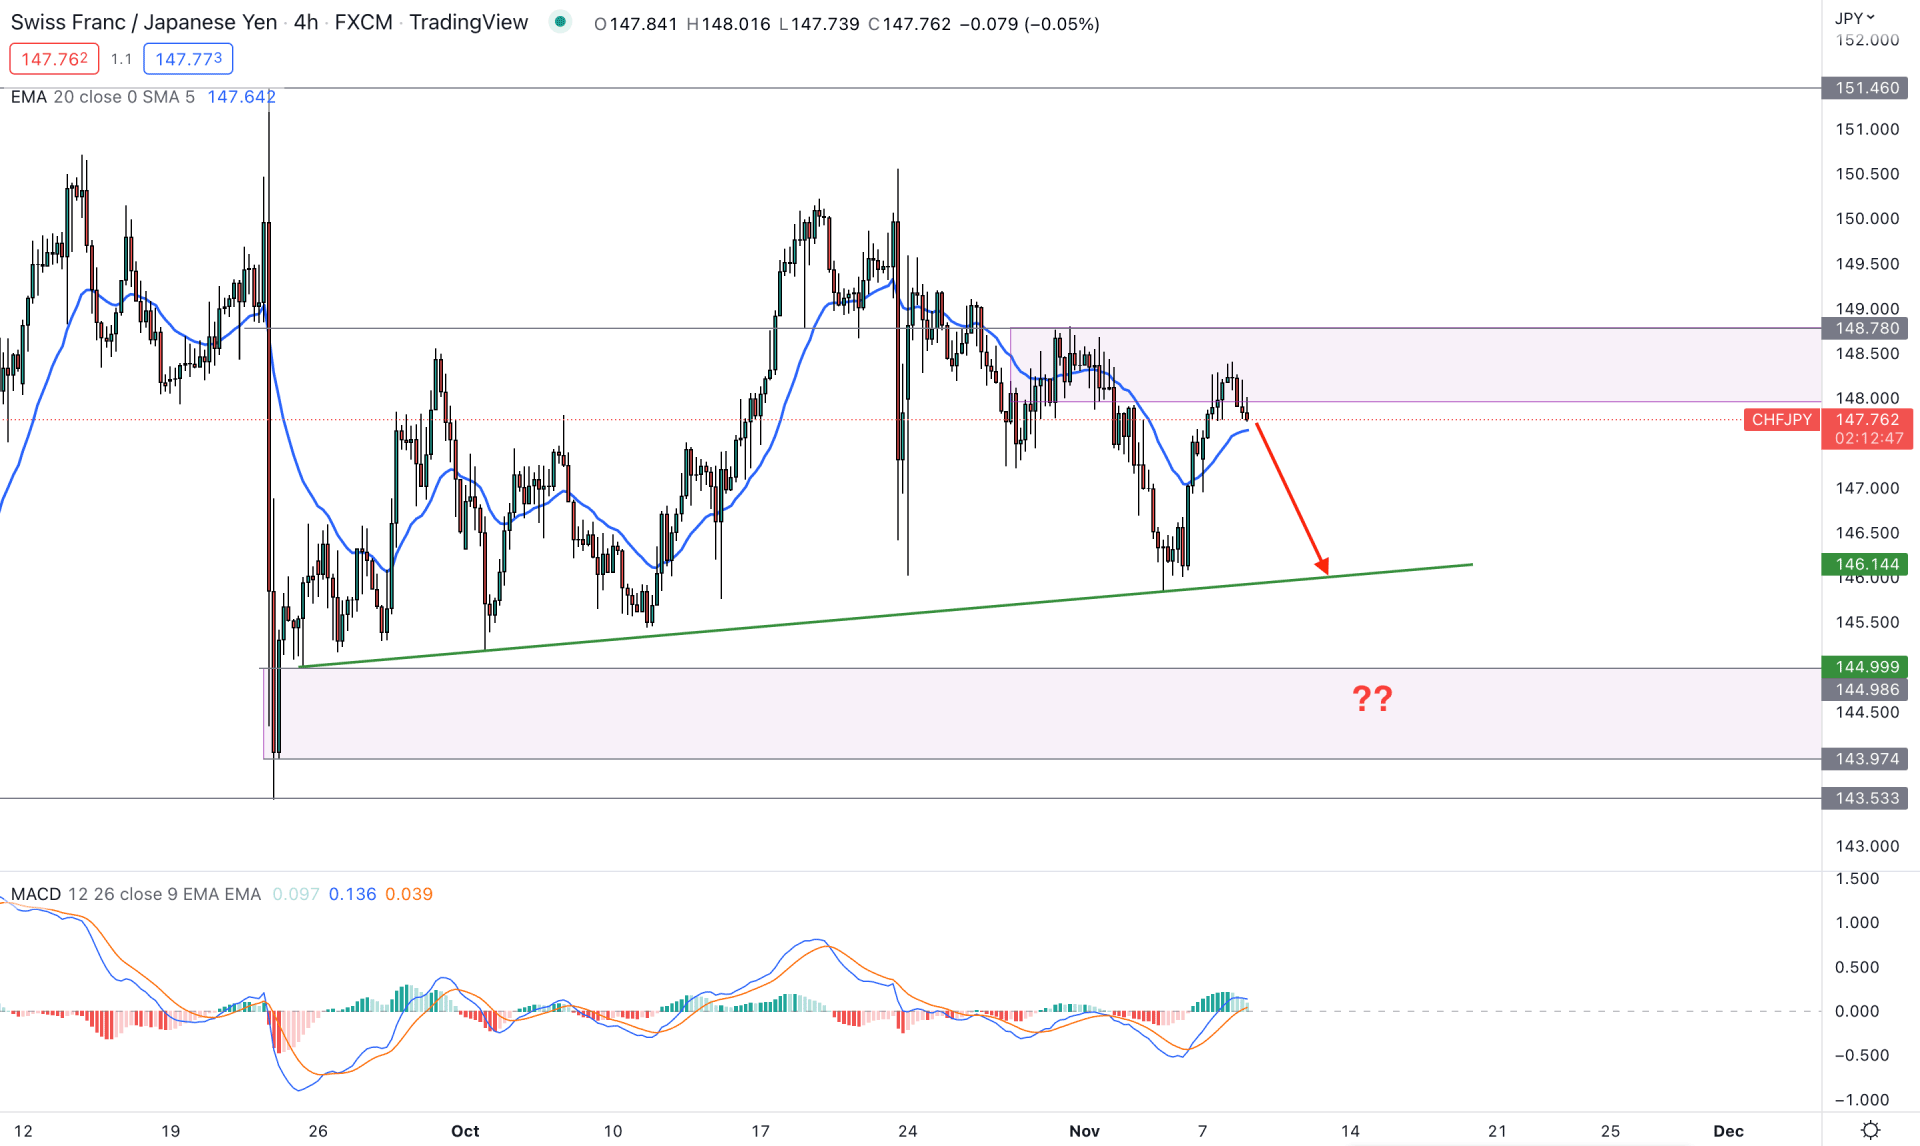
In the H4 timeframe, the CHFJPY price shows a corrective momentum where the current price is above the 143.53 important support level. However, the supply zone of 148.79 to 148.00 is in action, from where bears push the price down. In that case, sellers could extend the bearish momentum to grab the sell-side liquidity below the trendline.
The MACD Histogram is losing momentum in the indicator window, while MACD EMA’a is below the neutral line. In that case, bulls may regain momentum at any time as the EMAs have more room upside.
The trading approach in the H4 chart is tricky, where a sell-side liquidity grab and bullish rejection from 144.99 to 143.97 would be a decent bullish trading opportunity. Moreover, the immediate buying pressure and H4 close above 148.80 could trigger the buying wheel towards the 151.00 area.
On the other hand, the alternative approach is to wait for the price to break below 143.53 before considering the broader market trend as bearish.
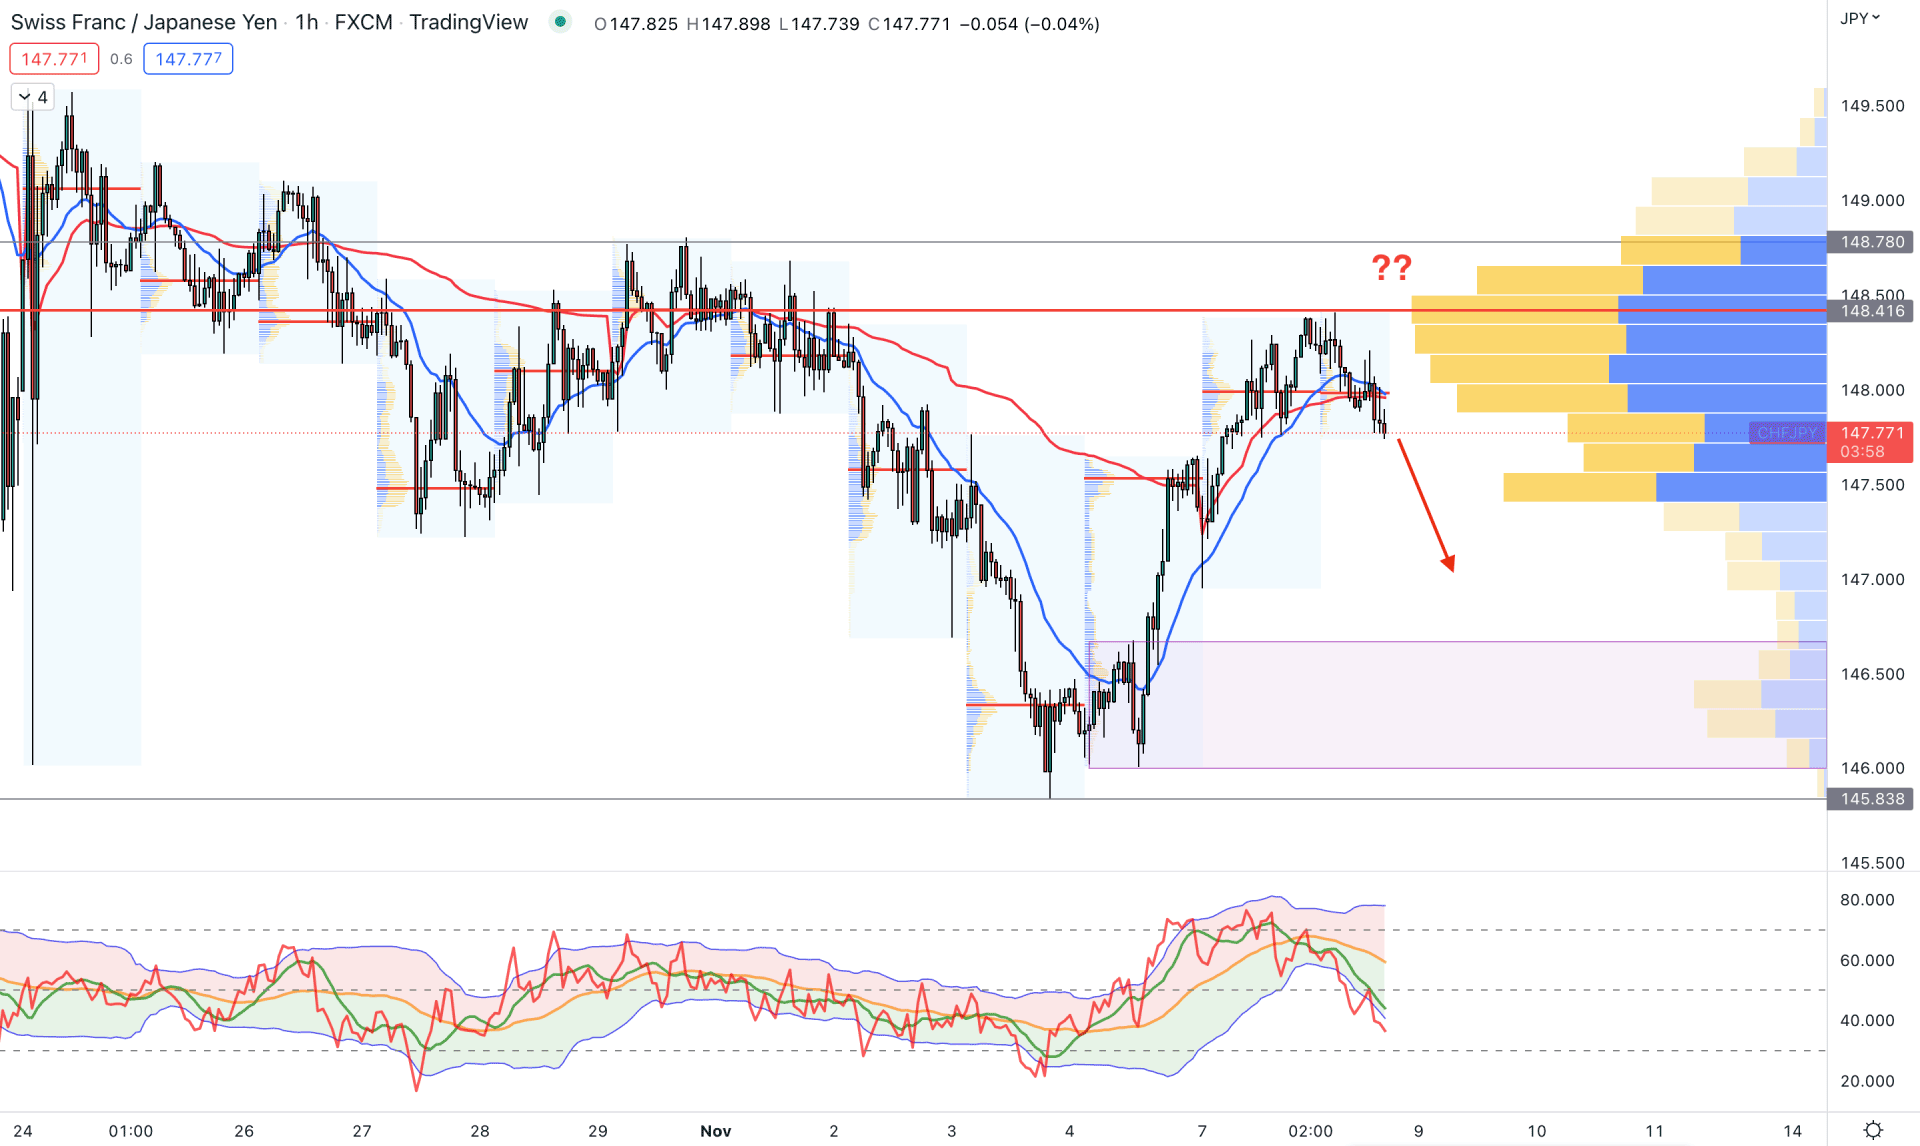
In the H1 chart, the CHFJPY price shows a different story as the current price faces selling pressure, backed by a strong trading volume.
According to the visible range high volume level, the highest trading volume level is 148.41, which is above the current price. Moreover, the price moved below the latest intraday high volume level, while the dynamic 20 EMA and VWAP formed a bearish crossover.
In the indicator window, the Traders Dynamic Index (TDI) shows selling pressure in the market, where the current TDI level is below the neutral 50% area.
As of the daily price action, the bearish pressure could extend towards the 146.00 level, from where bulls may regain momentum. On the other hand, an immediate buying pressure with an H4 candle above the 148.50 level would resume the bullish trend toward the 155.00 level.
Although the broader outlook of CHFJPY is bullish, it needs more confirmation from the intraday chart. The best approach is to wait for the price to complete the bearish correction and form buy trading setups. However, close attention to the near-term support level is needed as a new lower low formation will be a sign of a trend reversal.


