

Published: August 27th, 2026
CHFJPY remained in a small range, holding steady around the 198.00 area after the recent bullish recovery
There is currently an 87% chance that the BoJ will raise interest rates by 25 basis points in September, bringing the rate to 1.25. This chance was approximately 23% before the July conference.
Seiji Adachi, a former member of the BoJ board, said earlier this week that the Fed is likely to raise rates as early as next month and might do so again in January. He claims that maintaining current rates could spur yen sales and accelerate import-driven inflation.
Investors are now focusing on BoJ Deputy Governor Ryozo Himino's speech today, hoping to get new clues about when the next rate hike would occur.
Meanwhile, the Swiss National Bank (SNB) reaffirmed its willingness to take action in foreign exchange markets to stop excessive franc appreciation by keeping its policy rate at zero percent, a position expected to be maintained through 2027.
Markets are currently pricing in a rise as soon as March 2027, which could make the Franc more appealing as a funding tool for carry trades, even if most economists expect the first rate increase in early 2028.
Let's see the further outlook from the CHFJPY technical analysis:
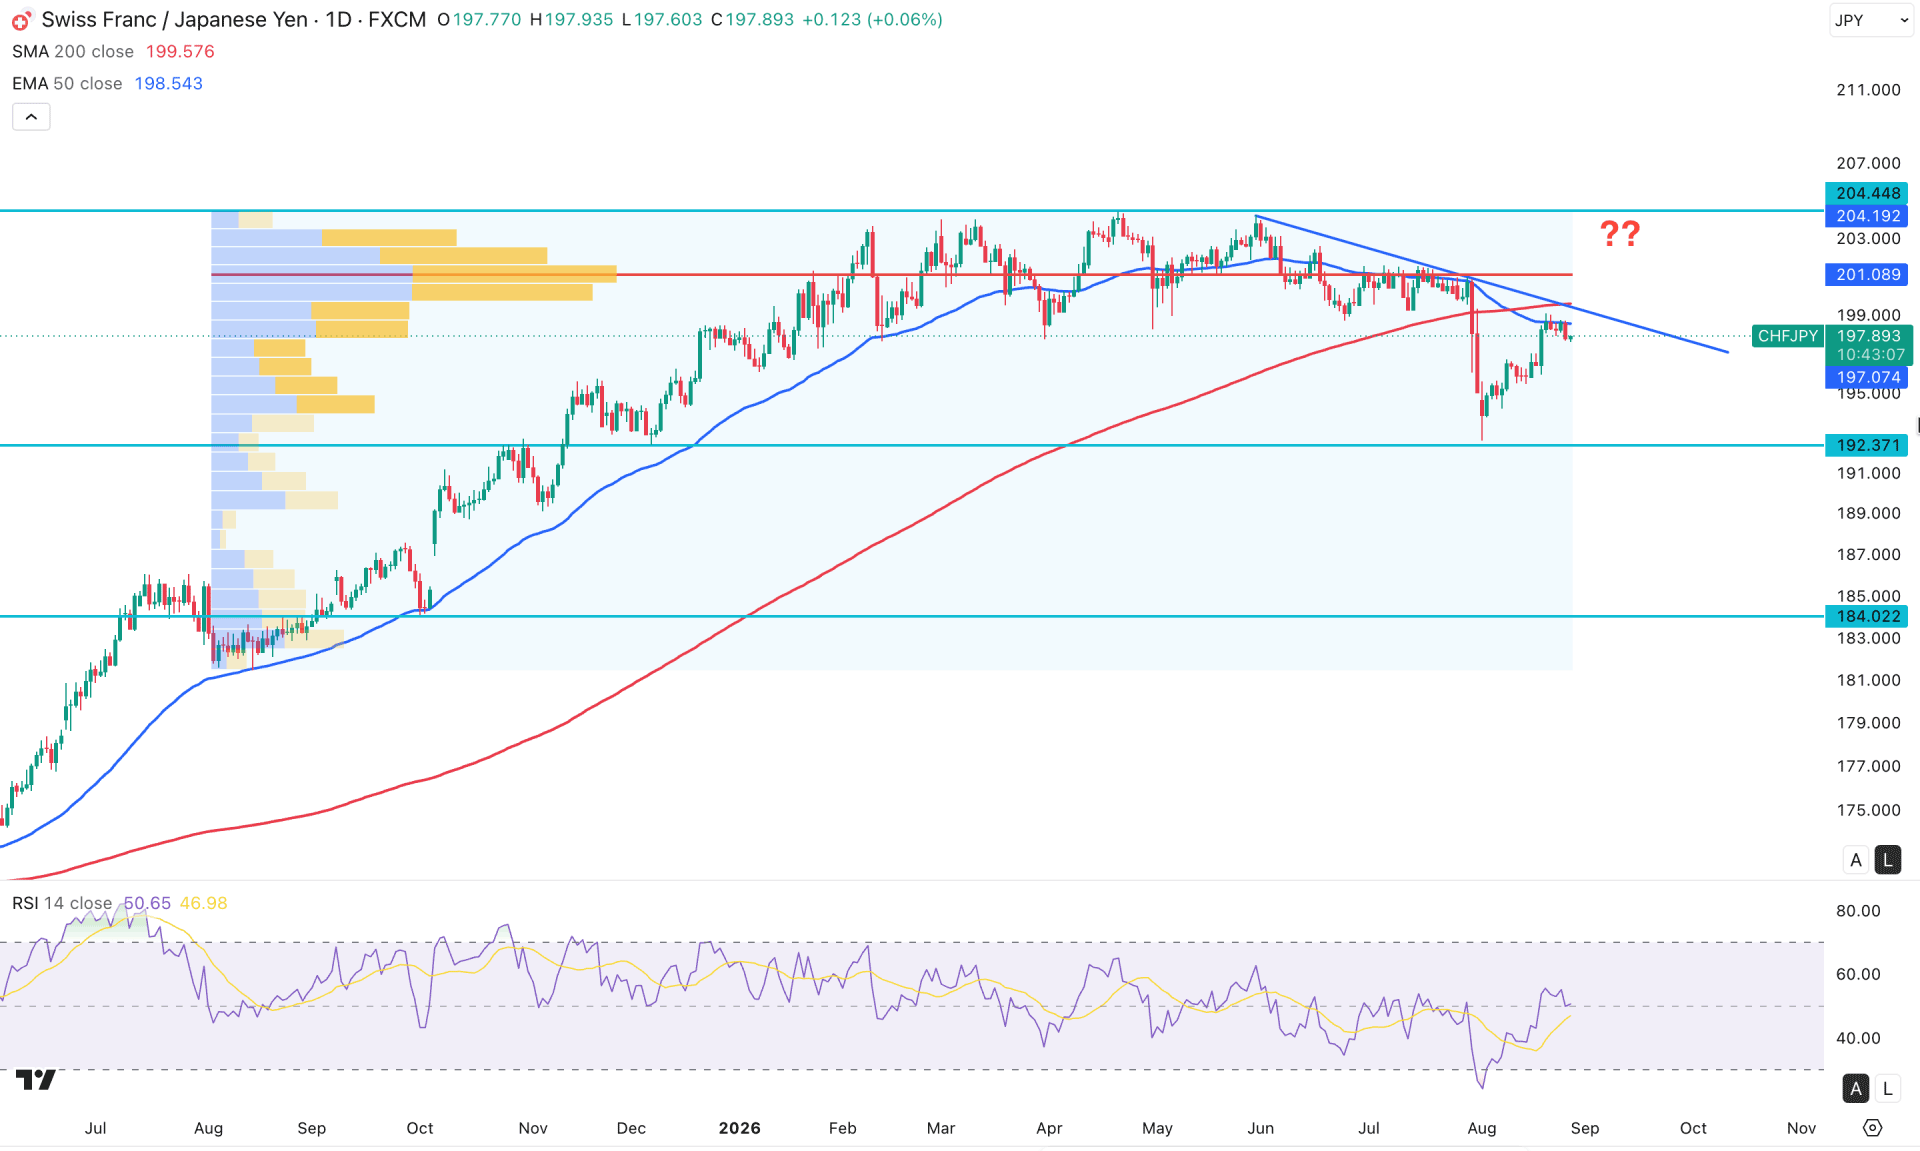
On the daily chart of CHFJPY, the broader market outlook is bullish. The most recent price is struggling to sustain buying pressure after reaching a record-high level, with a possible bearish recovery scenario.
Looking at the monthly timeframe, the monthly price is trading sideways after forming two consecutive bearish closes, which is insufficient to confirm a trend reversal. However, the recent bullish correction is hovering within the existing selling pressure as an inside bar. In that case, failure to sustain buying pressure could eliminate the long opportunity at any time. The weekly timeframe shows consecutive lower-low formations, which signals possible downside continuation from the near-term bearish order block. However, a trendline resistance is emerging, and a breakout from this level could invalidate the bearish structure at any time.
In terms of volume, the price remained sideways for a considerable time and finally made a breakout on the seller side before moving sideways with a bullish corrective structure. As the recent high is marked at the 201.08 level, we may consider a bullish possibility if the price remains above the crucial dynamic resistance.
In the main price chart, impulsive bearish pressure is visible, followed by corrective bullish pressure around the 50-day EMA area. As a result, a death-cross formation is visible, as the 200 SMA is above the current price and working as critical resistance.
As the most recent price is trading below the 50-day EMA and 200 SMA, a possible downside correction might appear as a death-cross validation.
On the other hand, the Relative Strength Index remains at the 50.00 neutral level after visiting the 30.00 oversold area, which signals a corrective market structure.
Based on this market structure, the struggle to overcome the 200 SMA resistance is clear and signals a bearish continuation at any time. Investors should closely monitor how the price reacts at the current price area, as the 50-day EMA is already facing pressure from buyers. Failure to overcome the descending trendline resistance and 200-day SMA could offer a short opportunity at any time. The primary aim would be to test the 195.90 swing low before creating a new low below the 192.55 level.
On the other hand, the recent bullish recovery from the exhaustion level signals profit-taking from sellers, which might be invalidated after overcoming the descending trendline resistance. In that case, overcoming the 199.58 critical resistance level with consolidation could increase the possibility of overcoming the 201.08 high resistance level and testing the 204.19 high.
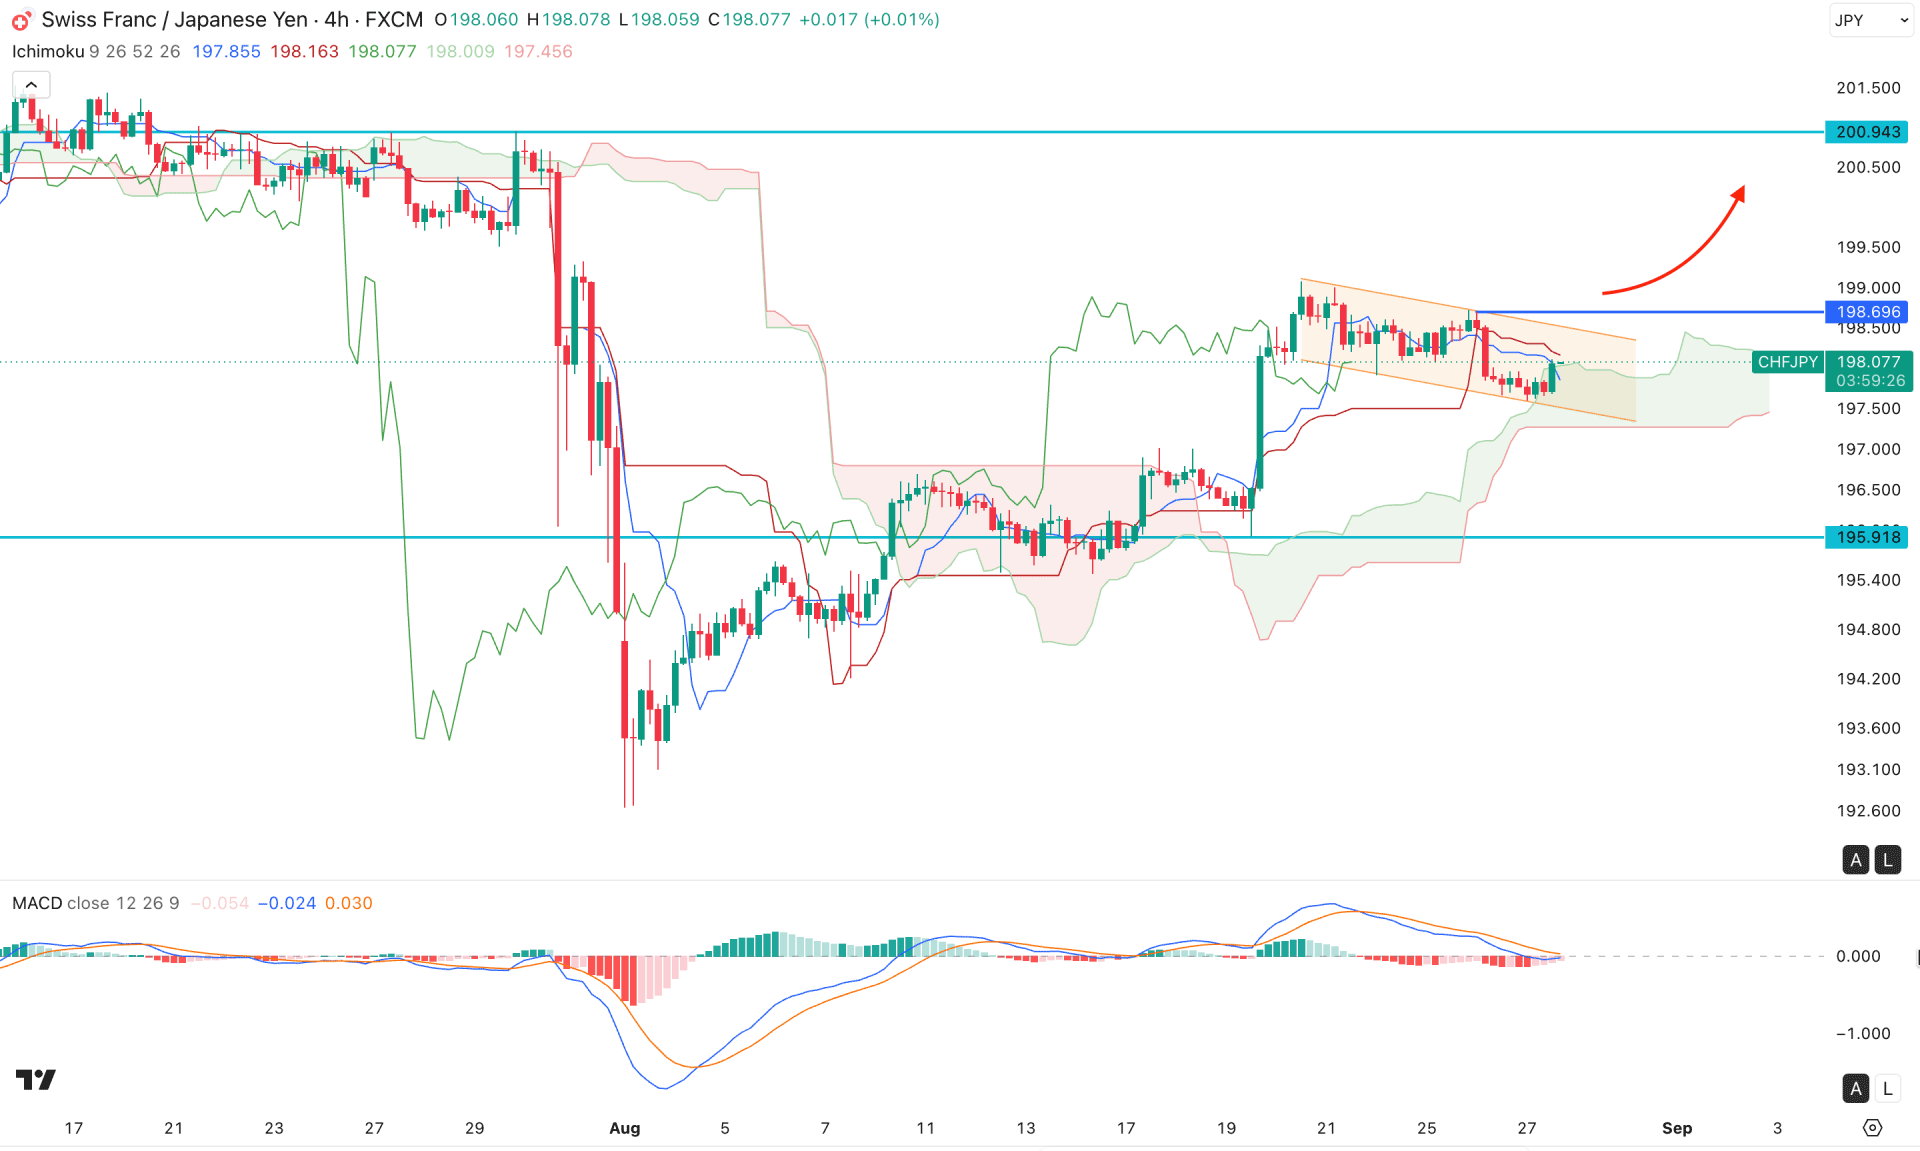
On the four-hour timeframe, the recent price shows a valid bullish recovery, as the current price has been hovering above the cloud support for a considerable time. Moreover, the price formed a new higher high above the cloud support with bullish continuation momentum, which signals further upside potential.
In the indicator window, the MACD histogram is losing bearish momentum, as the current vertical line is closer to the neutral level. Although some minor selling pressure is visible from the signal line, it is in the neutral area and waiting for confirmation to validate the price action.
In this context, investors should closely monitor how the price breaks out from the current descending channel. The immediate resistance to watch is the 198.69 level, and overcoming this line could increase the possibility of testing the 200.94 area.
On the other hand, a bearish correction is possible, where the cloud support is the area to watch. However, the ultimate invalidation level for the bullish structure would be the 195.91 level. Failure to hold the price above this level could increase the possibility of creating a new swing low below the 192.63 level.
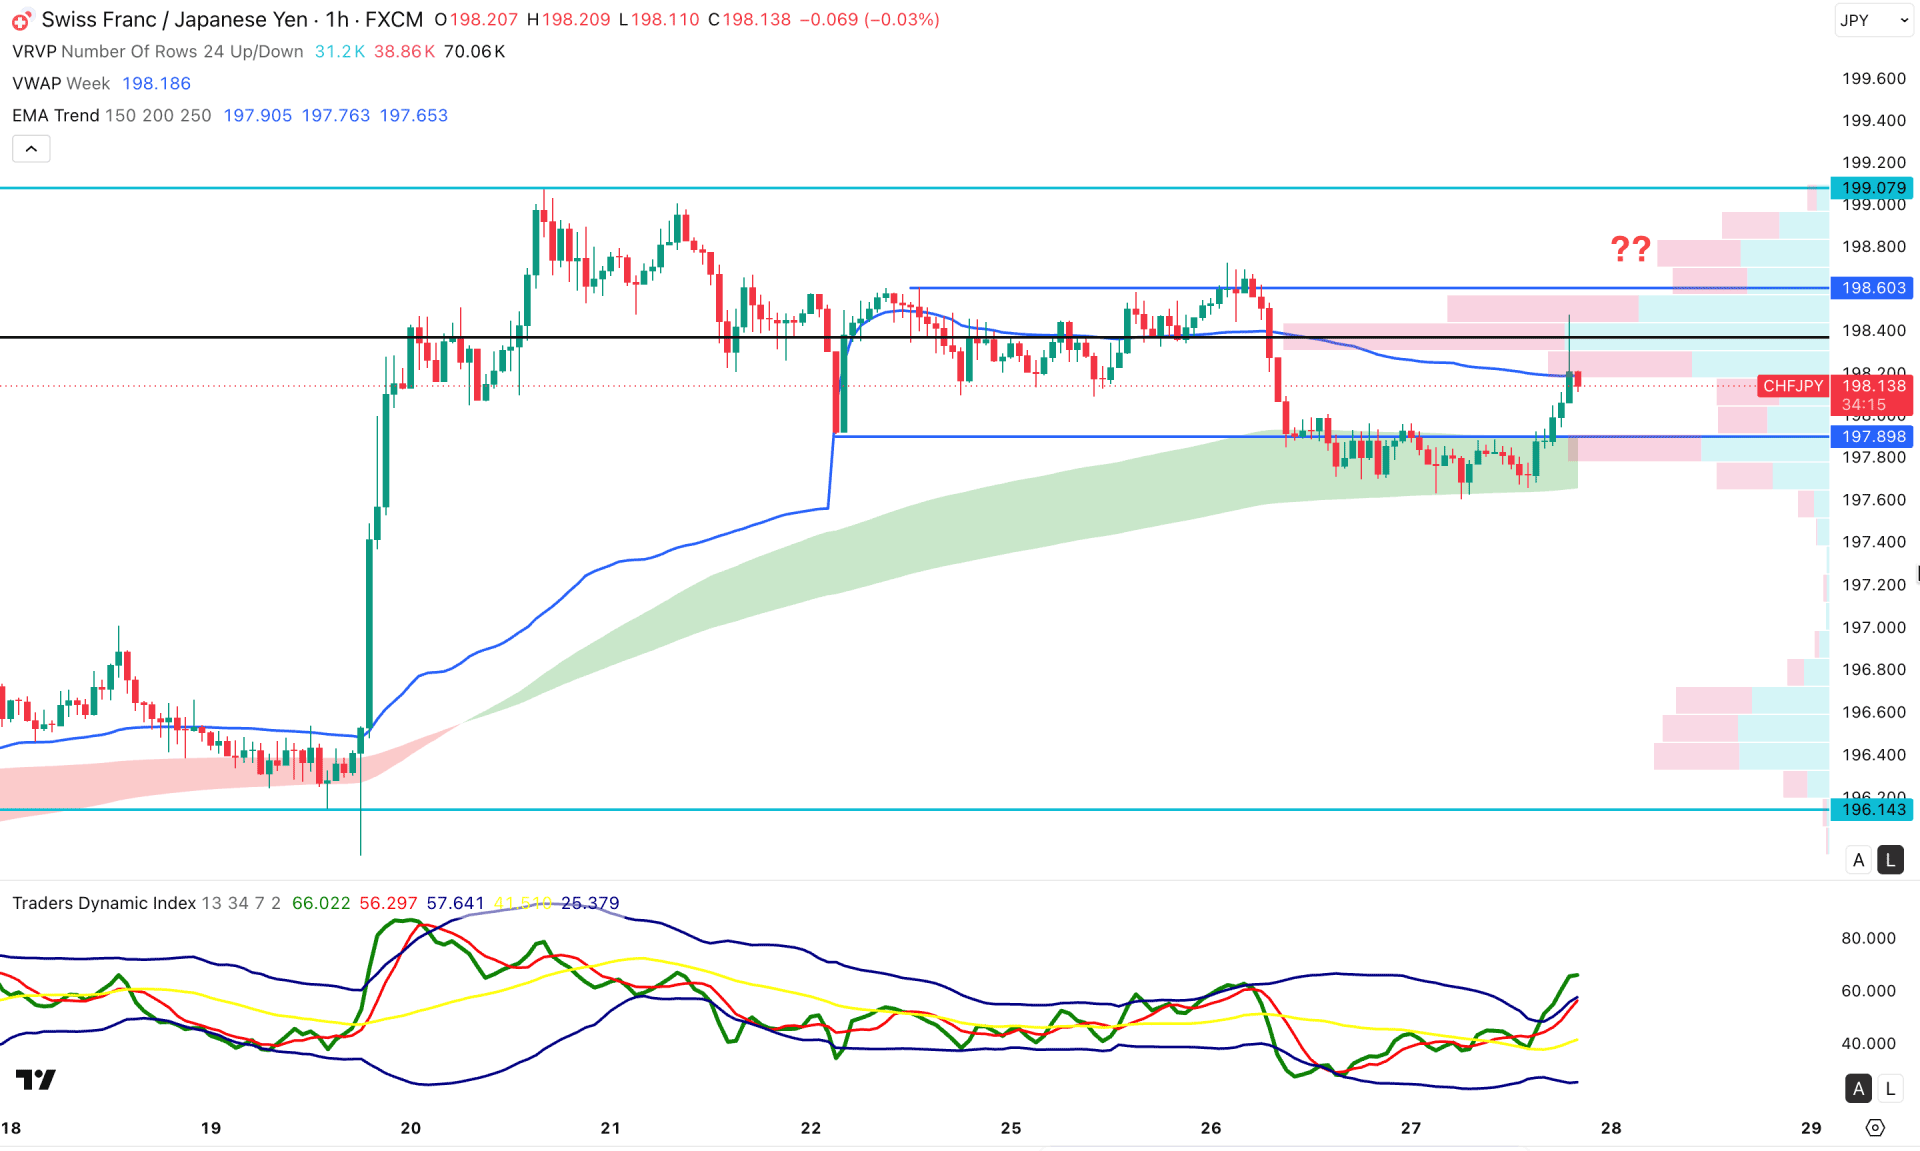
On the hourly timeframe, the price is trading bullishly after testing the exponential moving average and moving higher, although it is struggling to overcome the weekly VWAP level. Although the price is trading within an impulsive bullish wave, the intraday high level is still above the current price and working as resistance.
In the secondary indicator window, ongoing buying pressure is visible, as the Traders Dynamic Index is at an extreme level and holding momentum above the 50.00 neutral point.
Based on the current market structure, CHFJPY is trading within increasing buying pressure, where the major resistance to watch is 198.60. Overcoming this level could validate the long opportunity and gain momentum toward the 200.00 area.
On the other hand, a liquidity grab is visible from the 197.89 swing low, which could work as a crucial level to watch. Failure to hold the price above the new swing high at the 197.60 level could change the bullish structure, and the price may test the 196.14 area.
Based on the overall market structure, CHFJPY is still trading within a bearish possibility, as the price remains below the descending trendline resistance. Until a breakout appears, we may consider a bearish correction and wait for proper validation. However, the long-term structure is still bullish, and a breakout can validate the long opportunity, targeting the current all-time high level.


