
Published: November 23rd, 2023
SNB recorded a total of CHF476.3 billion in sight deposits for the week ending November 10, indicating a marginal growth over last week’s CHF474.6 billion. Chairman of the SNB Jordan emphasized the bank's willingness to tighten monetary policy further to rein in inflation, but he was unsure whether the terminal rate could be reached.
An analysis of BOJ interest rates reveals they were positive at 1.1 in 2013, declining to 0.9 in 2016. Seven years ago, the rates were maintained at 0.9. Uchida and Ueda Man emphasize the potential for an additional decline to 0.8.
The Bank of Japan (BOJ) is apprehensive about prospective economic difficulties abroad, fearing that the economic decisions made in Europe and America could adversely affect Japanese industries. This situation may cause the CHFJPY to decline, prompting the BOJ to consider intervention to avert a substantial decline.
Let’s see the future price direction of this stock from the CHFJPY technical analysis:
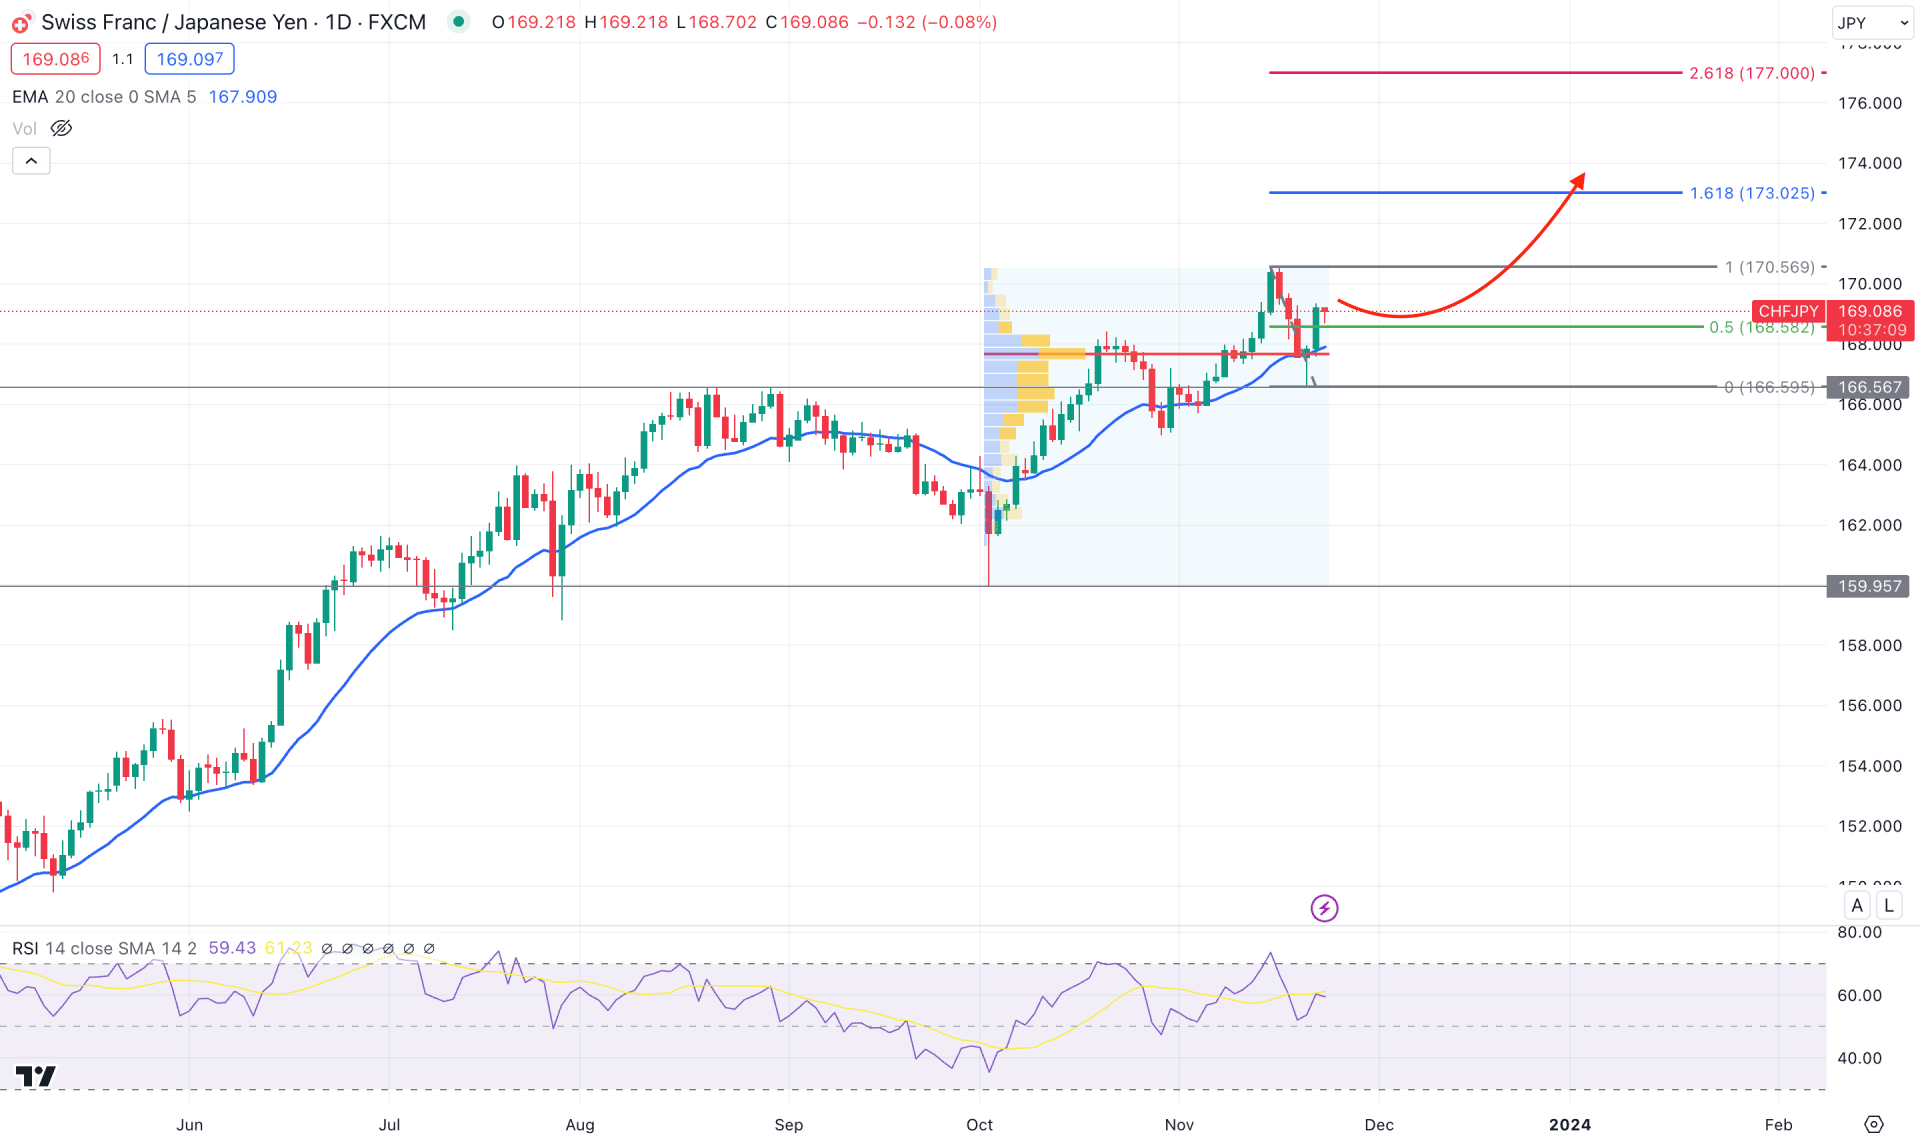
In the daily chart of CHFJPY, the overall market direction is bullish as the recent price shows a consecutive bullish higher high formation. Although the price trades at the multi-year high, there is no sign of a trend reversal. In that case, the bullish momentum is potent, and any long opportunity from the near-term price area could be a valid trading signal.
In the higher timeframe, the broader market direction is bullish as the monthly time frame indicates an all-time high level. Moreover, the weekly timeframe suggests a bullish continuation as the latest candle trades as an inside bar followed by a Marubozu formation. Overall, the long-term direction is strongly bullish, with no sign of exhaustion.
In the volume structure, a bullish re-accumulation since the October low is at the 167.67 level, which is below the current price. It indicates buyers’ presence in the market, which is valid as long as the price trades above the high-volume area.
In the daily timeframe, the daily 20 Exponential Moving Average is the immediate support with confluence support at the high volume area. Moreover, the Relative Strength Index (RSI) shows a bullish recovery from the 50.00 neutral line, which indicates a bullish continuation opportunity.
Based on the daily outlook of CHFJPY, a simple trend trading opportunity is potent, where the current target level is the 173.02 level, which is the 161.8% Fibonacci Extension level from the existing bearish swing.
On the bearish side, bearish exhaustion is needed from the 170.56 level, which could be the primary sign of a trend reversal. Moreover, a new high volume formation above the current price with a bearish recovery below the 166.56 event could be another short opportunity, where the main aim would be to test the 162.00 psychological level.
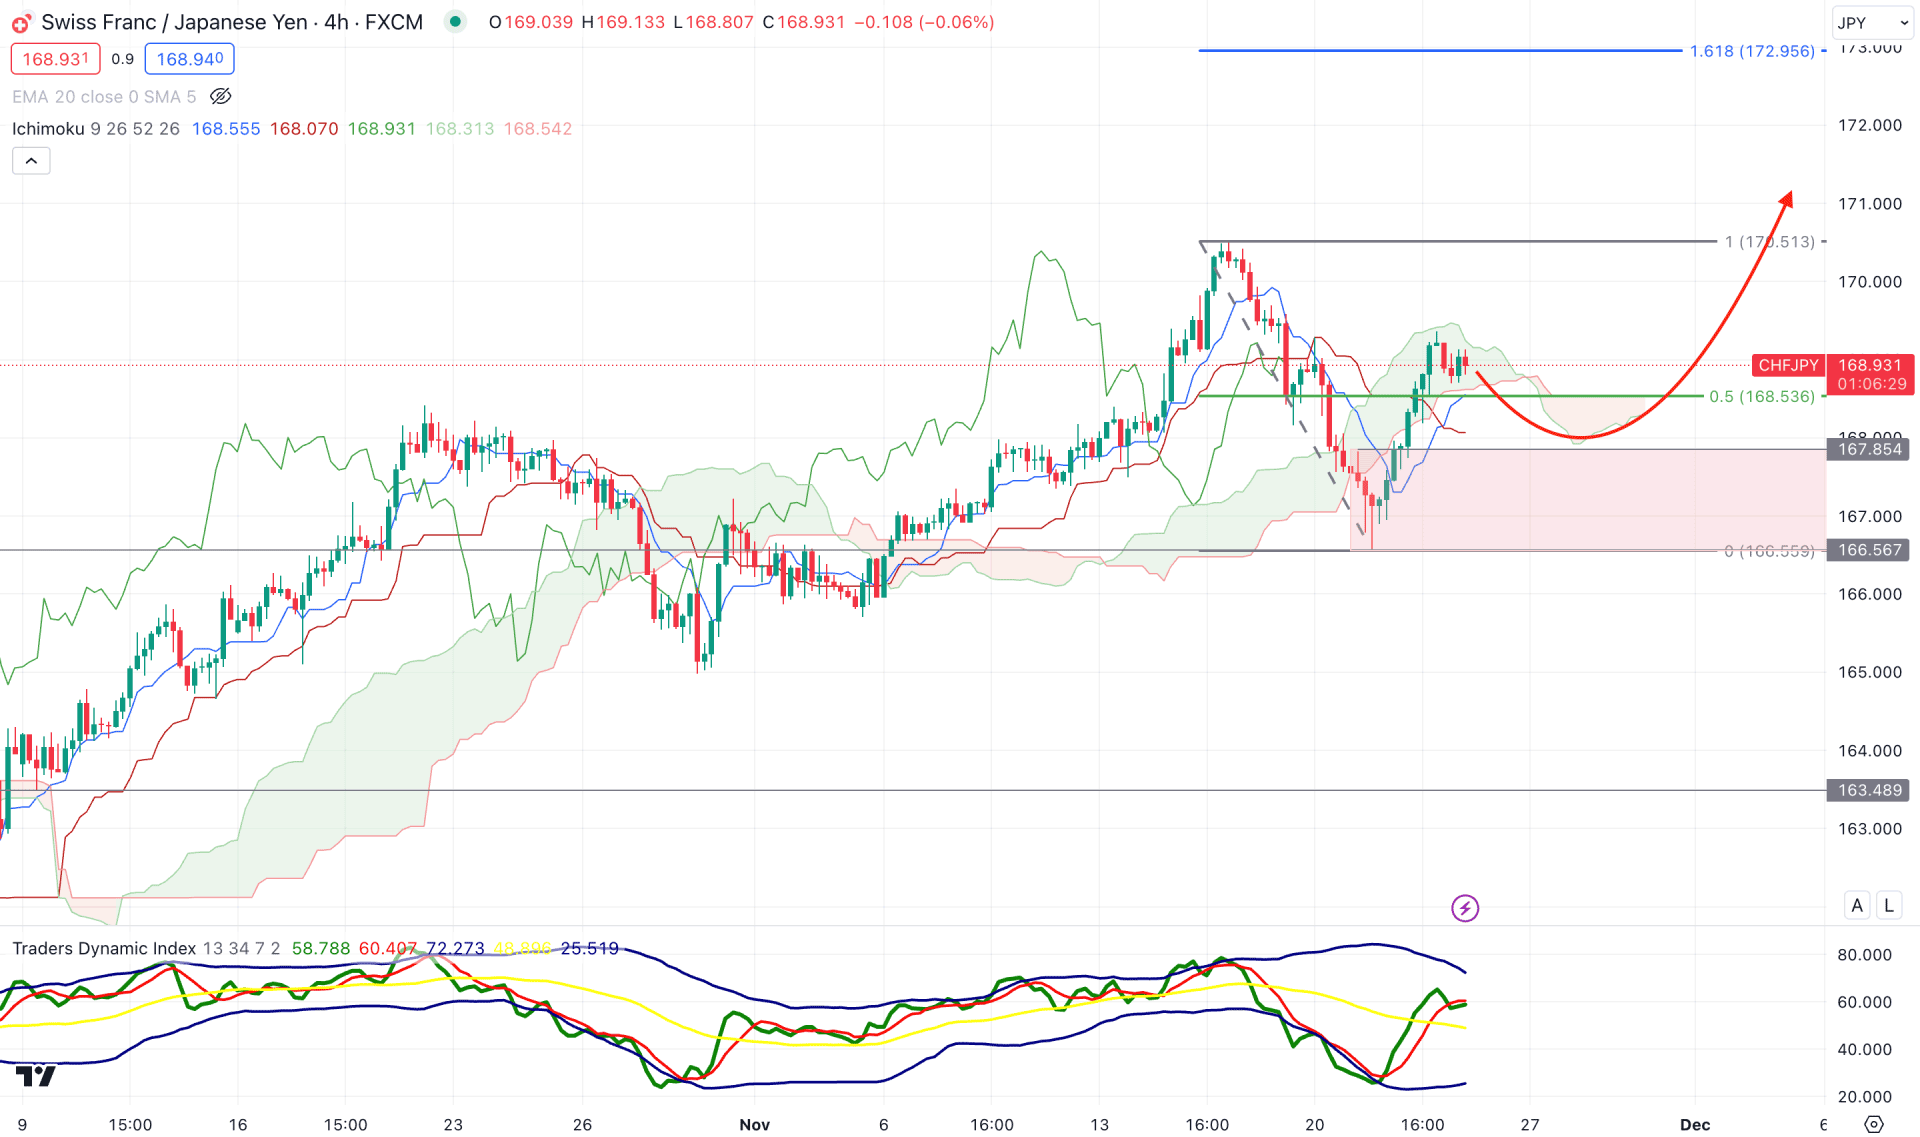
In the H4 chart, the bullish trend is valid as the recent price shows a bullish continuation above the Ichimoku Kumo Cloud. Moreover, the future cloud suggests a corrective price action as the Senkou Span A is below Senkou Span B with an upward pressure. In that case, a bullish flip in the Senkou level is needed before forming a bullish continuation.
In the secondary window, the Traders Dynamic Index (TDI) suggests a stable buying pressure as the recent reading remains above the 50.00 neutral line.
Based on this outlook, a minor downside correction is possible towards the 167.85 to 166.56 zone, which could be a long opportunity with a bullish rejection. In that case, the upside pressure could take the price toward the 172.95 Fibonacci Extension level.
On the bearish side, an impulsive bearish pressure is needed from the current area. A bearish H4 candle below the 166.56 support level could be the primary signal of a bearish continuation, targeting the 164.00 level.
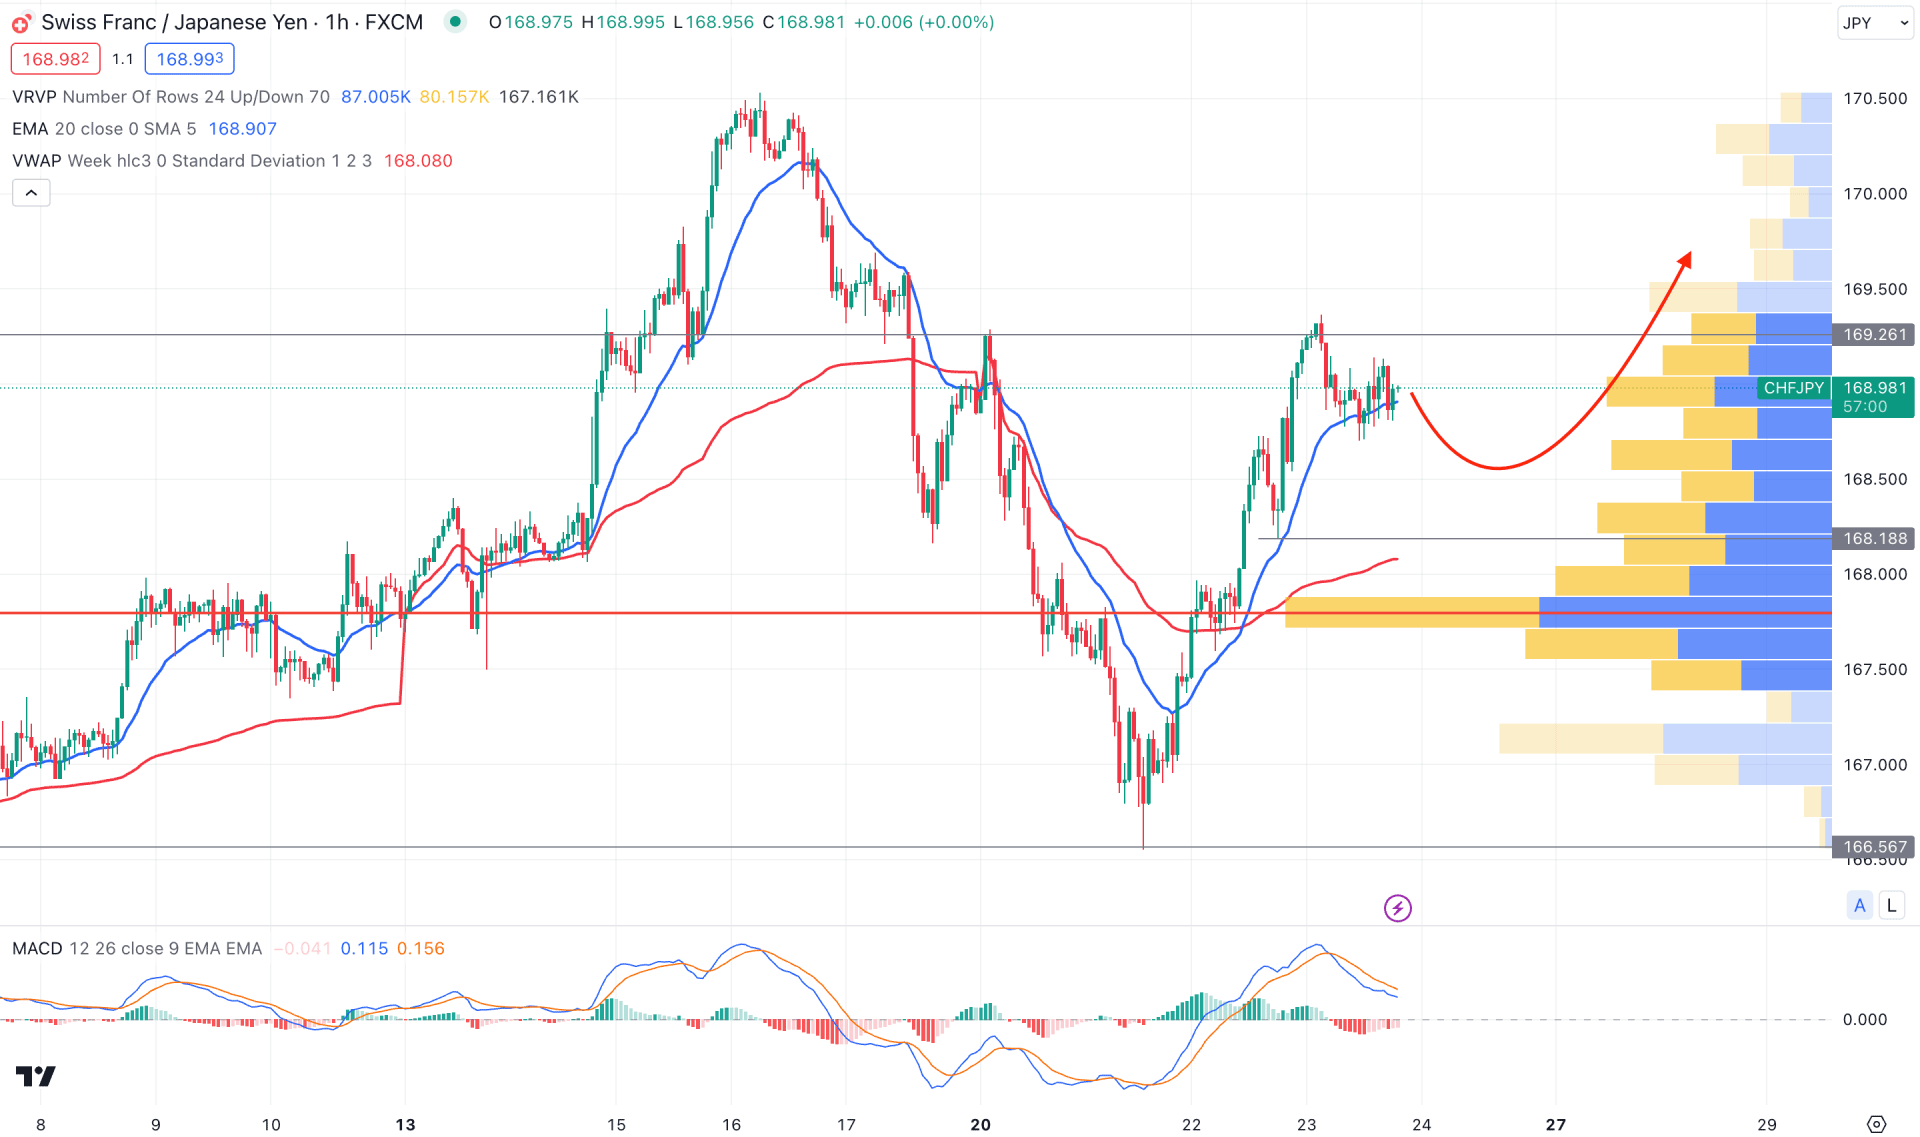
In the hourly chart, the bullish continuation is potent as the visible range high volume level is below the current price. Moreover, a potential V-shape recovery is seen while the current price trades above the dynamic 20-day EMA.
Based on this outlook, an additional bullish rejection from the 168.68 to 168.00 area could be a valid long opportunity. However, a deeper correction is possible towards the 167.80 high volume level, but a bearish pressure below the 167.00 mark could be a short opportunity for this pair.
Based on the overall market structure, the long-term bullish trend is valid for the CHFJPY pair. Investors should closely monitor the intraday price action as a trend continuation opportunity might come from the near-term support level.


