
Published: September 9th, 2025
Results from Chewy CHWY, an online retailer of pet foods and supplies, will be released on Wednesday, and investors are keen to see how the price reacts after that.
In the most recent quarter, Chewy reported sales of $3.12 billion, representing an 8.3% year-over-year increase, 1.1% higher than the experts' predictions. Although it fell just short of analysts' EBITDA projections, the corporation had a good quarter.
Analysts predict that Chewy's revenue will increase 7.7% year over year, reaching $3.08 billion this quarter, up from a 2.6% growth in the same period last year. It is anticipated that adjusted earnings will be $0.33 per share.
Over the past 30 days, most analysts who follow the company have reaffirmed their projections, indicating that they expect the company to continue on its current trajectory as it reports its results. Chewy has exceeded top-line predictions by an average of 0.8% over the past two years, and only fell short of Wall Street's sales estimates once.
Some of Chewy's competitors in the e-commerce space have already released their Q2 numbers, which gives us an idea of what to anticipate. Revolve posted revenues increased 9.4%, exceeding projections by 3.7%, and Carvana posted a year-over-year increase in revenue of 41.9%, surpassing the projections of analysts by 5.7%.
Let's see the future price direction of this stock from the CHWY technical analysis:
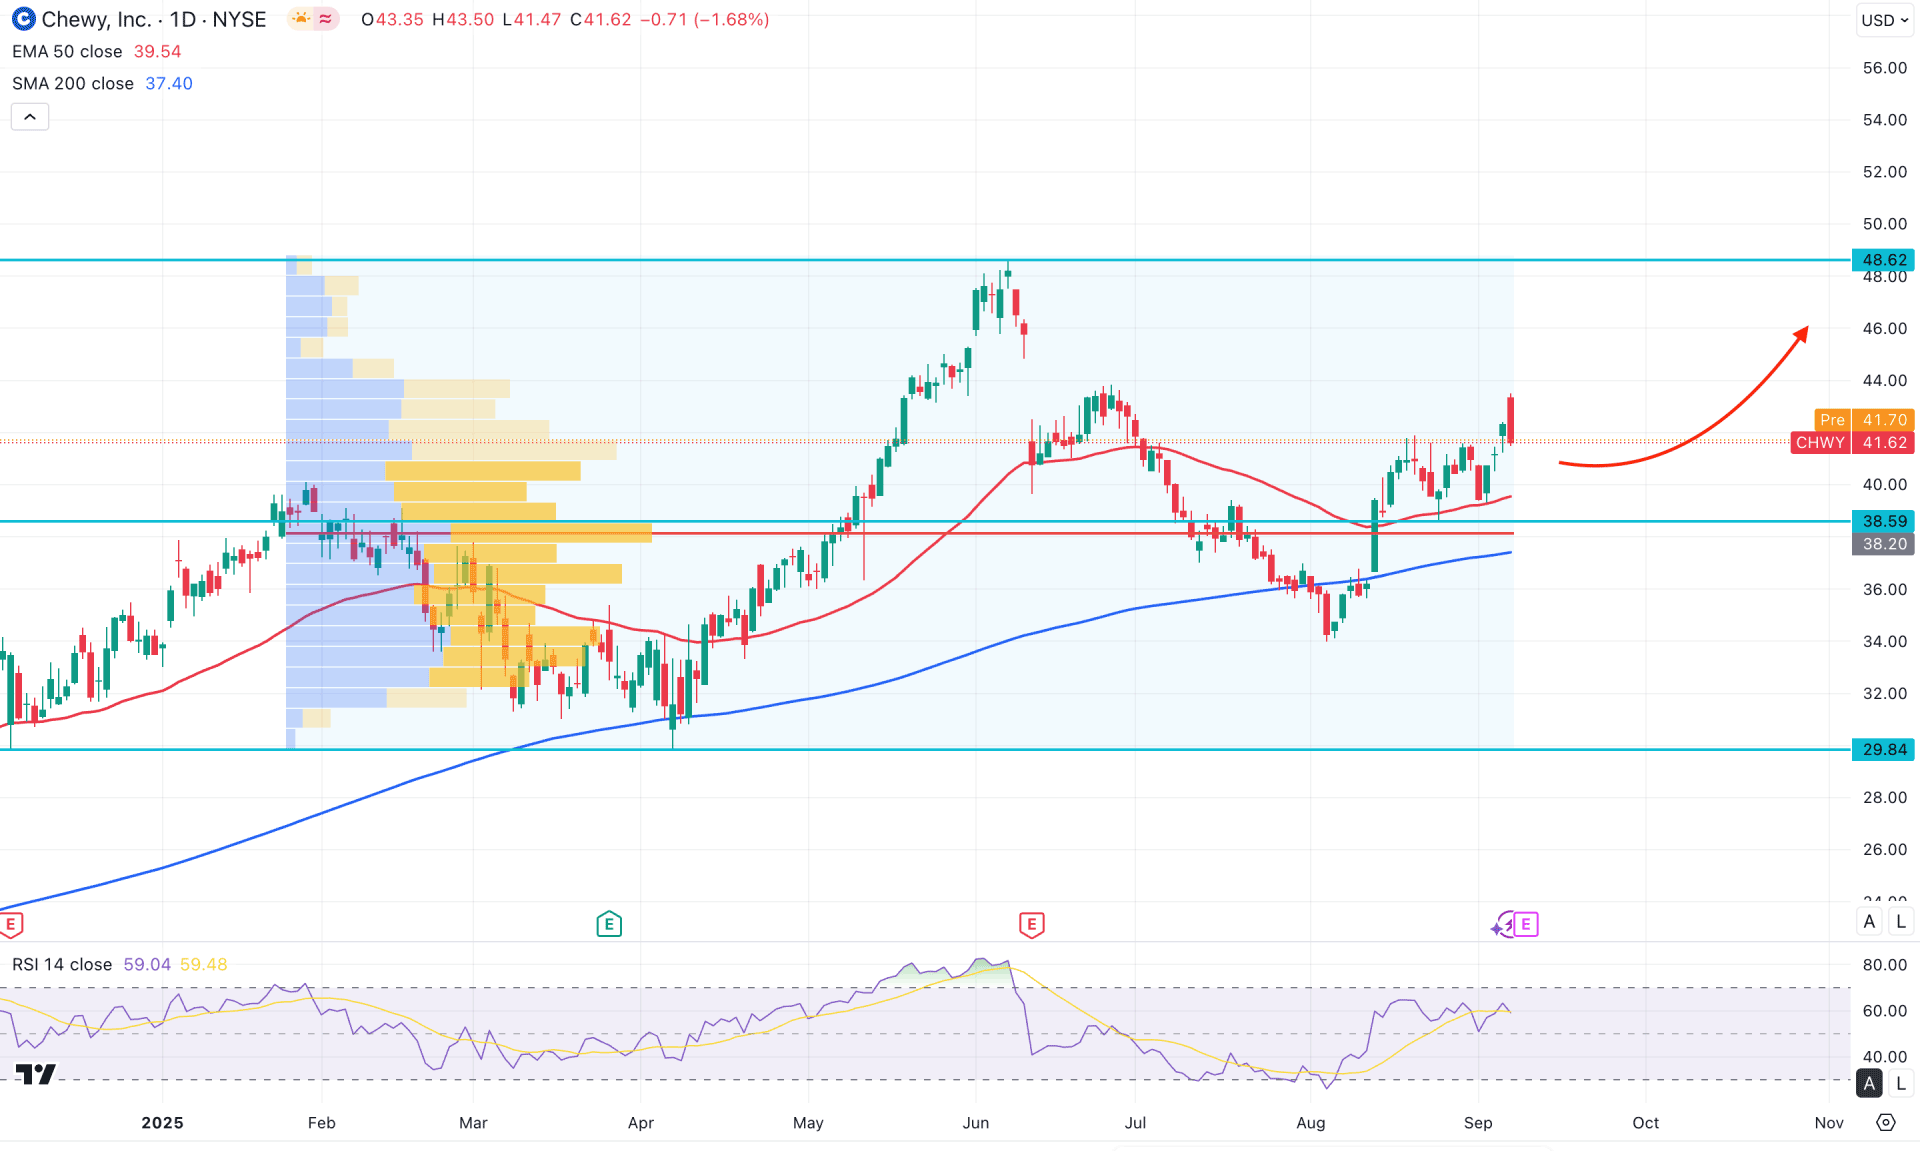
In the daily chart of CHWY stock, a strong bullish momentum is present as the price has been moving higher since the beginning of 2025. Following the market trend, the main focus for this stock would be to look for long opportunities, even if some short-term downside corrections occur.
Looking at the higher timeframe, the price is trading at a crucial discounted zone, with a solid rebound visible after the 2021 crash. The price reached its lowest level ever at 14.85, from which a strong bullish recovery emerged, creating a yearly high. As the most recent monthly candle is bullish with a two-bar reversal pattern, a bullish continuation is likely. On the weekly timeframe, a valid bottom is confirmed at the 34.12 level, supported by a bullish crossover in the 50-week EMA. Since the rising trendline is reinforcing the bull run, further continuation is possible.
In terms of volume, the bullish pressure remains valid, as the highest activity level since January 2025 is below the current price and is acting as a significant support above the 200-day SMA. Moreover, the 50-day EMA has rebounded and is acting as immediate support near the 40.00 area. With both dynamic lines providing support and a valid bullish reversal visible, we may expect the bullish continuation to extend further.
Looking at secondary indicators, the Relative Strength Index (RSI) is moving sideways between the 50.00 and 70.00 zones. Since the current momentum is supported by a bullish breakout from the 30.00 oversold level, we may expect the RSI to approach the 70.00 line. Furthermore, the strength of the trend is confirmed by the Average Directional Index (ADX), which is hovering above the 30.00 level. As the ADX is trading above the 20.00 threshold, we may consider the bullish trend as active.
Based on the overall market structure, the price is likely to move higher as long as it remains above the 50-day exponential moving average. The primary resistance is located at the 48.62 level, which could be the immediate target; however, a breakout above this resistance could push the price beyond the 70.00 area.
On the other hand, failure to hold above the 200-day simple moving average could pose a challenge for the bulls. In that case, a deeper consolidation with a new swing low below the 34.15 level might extend selling pressure toward the 29.84 level.

In the four-hour timeframe, the price has been trading above the Kumo Cloud for a considerable period, which signals a valid cloud breakout. Moreover, the future cloud looks solid as both lines are heading upward and supported by the rising dynamic lines. Primarily, as long as the price remains above the cloud support, we may expect the trend to continue.
In the secondary indicator window, buying pressure is also evident, as the MACD histogram has flipped its position since the price broke out of the recent range. Furthermore, the signal line is above the neutral area, indicating active buying pressure in the market.
Based on the market structure, a bullish rally continuation is likely, with the ultimate target being the 48.62 level. Moreover, a potential ABCD correction above the cloud area could find the C-leg at the 47.12 level.
However, the bullish possibility remains valid only as long as the key support level at 38.70 is protected. A break below the 38.00 level, along with consolidation beneath the cloud area, could become a challenging factor for bulls, potentially extending the decline toward the 34.05 support level.
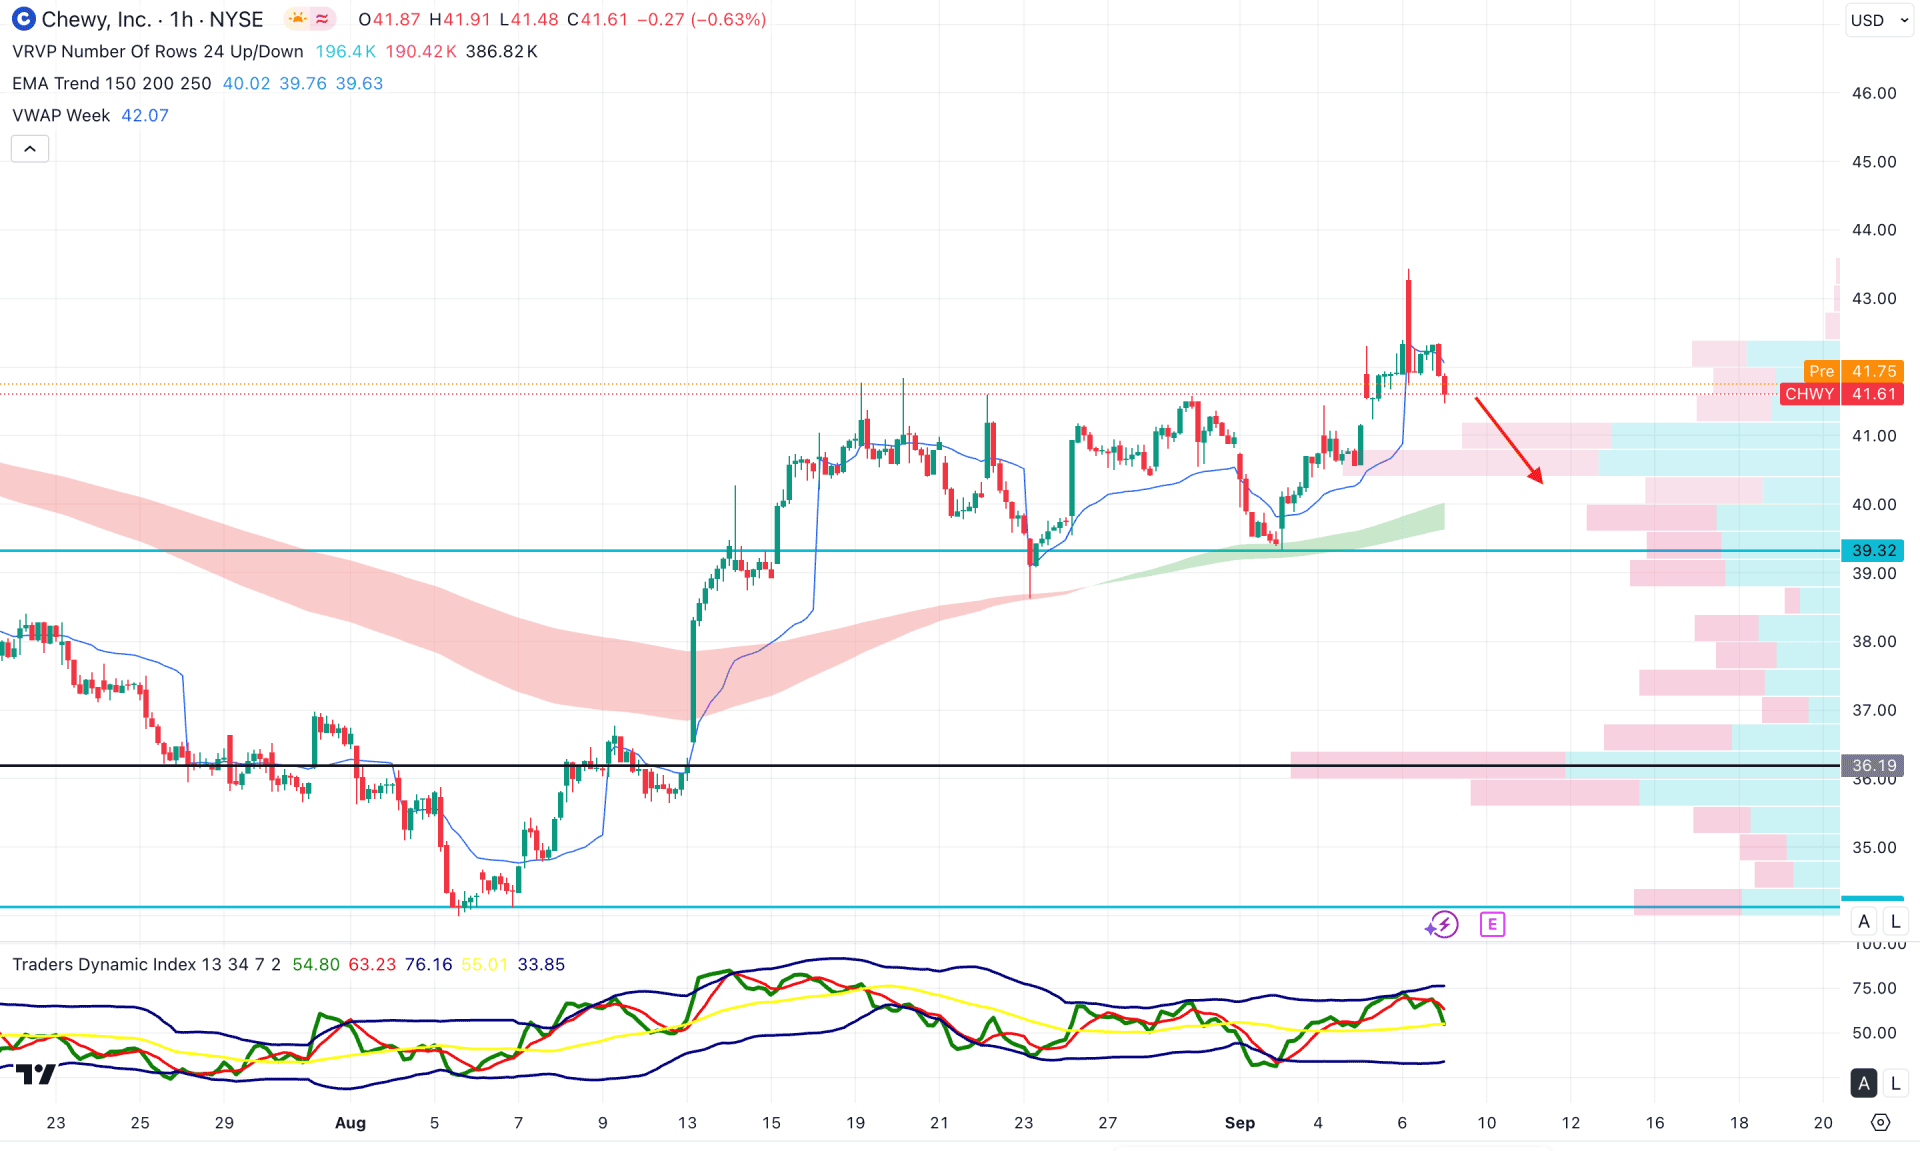
In the hourly timeframe, the price is trading near the recent swing high, from where a considerable corrective move is pending. Although the most recent hourly candle flipped below the weekly VWAP level, the EMA wave remains below the current price.
Primarily, the EMA wave and visible range high-volume levels could act as strong support for this stock, and the price may rebound at any time unless these areas are violated.
In the secondary indicator window, the Traders Dynamic Index (TDI) has reached a bullish peak and flipped toward the 50.00 level. Although the TDI is heading lower, it remains above the satisfactory 50.00 mark.
Based on the overall market structure, a considerable downside correction is pending, with immediate support located at the 39.30 level. However, any rebound from the 41.00 -- 39.00 area, accompanied by an hourly candle closing above the weekly VWAP line, would present a potential long opportunity targeting the 45.00 level.
Based on the broader structure, the stock is trading at a discounted zone and is supported by a rising trendline, suggesting that a bullish continuation is possible. Moreover, the price has opened space above the 48.62 resistance level, creating further upside potential.


