Published: August 24th, 2022
Chevron is a well-established company that provides a solid dividend over time, while its management focuses on paying a stable return to shareholders.
In fact, Chevron has been paying dividends consistently for 30 years, which pushed investors to believe it is a dividend aristocrat company. Moreover, Chevron’s management did not falter even if the company faced adverse financial conditions during the pandemic. The current forward P/E for the company is roughly 9.3X, with the dividend yield at 3.7%.
The buying pressure in this stock was extended from the recent quarterly earnings report, in which the company reported $68.76 billion in revenue, 10% higher than expected. Moreover, the earnings per share came at $5.82, up from the 5.08 expectation.
Let’s see the future price direction of Chevron from the Chevron Stock (CVX) technical analysis:
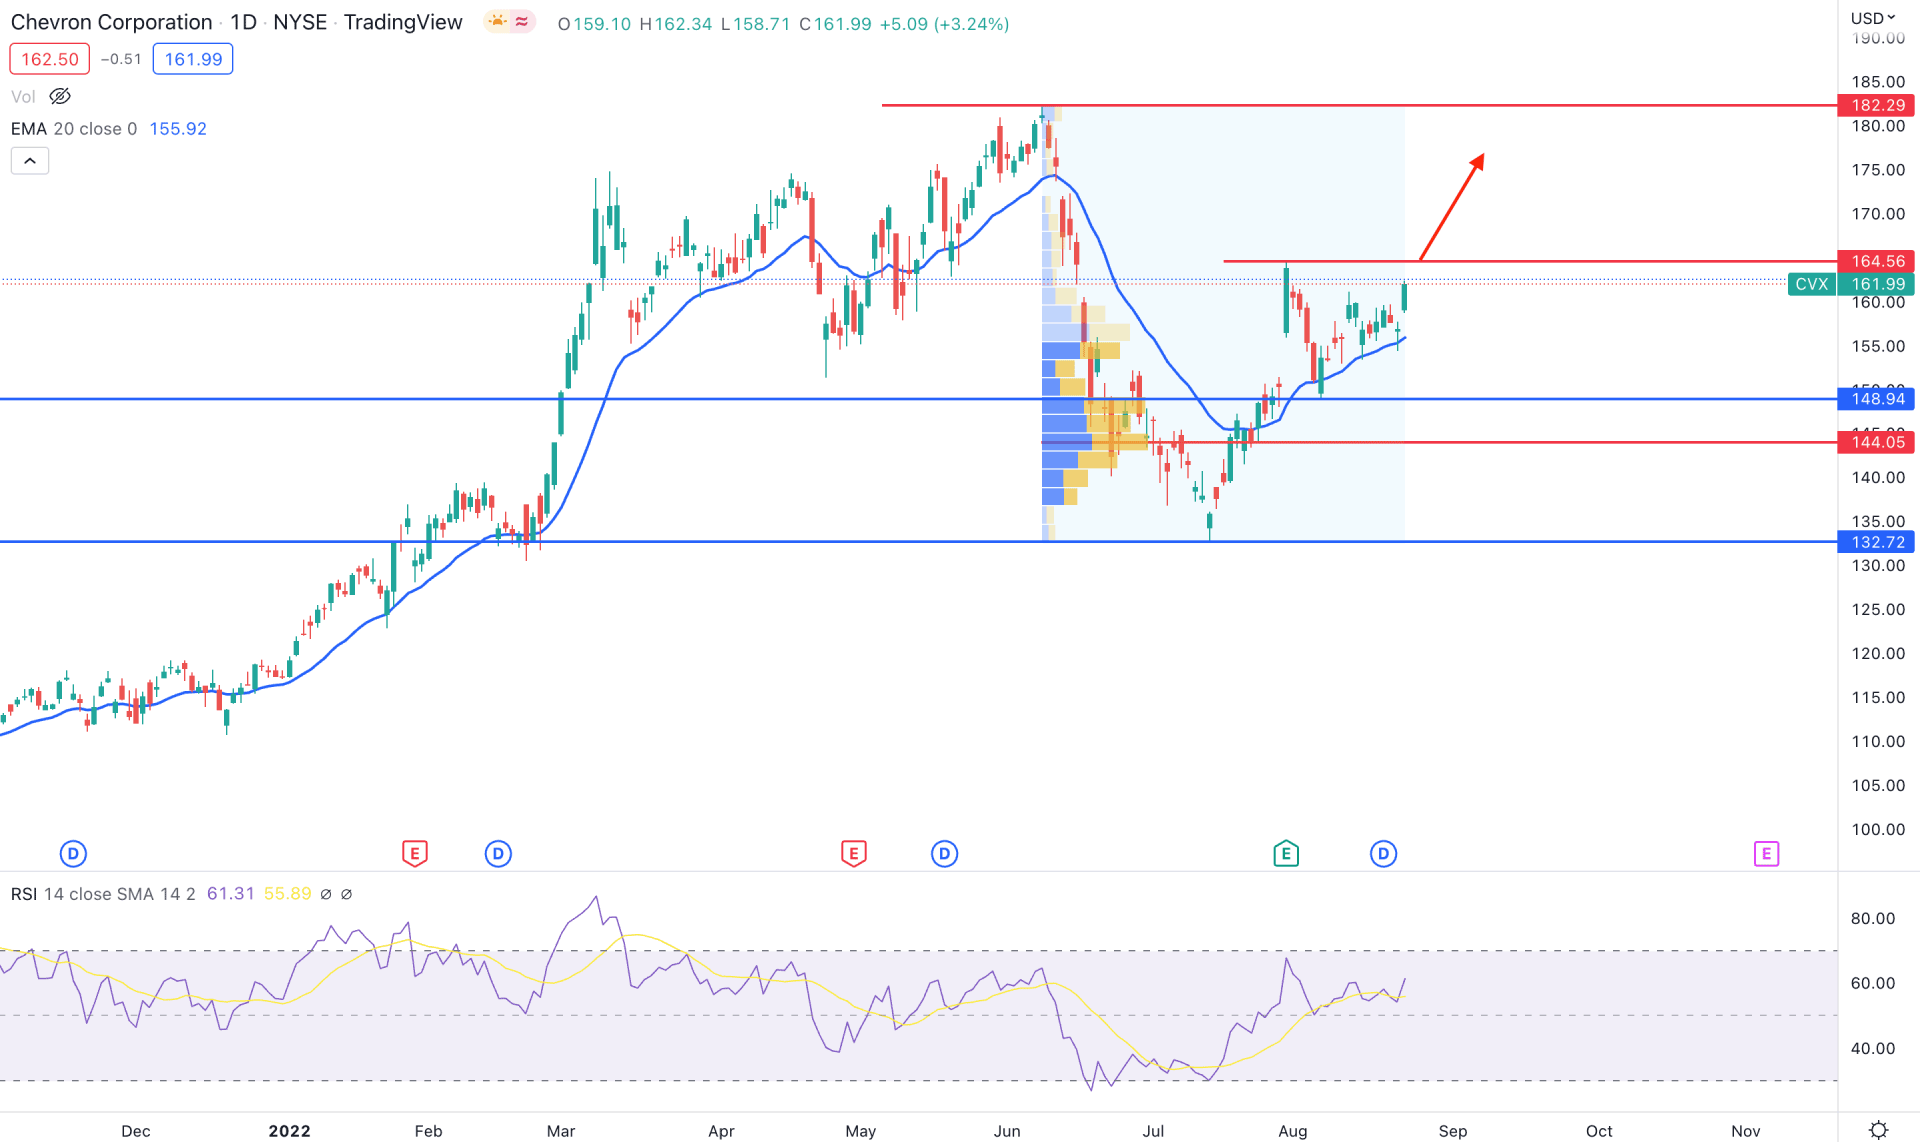
The daily chart shows the current bullish trend where the price has been heading up since the beginning of 2022. After making the 182.29 level a strong top, the price moved down to 132.72 with a counter-impulsive momentum. However, the price rebounded higher instead of making a new low, which opened the bullish possibility.
Based on the volume structure of this instrument, from 182.29 high to 132.72, the highest activity level was found at 144.05 level, which is below the current price. We can consider the upside pressure strong with the recent price increase from the highest volume level.
The dynamic 20-day moving average is below the current price and aimed higher, which is a primary sign of buyers' activity in the market. In the indicator window, the Relative Strength Index (RSI) also supports bulls, as it aims higher from the neutral 50% level. As a result, the buying momentum may extend until the RSI shows strong selling pressure from the oversold 70 to 100 zones.
Based on the daily Chevron Stock (CVX) technical analysis, the current market momentum is bullish, which may extend toward the 182.29 key resistance level. On the other hand, the alternative trading approach is to wait for the bearish break below the 144.00 level to consider the current upside pressure invalid. In that case, the bearish pressure may extend towards the 130.00 area.
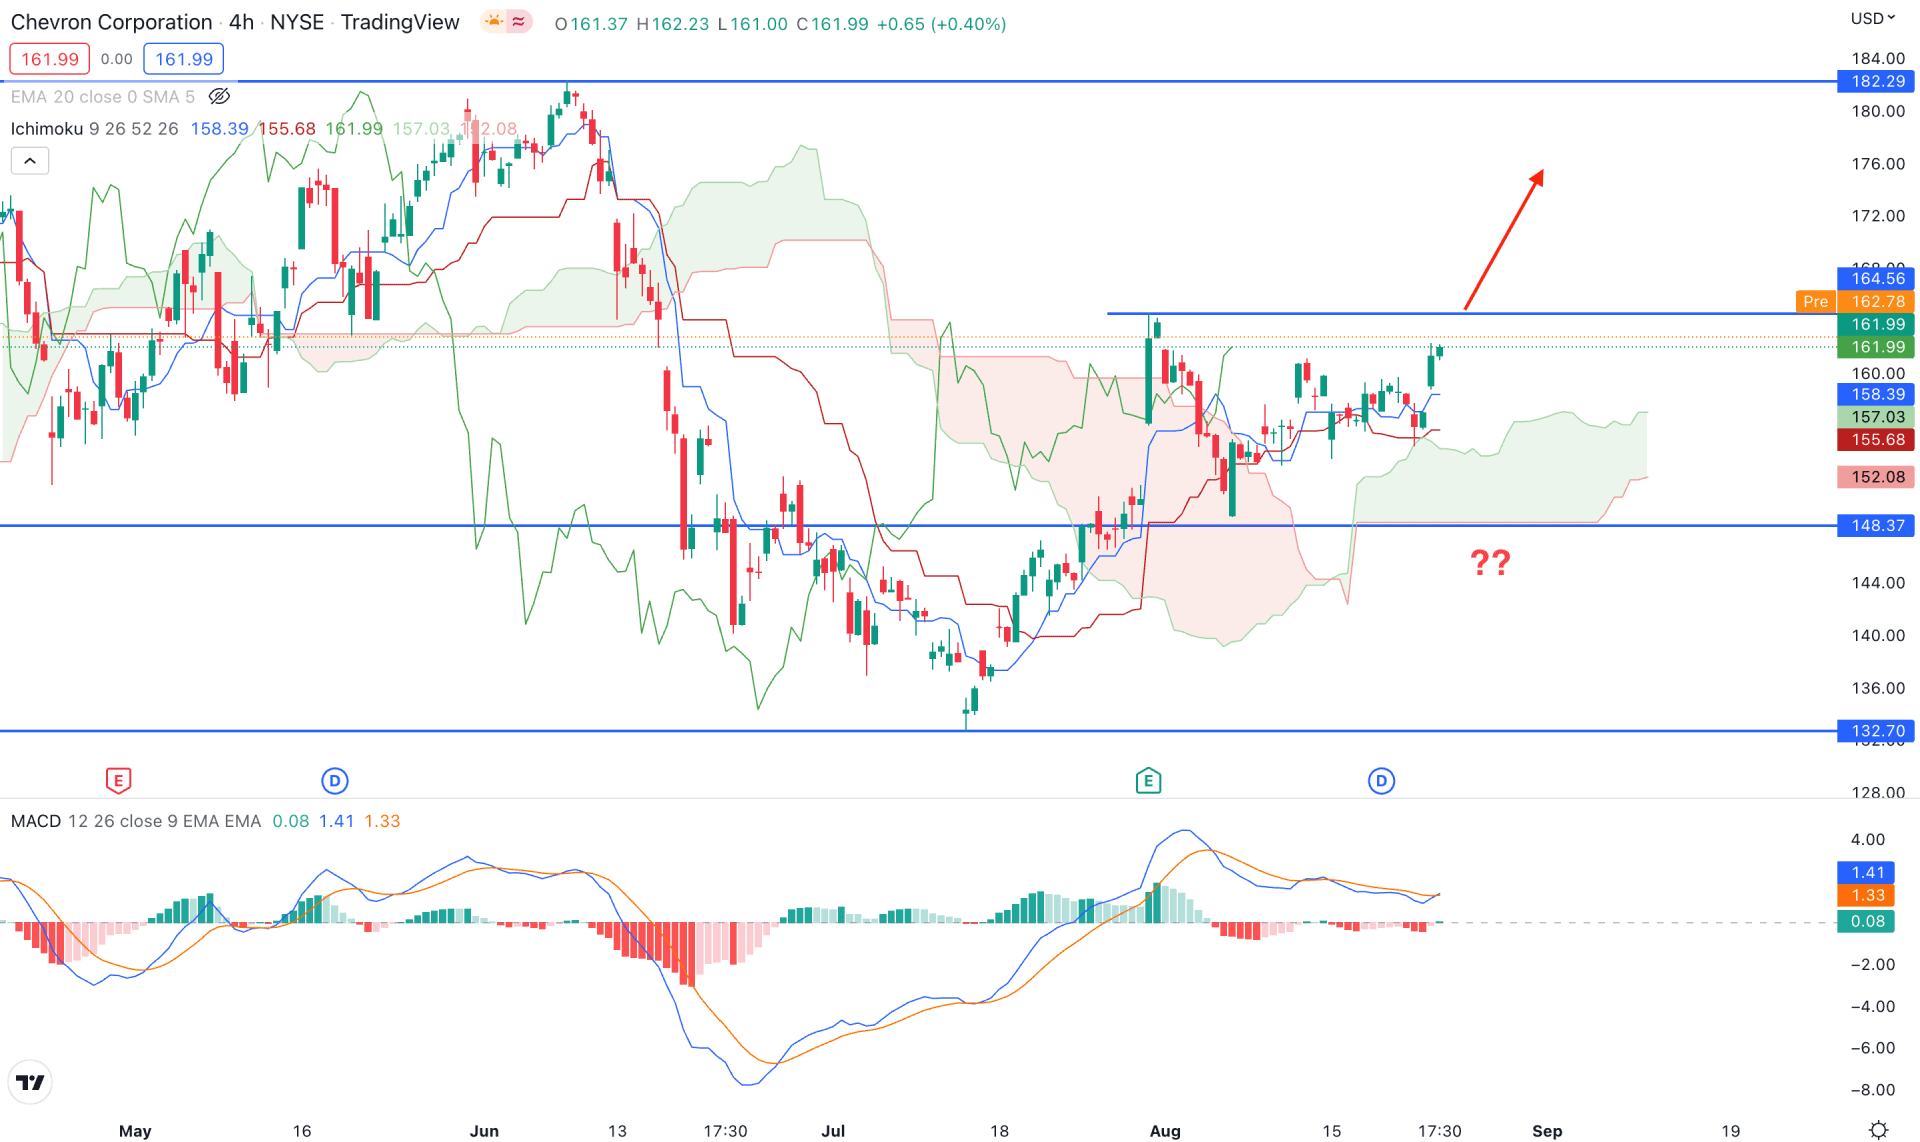
The intraday H4 price shows a strong buying pressure in the CVX chart, where the current price trades above the Kumo Cloud with strong bullish momentum. Moreover, the future cloud is moving up where the Senkou Span A is above the B.
The bullish breakout in the Kumo Cloud came with a swing high at 164.56 level from where a bearish pressure came. However, sellers failed to breach the 148.37 support level and rebounded the price above the dynamic Kijun Sen.
The MACD Histogram in the indicator window shows a corrective momentum where the MACD EMA’s are preparing for another bullish pressure. In that case, investors should find the MACD Histogram above the neutral line with a bullish signal from dynamic Kijun Sen.
Based on the H4 Chevron price forecast, the buying possibility might extend if a bullish H4 candle appears above the 164.56 swing high. In that case, the bullish pressure may extend towards the 182.29 resistance level. On the other hand, the bearish possibility might open if an H4 candle comes below the 148.47 support level.
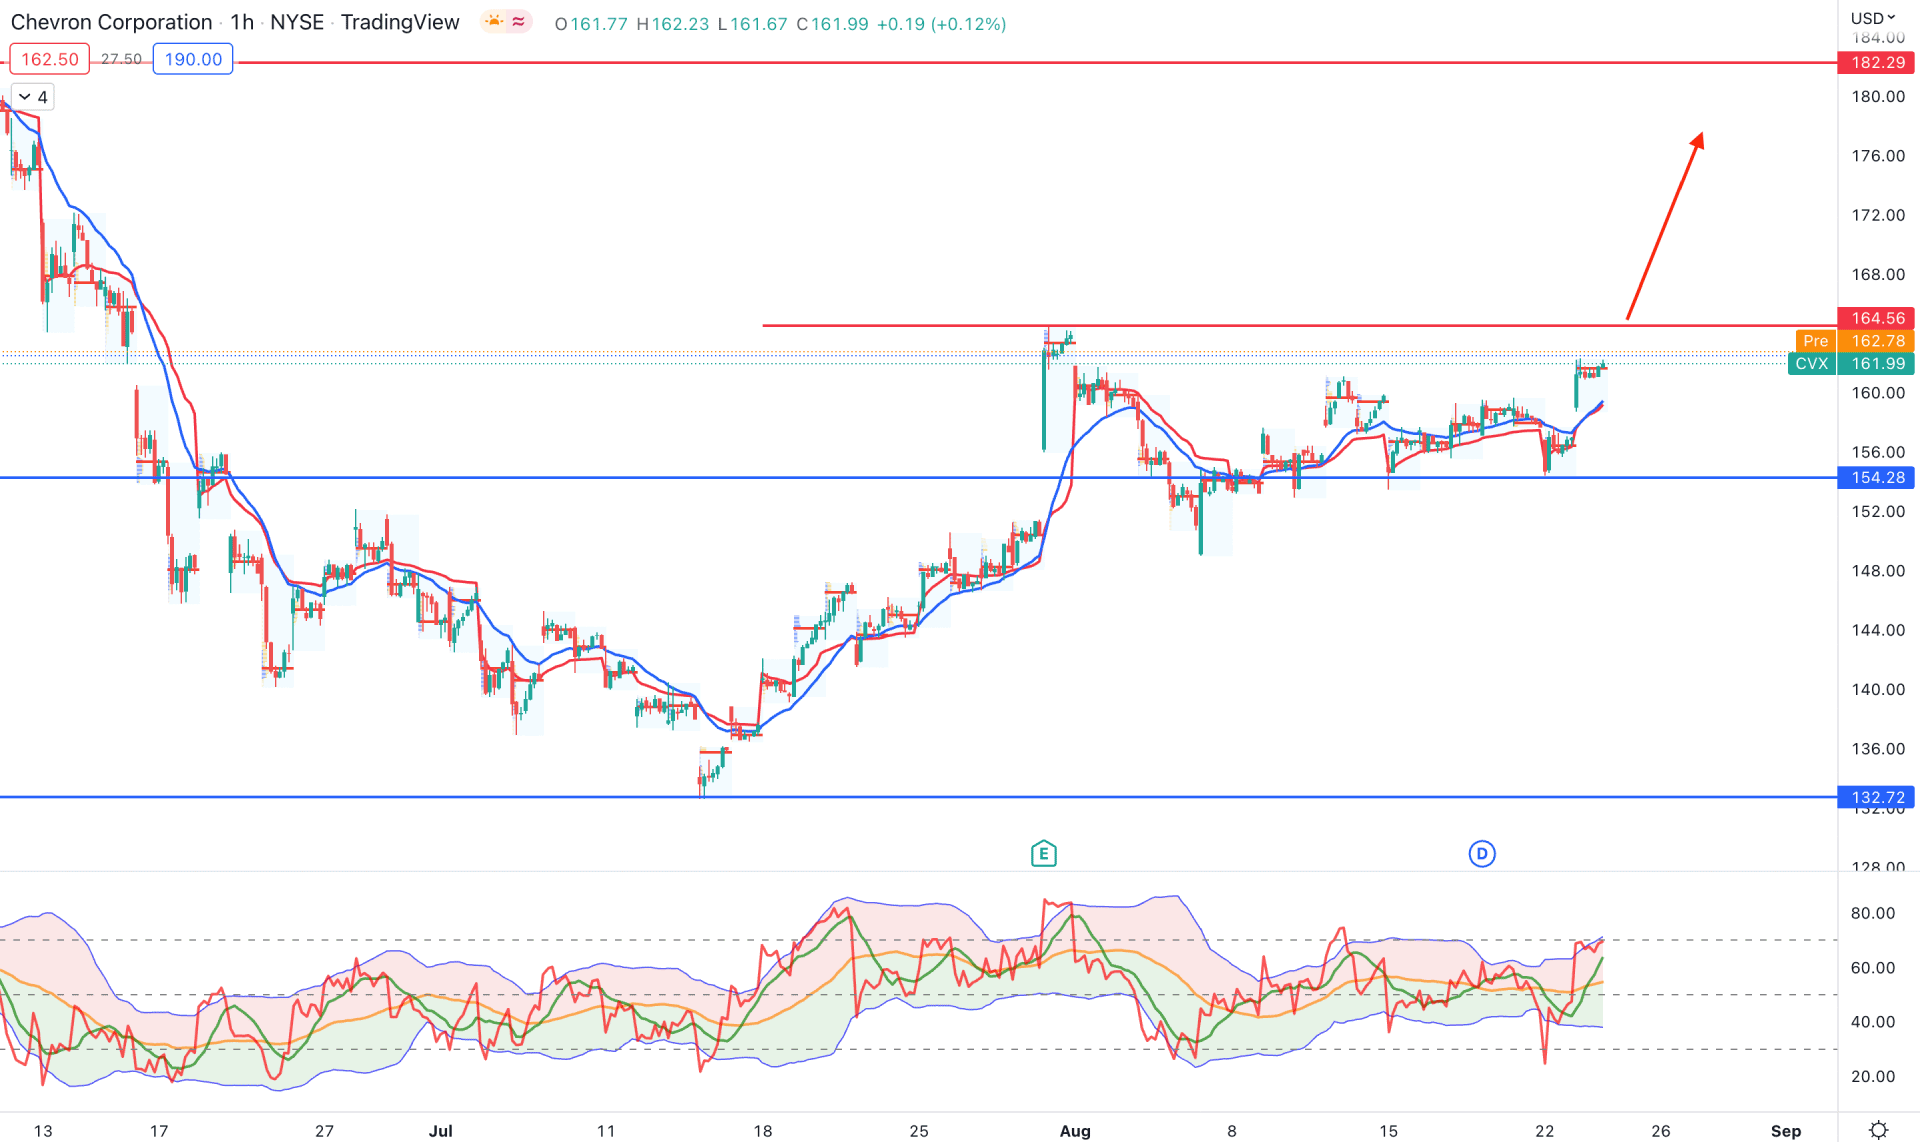
In the H1 price action, Chevron Stock (CVX) showed a pre-breakout structure where the current dynamic 20 EMA and weekly VWAP are below the price. Moreover, the intraday high volume level is at 161.98 level, up from the previous level of 156.33.
The indicator window shows strong buyers’ momentum from the Traders Dynamic Index Indicator, where the current TDI line is above the 50% level. Therefore, the bullish pressure may extend until the TDI level reaches the 40% zone.
Based on the H1 price prediction, the main aim of this instrument is bullish after finding an hourly close above the 164.56 swing high, which will increase the possibility of testing the 182.29 resistance level. On the other hand, the break below the 154.28 support level would open a bearish possibility toward the 132.72 support level.
Based on the current multi-timeframe analysis, Chevron Stock (CVX) might extend the bullish pressure towards the 182.29 level in the coming days. However, investors should find an intraday bullish break of structure to validate the buying opportunity.


