
Published: October 4th, 2022
The long-term success of Chevron Inc (CVX) came with the integrated business model, which includes oil and neutral gas production and mainstream assets alongside gas stations, which diversified the value chain of almost the entire energy industry.
There is something that can offset the stresses of lower energy prices, like refining, which is profitable during this period. However, the primary driver of performance is neutral gas and oil prices. It is only a portion of the story.
The conservative nature flows through the company’s balance sheet. The debt-to-equity ratio of Chevron is 0.17 times, which would be low for any company of the closest peer group. Still, it has the flexibility to take debt to support dividends and continue investing in tough times.
The total earnings of Chevron was 11.6 billion in Q2, 2022, an increase from 3.1 billion last year, which declares how profitable the energy business is. Other energy companies are also doing well but shouldn’t expect this incredible result to last longer.
History is clear that energy stocks can decline, and you should prepare for a worst-case scenario with picking stocks. The integrated energy giant Chevrons can probably be an attractive deal with the future inevitable headwinds.
Let’s see the future price direction of Chevron Inc stock analysis from the Chevron Stock (CVX) technical analysis:
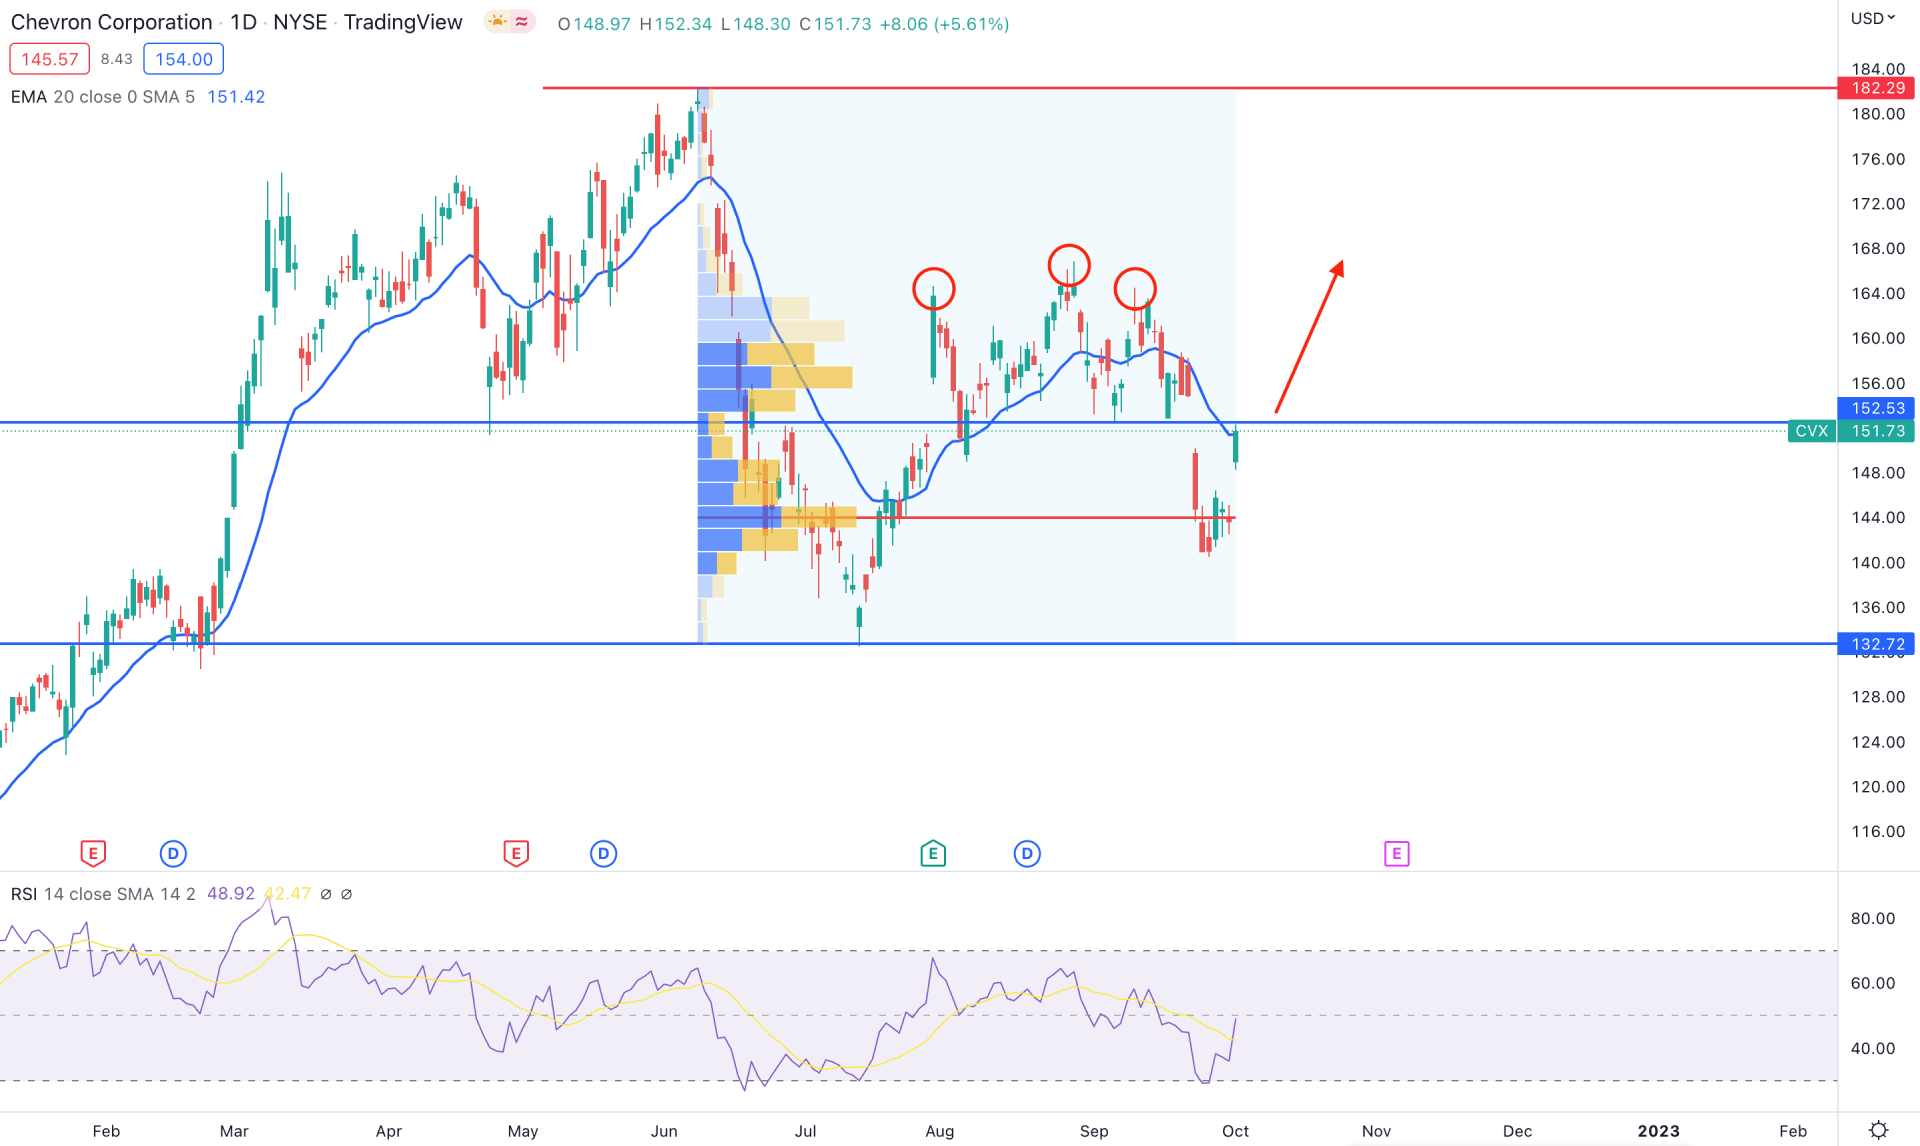
In the daily Chevron Stock (CVX) chart, bears formed a head and shoulder pattern where the recent massive selling pressure below the 152.53 necklines opened a bearish possibility. However, the validation for a short trade depends on how the price revisits and reacts to the neckline.
Although the price is trading below the Head & Shoulder neckline, the broader market direction is still bullish as the stock is trading 29% higher from the yearly opening. Moreover, there is no significant lower low formed since the yearly opening.
Another tool to look at is the fixed range high volume indicator that marked 143.78 level as a high volume level from June 2022 high to July 2022 low. Therefore, if the price remains above the 143.78 high volume level, we can consider the upcoming price direction bullish.
In the indicator window, the Relative Strength Index (RSI) tested the oversold 30% level and rebounded to the neutral 50% area. Meanwhile, the Dynamic 20 DMA is working as an immediate resistance, where a bullish recovery above the dynamic level with a daily candle close would indicate a bullish continuation opportunity.
Based on the current market structure, any strong bearish rejection from the 152.53 resistance level with a daily close would open a bearish opportunity towards the 143.78 area. On the other hand, the broader market trend is still bullish where a strong recovery with a daily close above the 144.00 area would extend the buying pressure towards the 182.00 area.
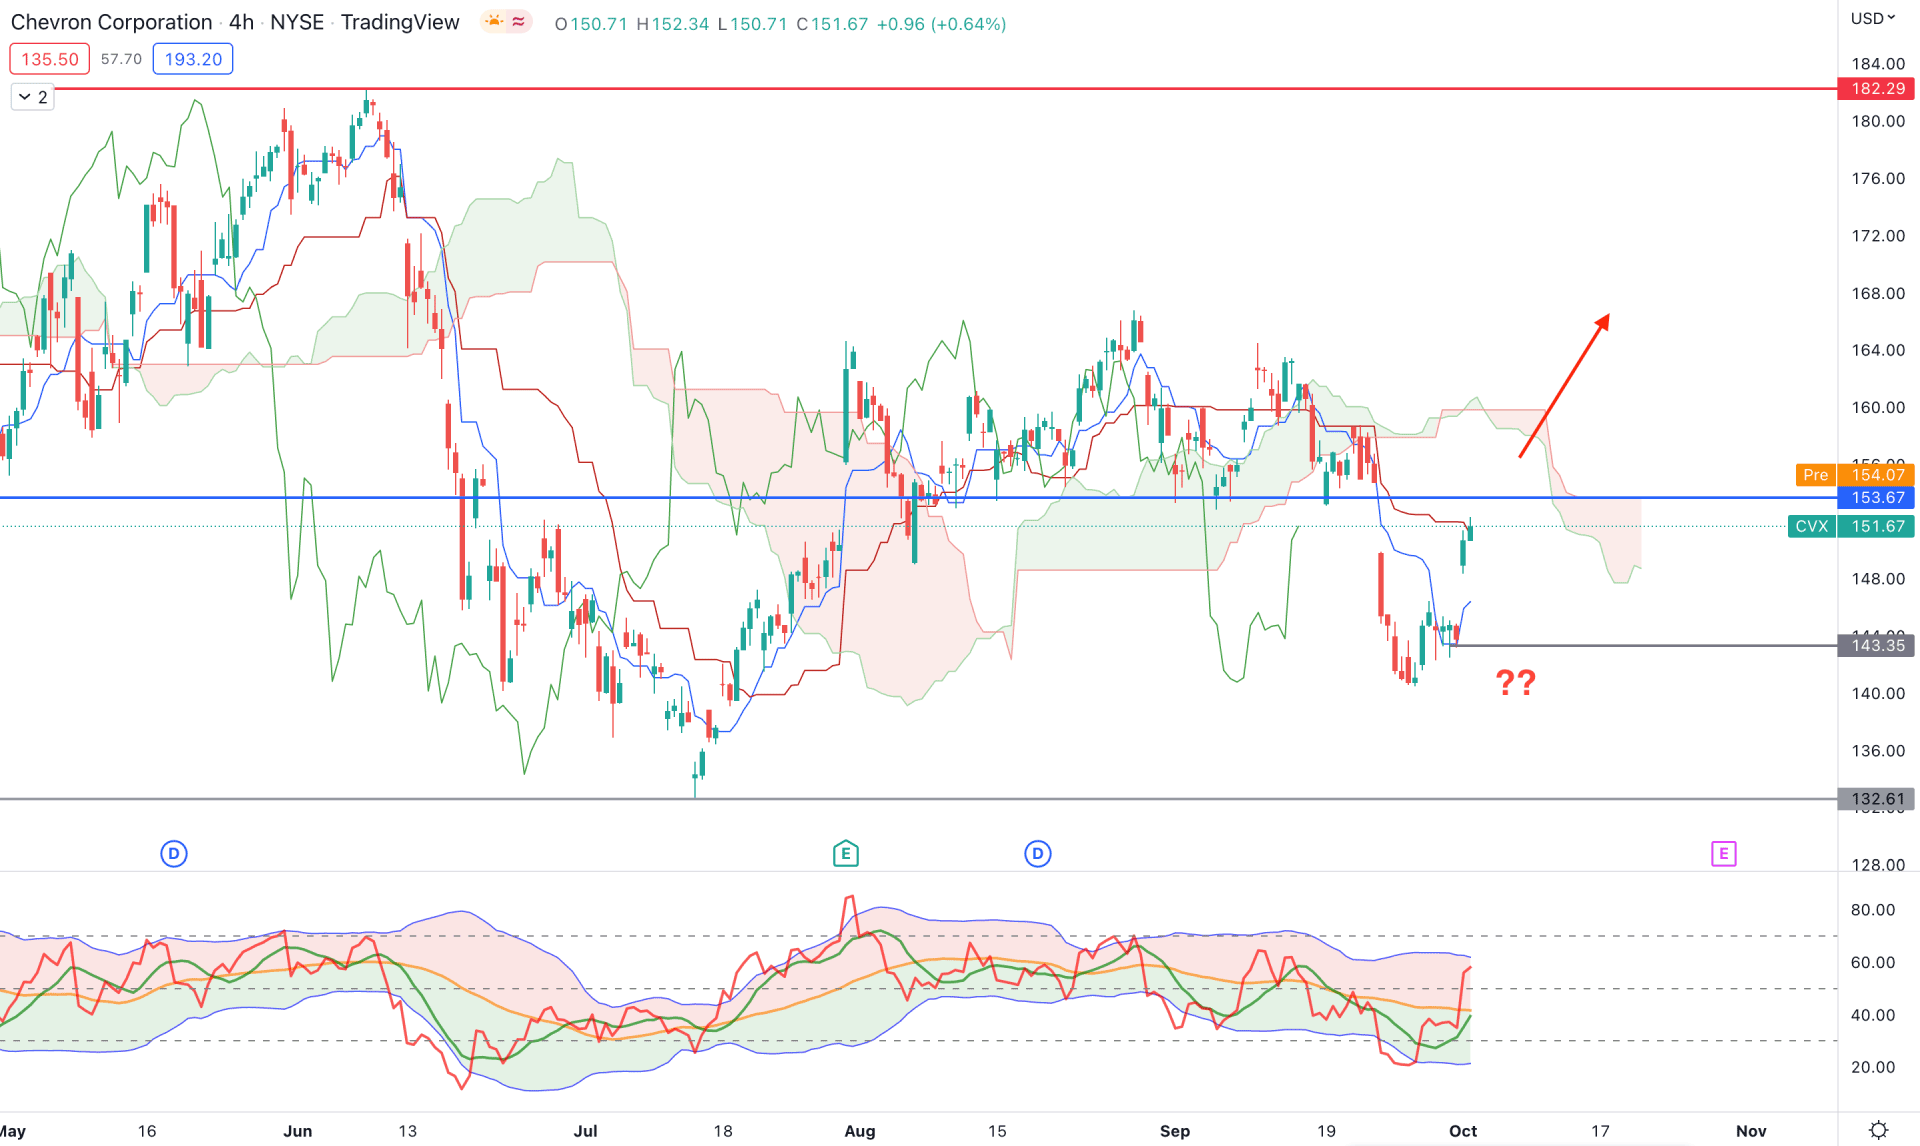
In the Chevron stock H4 chart, the broader market direction is corrective as the current price trades below the Kumo Cloud, where a strong bullish reversal appeared. In that case, a strong selling pressure eliminating the existing bullish impulsive pressure is needed to consider the trend as a bearish continuation.
In the future cloud, the Senkou Span A is still below the Senkou Span B but sloping higher, indicating a buyers’ intervention in the market. Meanwhile, the Lagging Span is below the price with no continuation pressure.
The indicator window shows a different story, where the current TDI level is above 50% and pushing higher to the upper band. The dynamic Tenkan Sen and Kijun Sen moved below the current price, working as immediate support, which may work as a reversal point.
Based on the H4 price prediction, the bullish recovery and an H4 close above 154.67 would open a long opportunity towards the 182.00 area.
On the other hand, a bearish pressure needs to come below the 143.35 level with a bearish H4 before aiming toward the 132.61 support level.
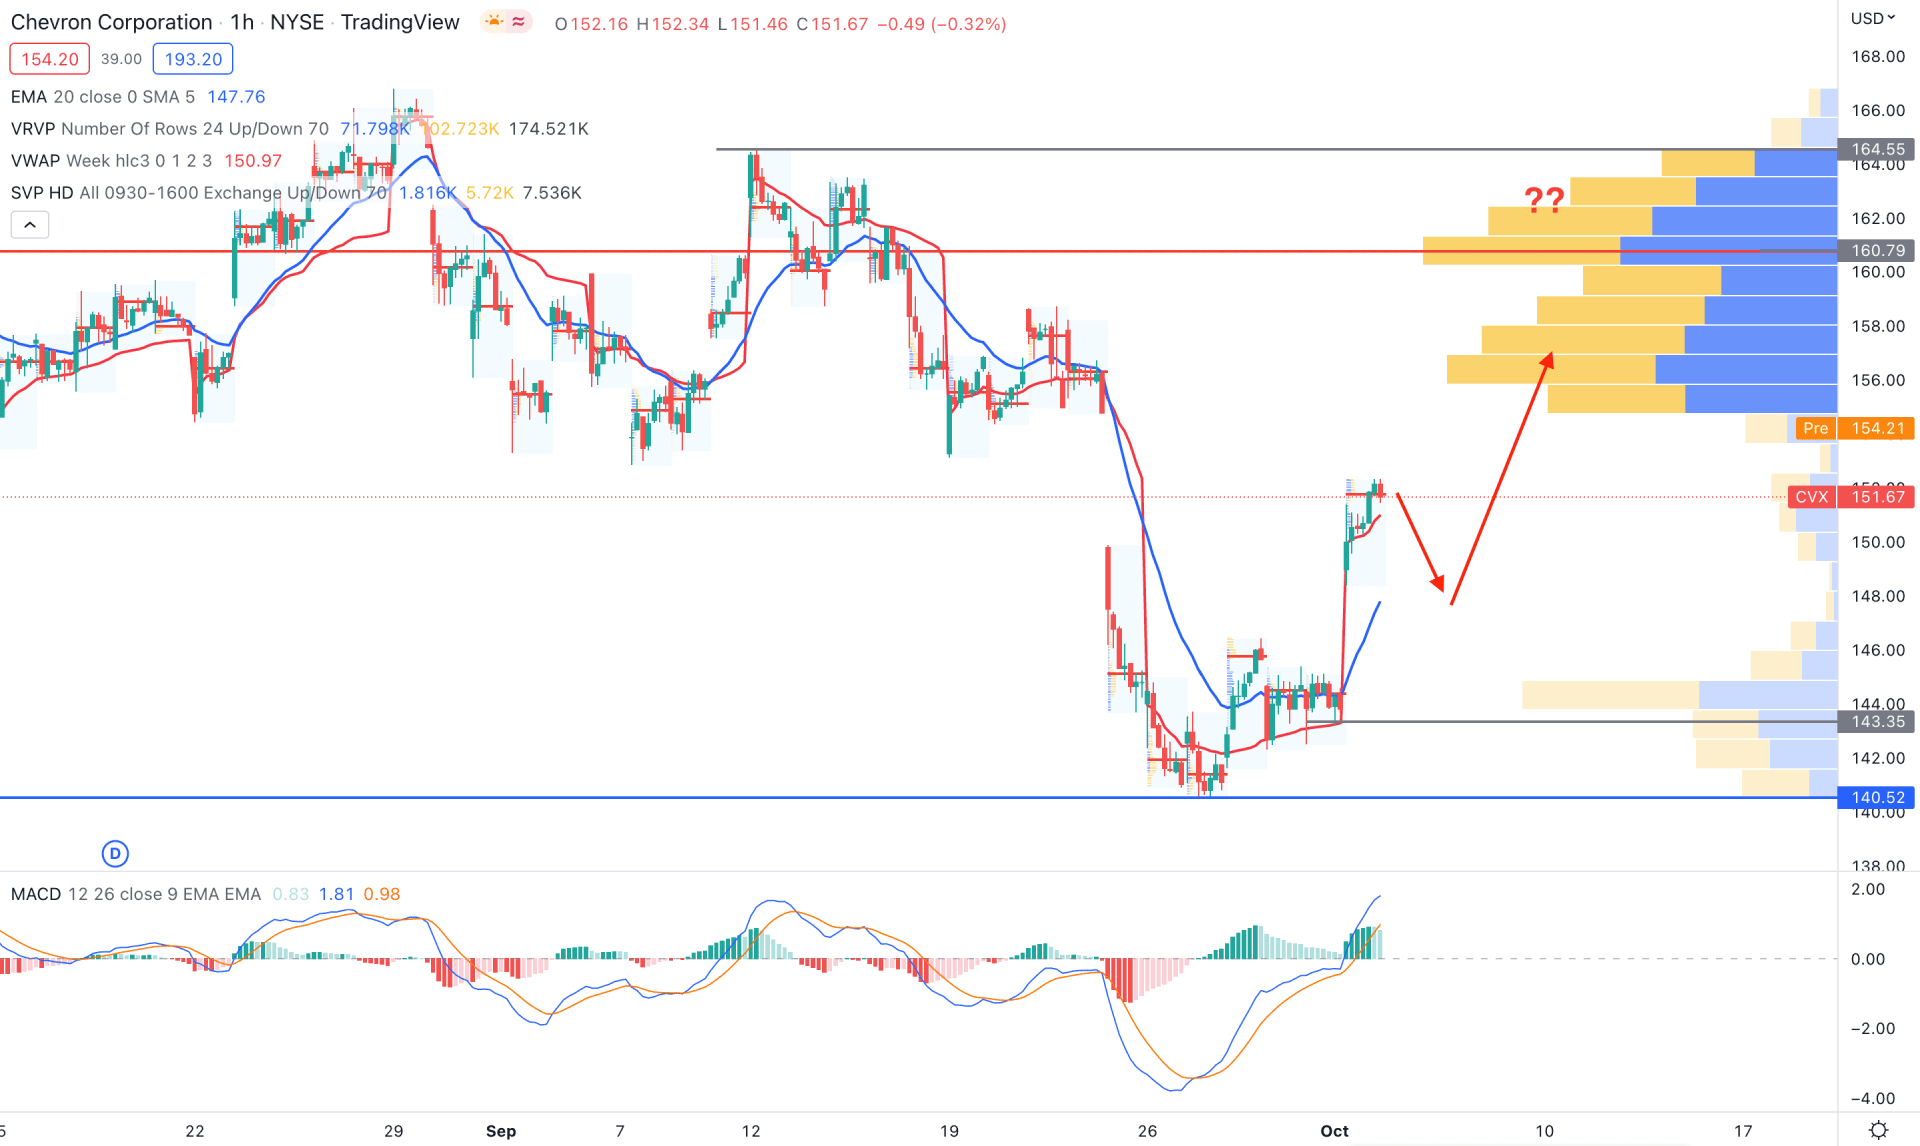
In the H1 timeframe, the market context is different; the current price is still below the 160.79 visible range high volume level. In that case, a bullish recovery above the 160.79 level is needed to consider the current price as a trend reversal,
The current price is still above the dynamic 20 EMA and weekly VWAP, which could open a bullish opportunity to catch the correction. The MACD Histogram is still bullish where the MACD Line is above the neutral area.
Based on the H1 price prediction, any bullish rejection from 148.00 to 140.00 area could open a long opportunity, targeting the 160.79 level. Moreover, breaking below the 140.52 level is needed to consider the market trend as bearish before targeting the 130.00 area.
Based on the current multi-timeframe analysis, Chevron Stock is facing a critical resistance level from which a bearish rejection could validate the Head & Shoulder pattern. However, the trend trading opportunity is available if the price moves above the 153.00 level with a daily candle close.


