Published: January 30th, 2025
Chevron (CVX) is expected to provide near-term guidance in its Q4 earnings report this week, emphasizing enhanced free cash flow predictions for 2025 and 2026. This advice is anticipated to highlight the benefits of two major drivers: higher production from the Permian Basin and the Future Growth Project (FGP) at the Tengiz oil field in Kazakhstan starting earlier than anticipated.
A major milestone was reached last week when Chevron reported that Tengizchevroil, its 50%-owned affiliate, had produced its first oil at the FGP. With the extension adding 260,000 barrels per day at full capacity, the FGP, currently Tengiz's third processing plant, is expected to boost output to one million barrels of oil equivalent per day.
Analysts pointed out that, due to macroeconomic difficulties and broader industry developments, consensus projections for Chevron's Q4 earnings had decreased by more than 10% since mid-December. Chevron is expected to report Q4 adjusted earnings per share (EPS) of $2.16, which is somewhat higher than the $2.15 consensus expectation, according to RBC.
Let's see the further outlook from the CVX technical analysis:
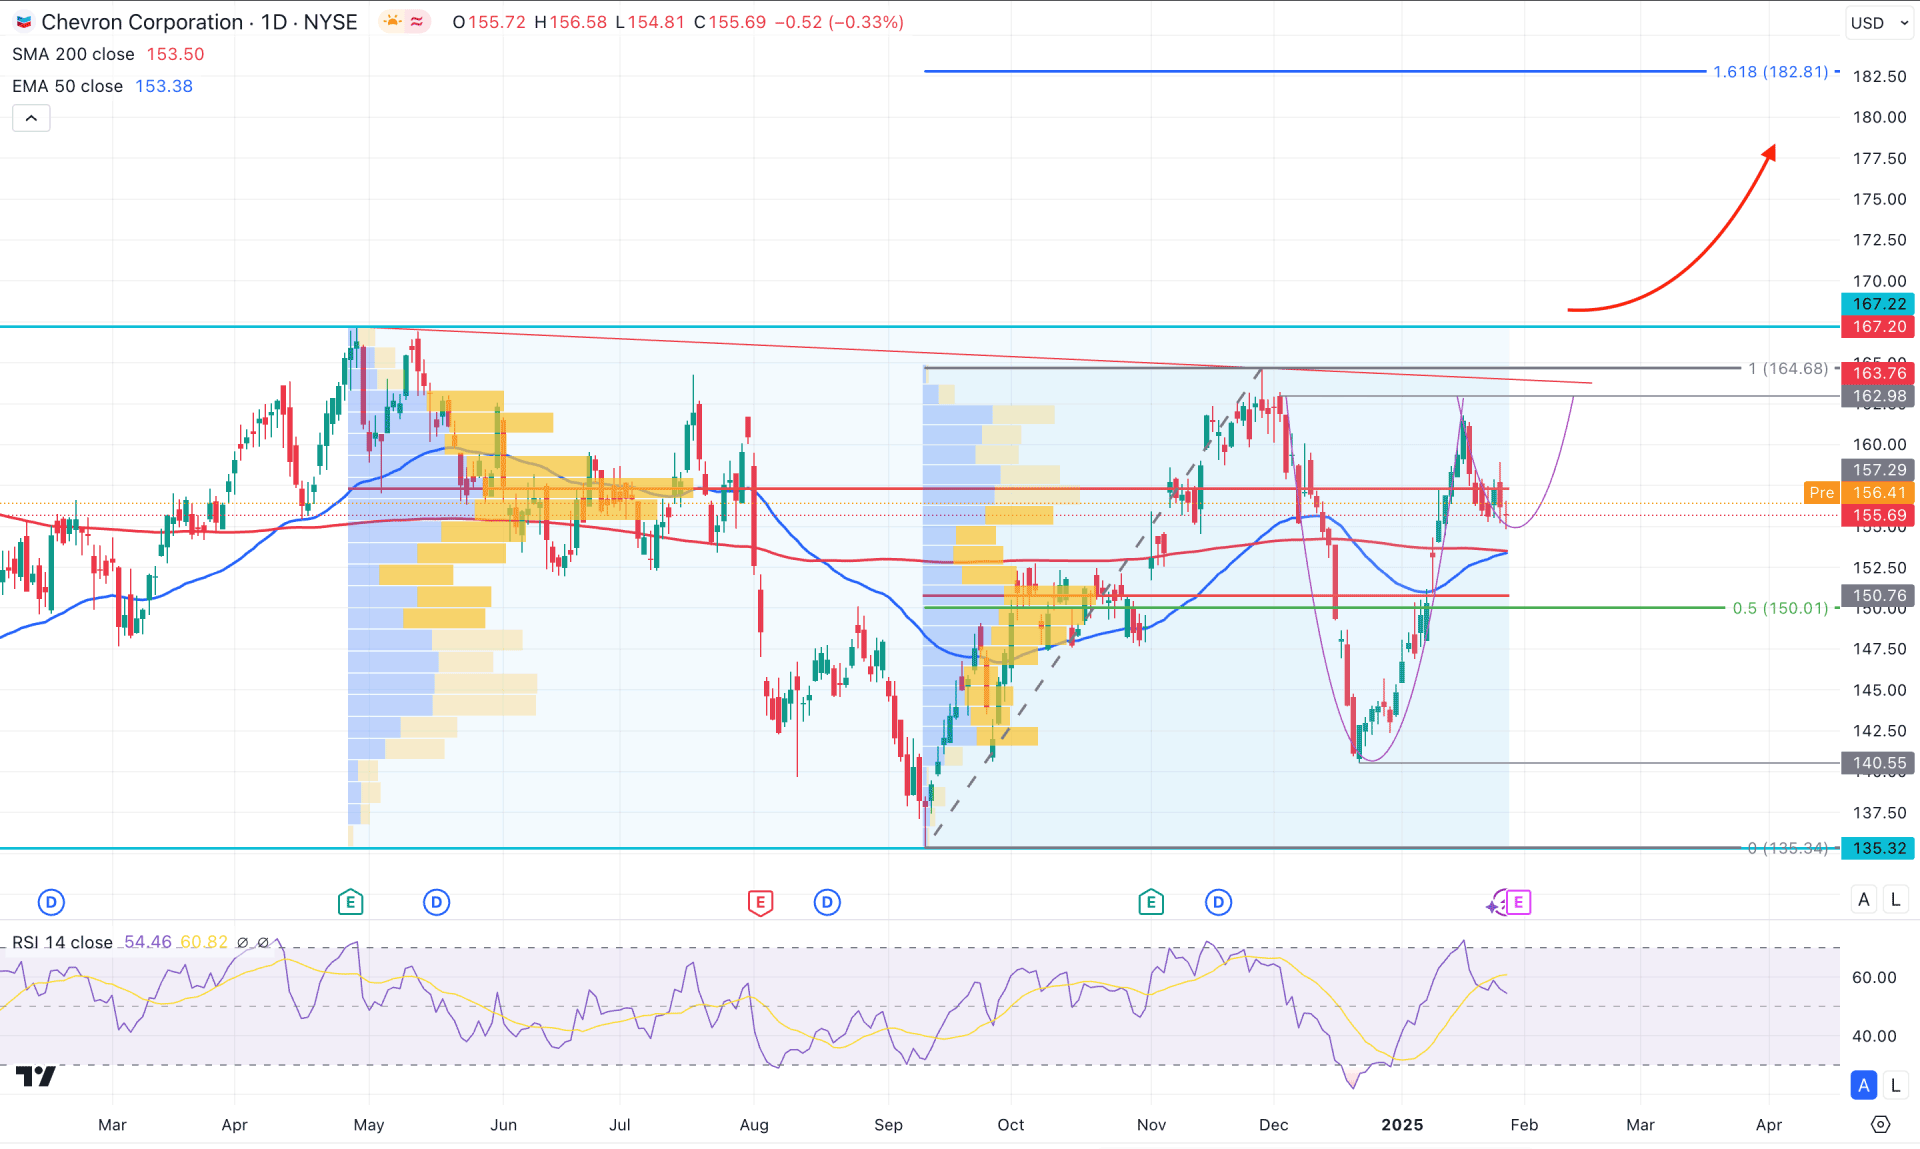
In CVX's daily chart, prolonged sideways momentum is visible, from which a valid bullish breakout can resume the broader bullish trend. Investors should primarily monitor how the price trades within the ongoing range, from which any pre-breakout structure could be a long signal.
In the tradable range, the potential top is visible at the 167.20 level, a decent double-top high. On the downside, the bottom is visible at the 135.22 level, which became important as it swept the liquidity from the existing 140.00 low. The most recent recovery from the 140.55 low shows a rebound from the 0.618 to 0.718 Fibonacci Retracement zone of the existing swing, which signals a valid price reversal.
In the volume structure, the consolidation phase is visible as the volume from two different time zones shows two different price levels. However, overcoming both price levels could be a strong bullish factor for this stock, which might result in a range breakout.
The main chart shows the corrective price from the dynamic line. The 200-day Simple Moving Average remains sidelined below the current price. Moreover, the 50 day EMA reached the 200 day SMA line, forming an early bullish break structure.
Based on the daily outlook of CVX, the first bullish signal might come from the V-shape recovery with a stable market above the 164.68 swing high. However, a failure to overcome the resistance level with a Cup & Handle formation might provide another long opportunity. In cases, the primary resistance is at the 170.00 level; overcoming this line could extend the momentum towards the 182.81 level, which is a 161.8% Fibonacci Extension point.
On the bearish side, the price is still trading at the premium zone of the range from where a valid buy-side liquidity sweep with a bearish recovery below the 50-day EMA is possible. In that case, the downside pressure might extend and find support from the 140.55 low.
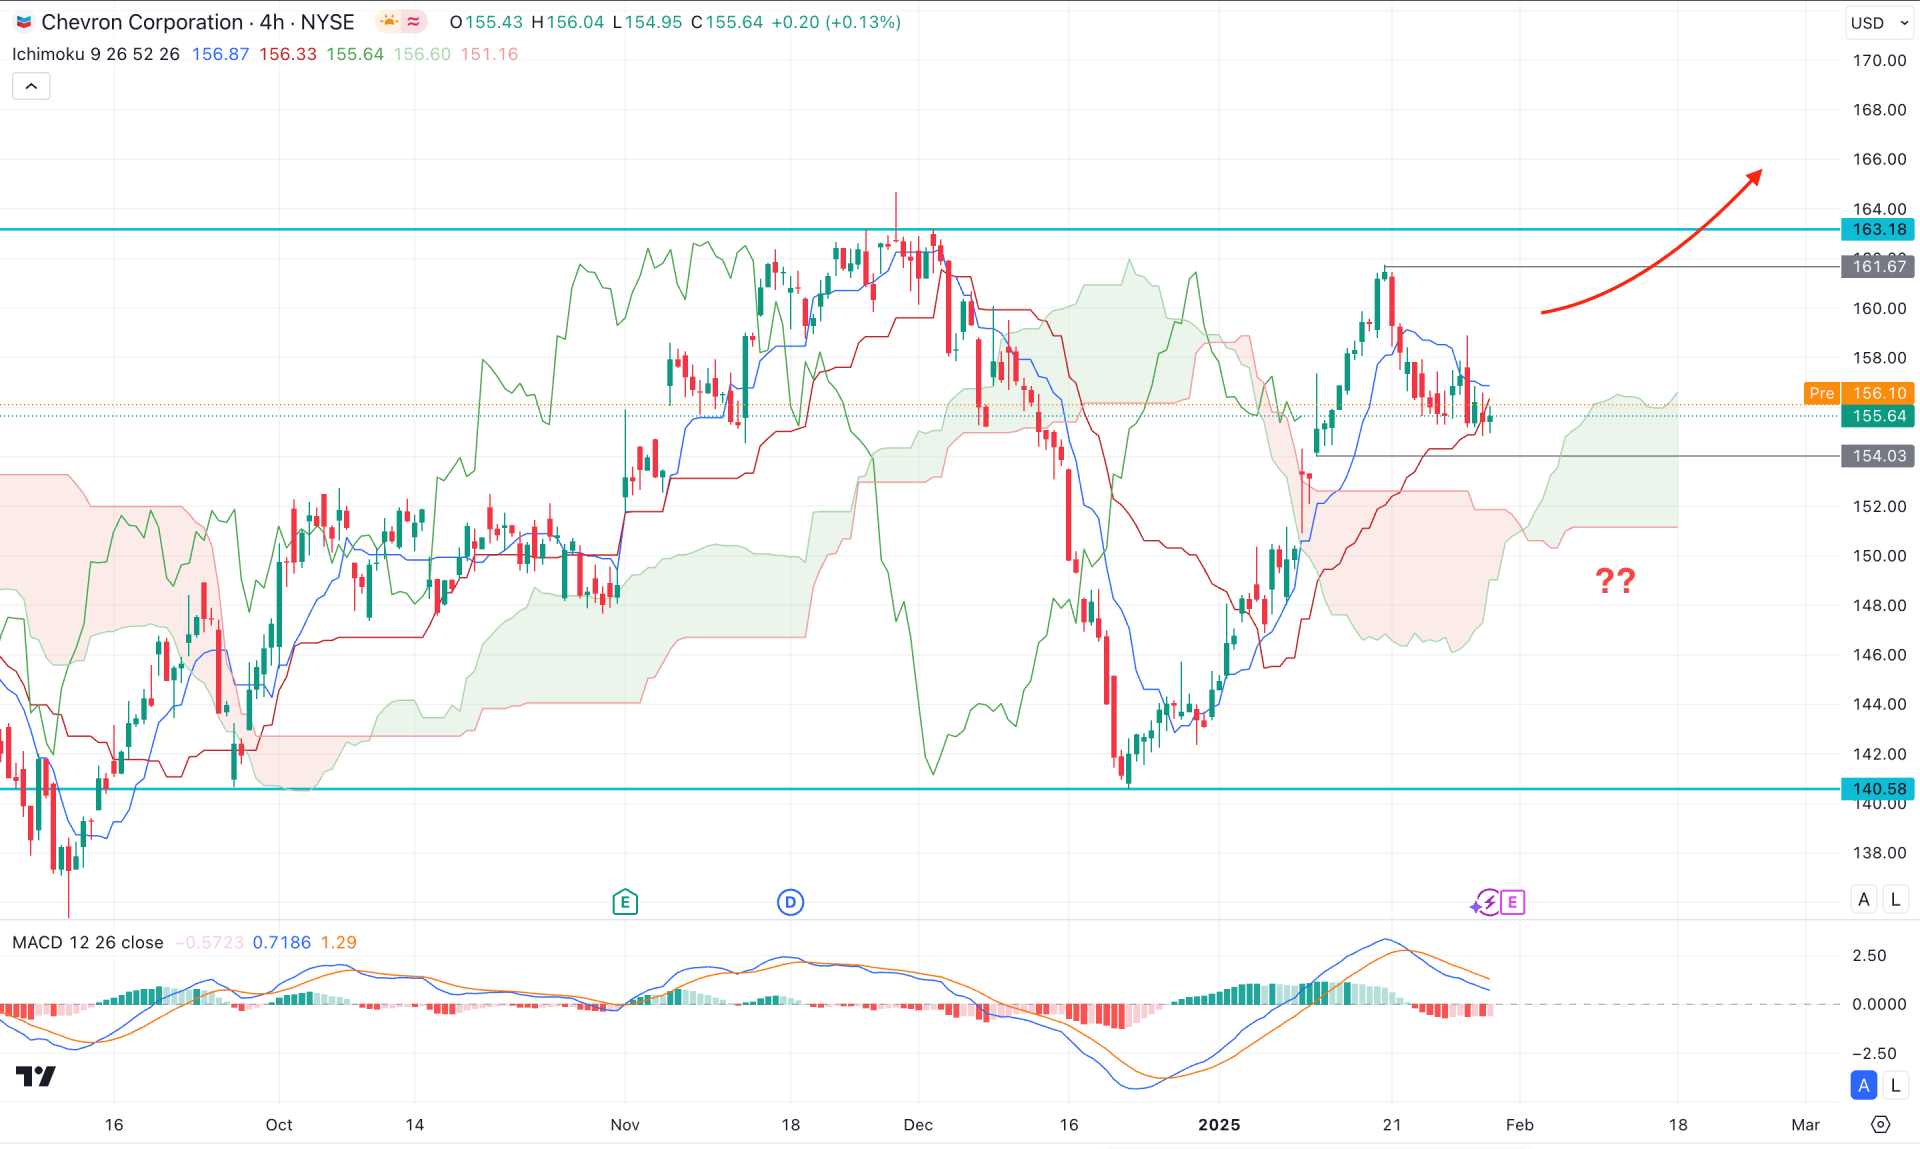
In the H4 timeframe, the ongoing market momentum is bullish as the Ichimoku Cloud is below the current price, working as a support.
In the Futures Cloud, the Senkou Span B remains flat, while the Senkou Span Aimed higher. It is a sign of a short-term buyers presence in the market, which might result in a bullish rally-base-rally formation.
In the indicator window, the MACD Histogram maintained selling pressure as it hovered below the neutral point for a considerable time.
Based on the H4 outlook, a failure to hold the price above the 154.03 support level could be a challenging factor for bulls. A bearish H4 candle below the dynamic Kijun Sen line might lower the price toward the 140.58 support level.
On the bullish side, an upward rebound with a recovery of 161.67 high could open a long opportunity, aiming for the 170.00 psychological line.
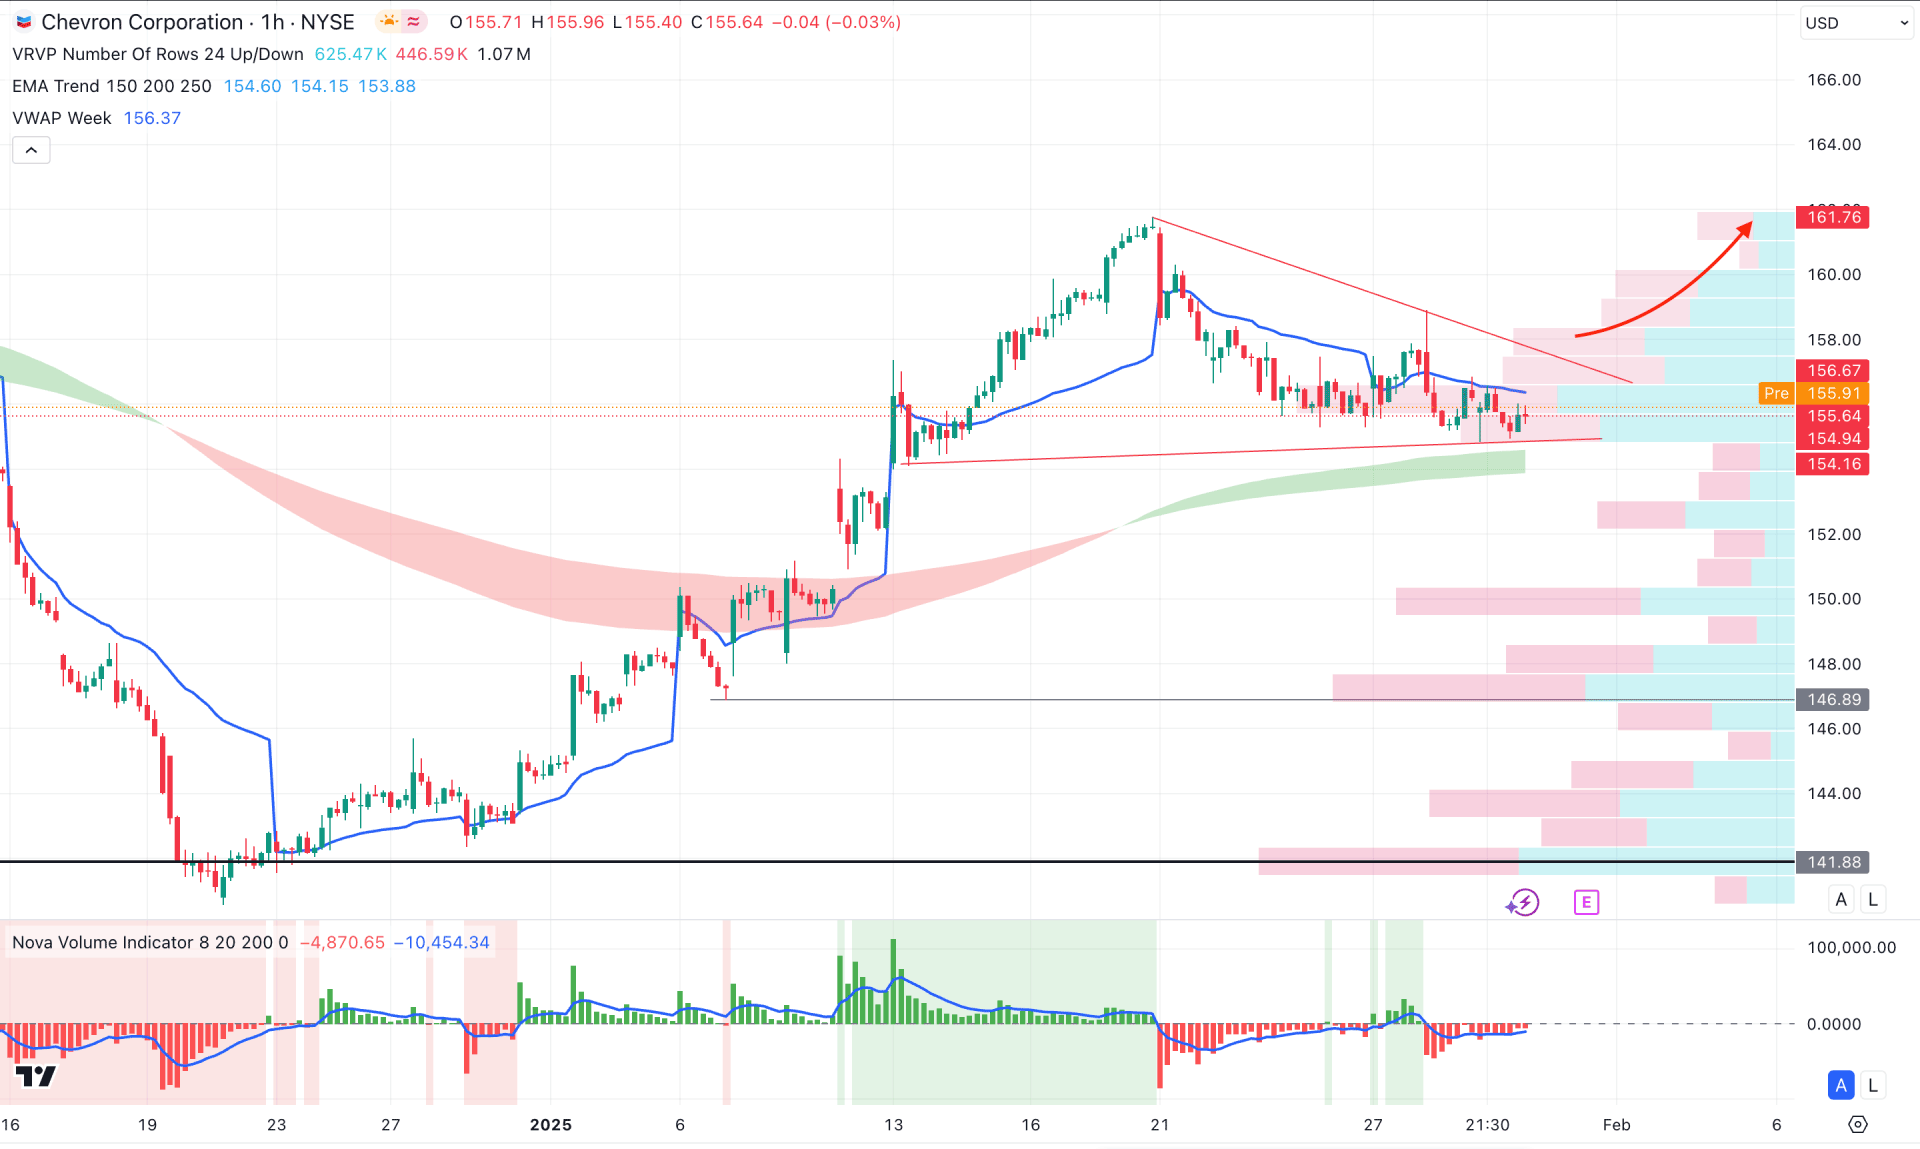
In the hourly time frame, the price is trading above the visible range high volume line, suggesting an ongoing bullish momentum. Moreover, the ongoing corrective pressure is within the descending channel from white the immediate support is at the 154.80 level.
In the indicator window, the Volume Histogram remains below the neutral line while the current line starts to lose the selling pressure.
In this context, a bullish hourly candle above the triangle resistance with a positive Volume Histogram could be a long opportunity. However, the ongoing selling pressure could resume if a bearish H4 candle appears below the Moving Average wave area.
Based on the current market structure, the broader market trend remains bullish for this stock. In that case, any valid bearish reversal from the reliable price area could be a long approach. Investors should monitor how the price trades at the intraday price, as a valid triangle breakout, could be a trend trading opportunity.


