
Published: December 3rd, 2025
The price of Chainlink (LINK) increased by 18% and is currently close to $14.50. Crypto specialists are also noting early breakthrough indicators on the graph and think LINK might be heating up for a major rally towards $47.
Meanwhile, data showed robust demand on launch day, with trading volume reaching $13.81 million and early inflows exceeding $43 million.
Big investors are paying closer attention to Chainlink thanks to Coinbase's role as a custodian and its availability on platforms like Fidelity and Robinhood. Although the ETF is generating attention, the chainlink pattern is providing its own positive message.
Adding to the positive picture, Chainlink has reached an important long-term support trendline. Before the year is up, he thinks this level might serve as a springboard for a significant move towards $26 or $47.
Chainlink has strong momentum going into December thanks to growing institutional inflows, a new ETF that makes it easier for traditional shareholders to acquire, and technical indications that align for the first time in years.
Let's see the complete outlook from the LINK/USDT technical analysis:
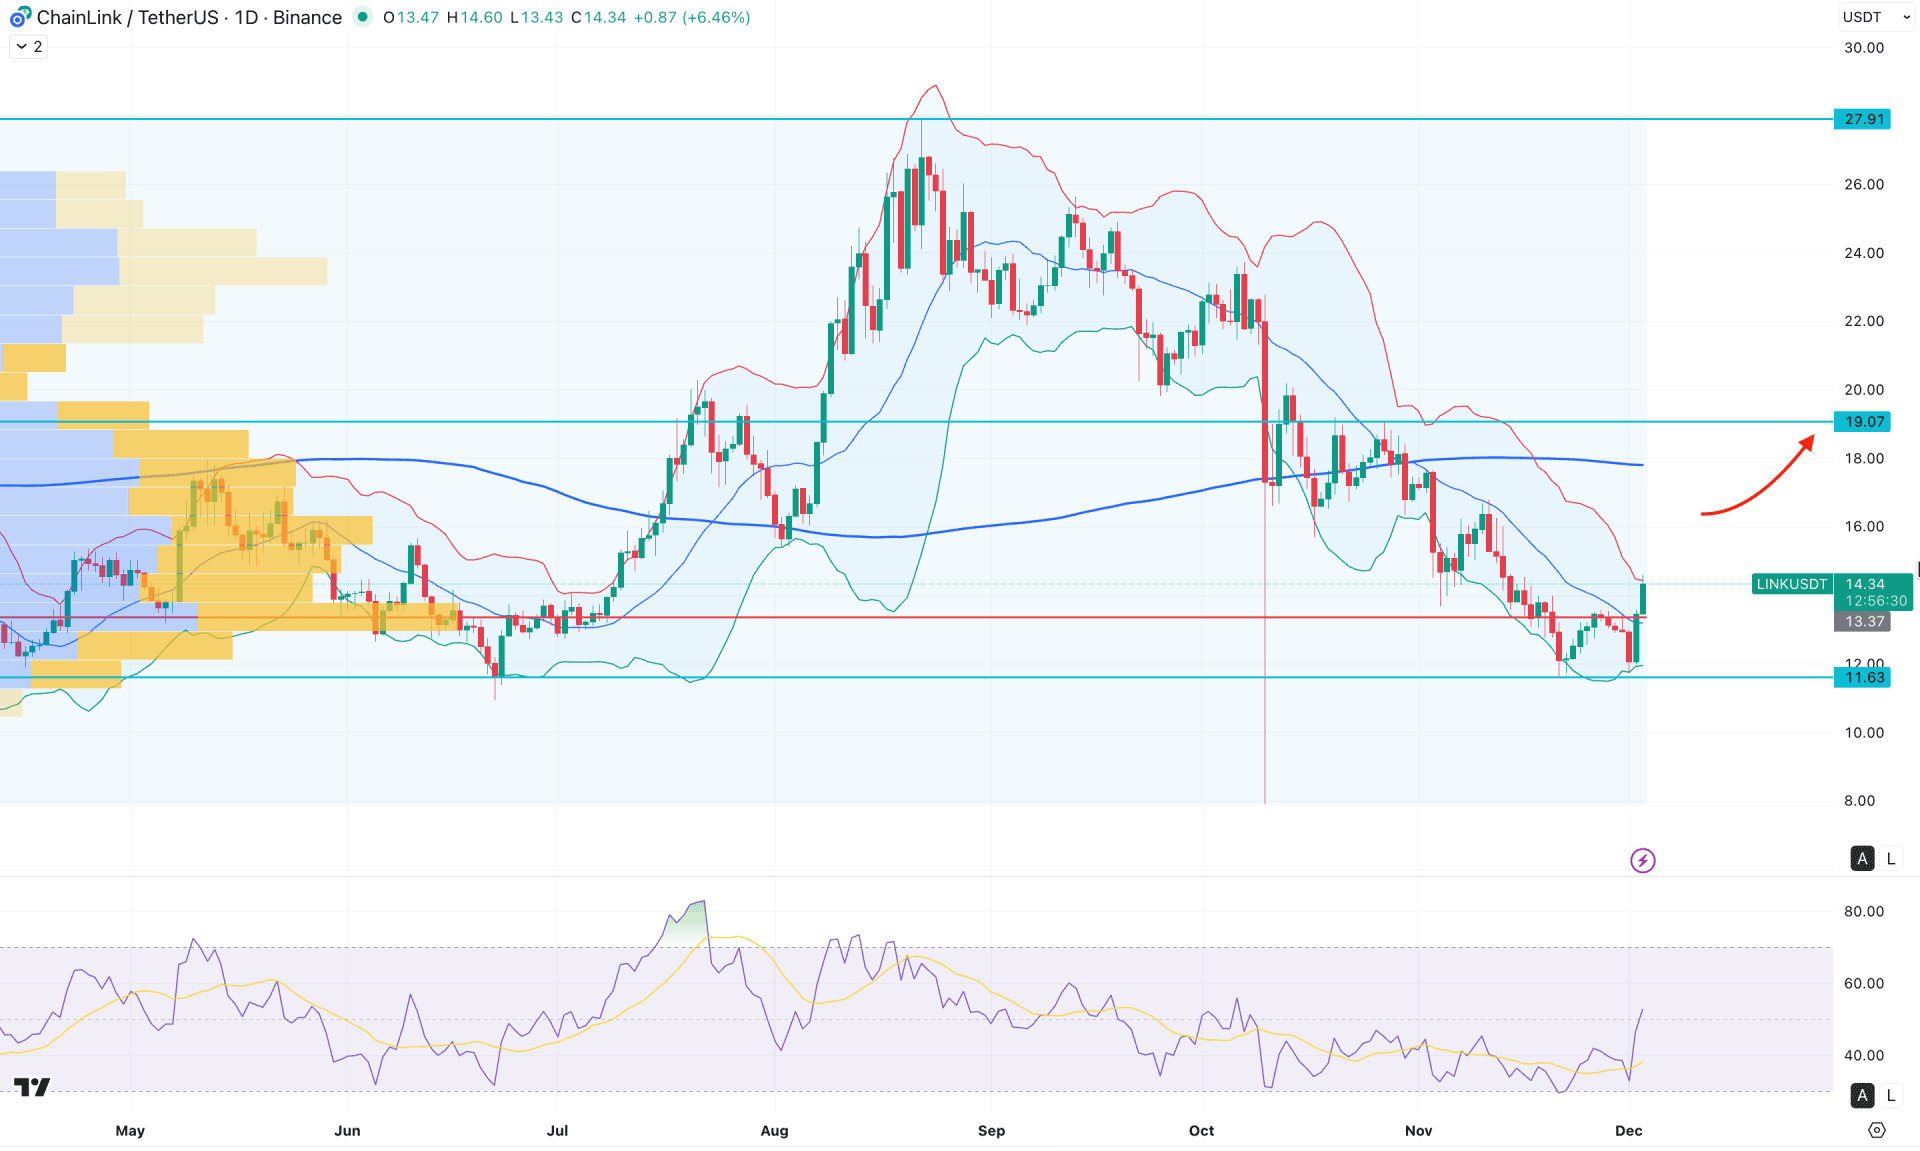
In the daily chart of LINK/USDT, a clear pump-and-dump pattern is visible, with the most recent price trading at a crucial discounted zone. As the price attempts to form a valid bullish recovery from the bottom, traders may need to remain patient before anticipating a long-term bullish trend.
In the higher timeframe, the current price is trading within the existing monthly bearish body, where strong monthly resistance is seen at the 17.16 level. However, the weekly chart shows a strong bullish recovery from the bottom, suggesting that a range extension is highly possible.
In terms of volume, larger trading activity is visible at the bottom, supported by a strong bullish reversal candle formed from the high-volume support level. As long as the price remains above this key level, the primary expectation would be to focus on buying opportunities.
In the main chart, the price is trading above the mid Bollinger Band, while the upper Bollinger Band is acting as immediate resistance. Additionally, the 200-day Simple Moving Average (SMA) is above the current price with a steep slope, signaling a major bearish trend.
In the secondary indicator window, strong bullish pressure is visible from the Relative Strength Index (RSI), which has rebounded above the 50.00 neutral line, indicating growing bullish momentum.
Based on the current market structure, sufficient space remains for the price to move higher and test the 200-day SMA level. As the price is currently facing selling pressure from the upper Bollinger Band, investors should closely monitor how the price reacts in this area. A bullish continuation with a valid daily candle closing above the 200-day SMA could increase the possibility of an upward extension toward the 30.00 psychological level in the long term.
On the other hand, an immediate bearish reversal with a daily close below the high-volume support level might trigger increased volatility. In that scenario, the price may consolidate and retest the 10.00 psychological level before offering another long opportunity.
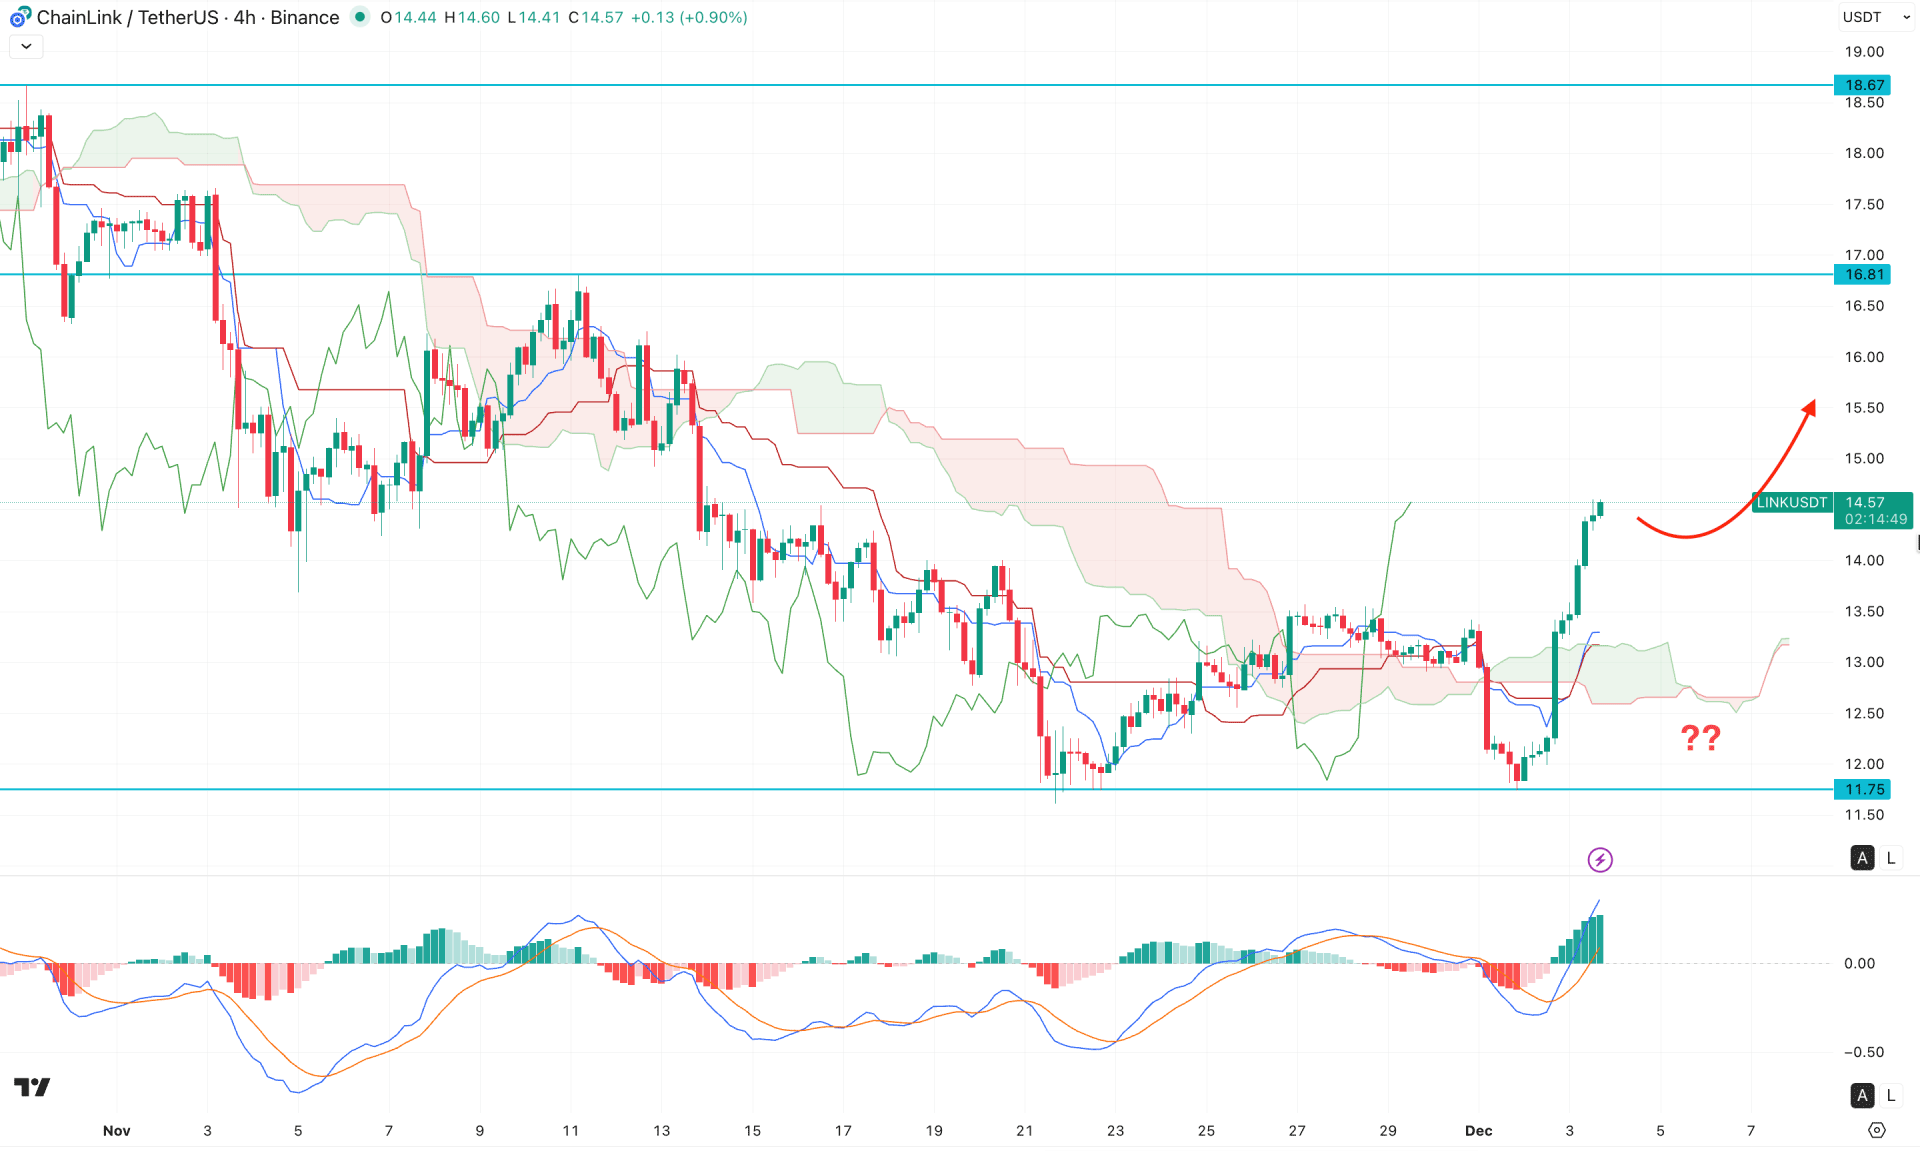
In the four-hour timeframe, a strong bullish recovery is visible above the Kumo Cloud, forming a clear V-shaped rebound. Moreover, consecutive higher highs are developing above the cloud support, which signals that the breakout is solid. However, the gap between the current price and the dynamic lines has widened, indicating a potential bearish correction before the price moves further up.
In the secondary indicator window, the MACD histogram continues rising, while the signal line follows the trend with a bullish crossover in the negative zone.
Based on the overall market structure, the recent bullish breakout has a higher probability of extending upward and finding support near the 16.81 level. However, a potential bearish recovery with an immediate bullish reversal from the dynamic support levels may create a short-term selling opportunity before the price attempts to break above the 18.67 key resistance level.
On the other hand, failure to hold the price above the cloud area could be a challenging factor for bulls. In that case, any immediate bearish move with a four-hour close below the 12.00 level may invalidate the bullish structure and drive the price toward the 10.00 area.
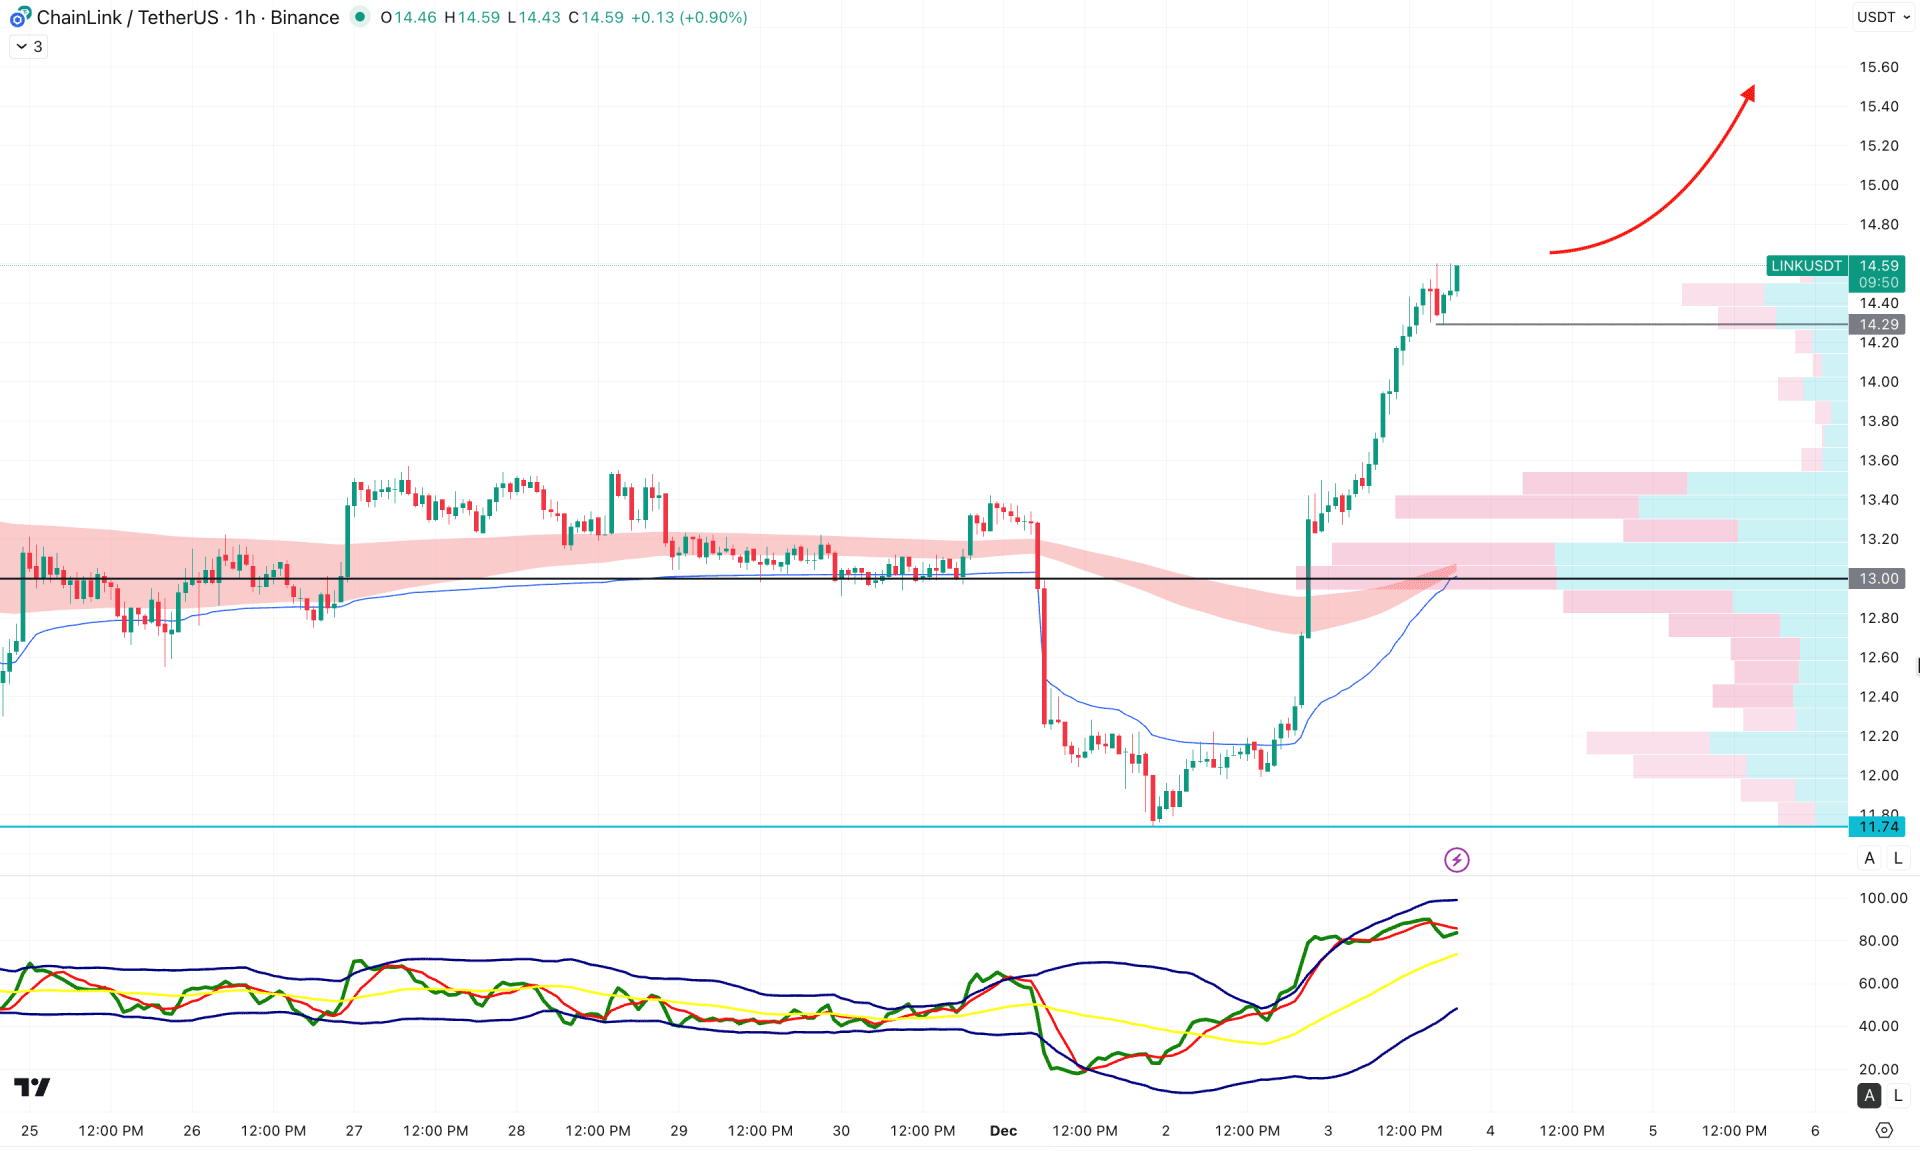
In the hourly timeframe, the price continues moving higher, creating a gap with the dynamic weekly VWAP level, which signals a strong bullish extension. Moreover, the exponential moving average wave is aligned with the intraday high-volume line at the 13.00 level, reinforcing the possibility of another bullish leg.
In the secondary indicator window, the Traders Dynamic Index (TDI) is maintaining a strong position above the 50.00 neutral line, with no sign of bearish recovery at the moment.
Based on the current market structure, the ongoing bullish trend is solid, and the price is likely to move beyond the 15.00 level in the coming hours.
However, an immediate bearish retracement below the 14.29 level could eliminate some recent gains and push the price toward the 13.50 support area before offering another long opportunity. In that scenario, any bullish reversal from the weekly VWAP level could generate a fresh buying signal targeting the 16.00 area.
Overall, LINK/USDT is trading in a discounted zone, where further upside pressure is possible depending on daily validation. As the current intraday price is overextended, any minor pullback toward short-term support with a bullish continuation signal may encourage investors to join the rally at a discounted price.


