
Published: June 30th, 2021
Chainlink price indicates a bullish pressure with multiple signs of changing the trend from bearish to corrective bullish.
The bullish pressure was influenced by a collaboration with Bioeconomy, a multi-chain transaction infrastructure. This project uses the price and activity of users of these dApps through the blockchain network that will allow calculating the transaction fee accurately.
Following the collaboration, Chainlink’s price holds the May 23 low with multiple indications of oversold price. Now, buyers have a higher probability of taking the price in their direction. However, the corrective bullish pressure from the bottom is insufficient to consider the upcoming bullish pressure as vital. According to the LINK 365-days MVRV ratio, this cryptocurrency has been undervalued since March 2020, and there is a higher possibility of rebounding the price following the investors’ accumulation.
Let’s see the future price direction from the Chainlink (LINK) technical analysis:
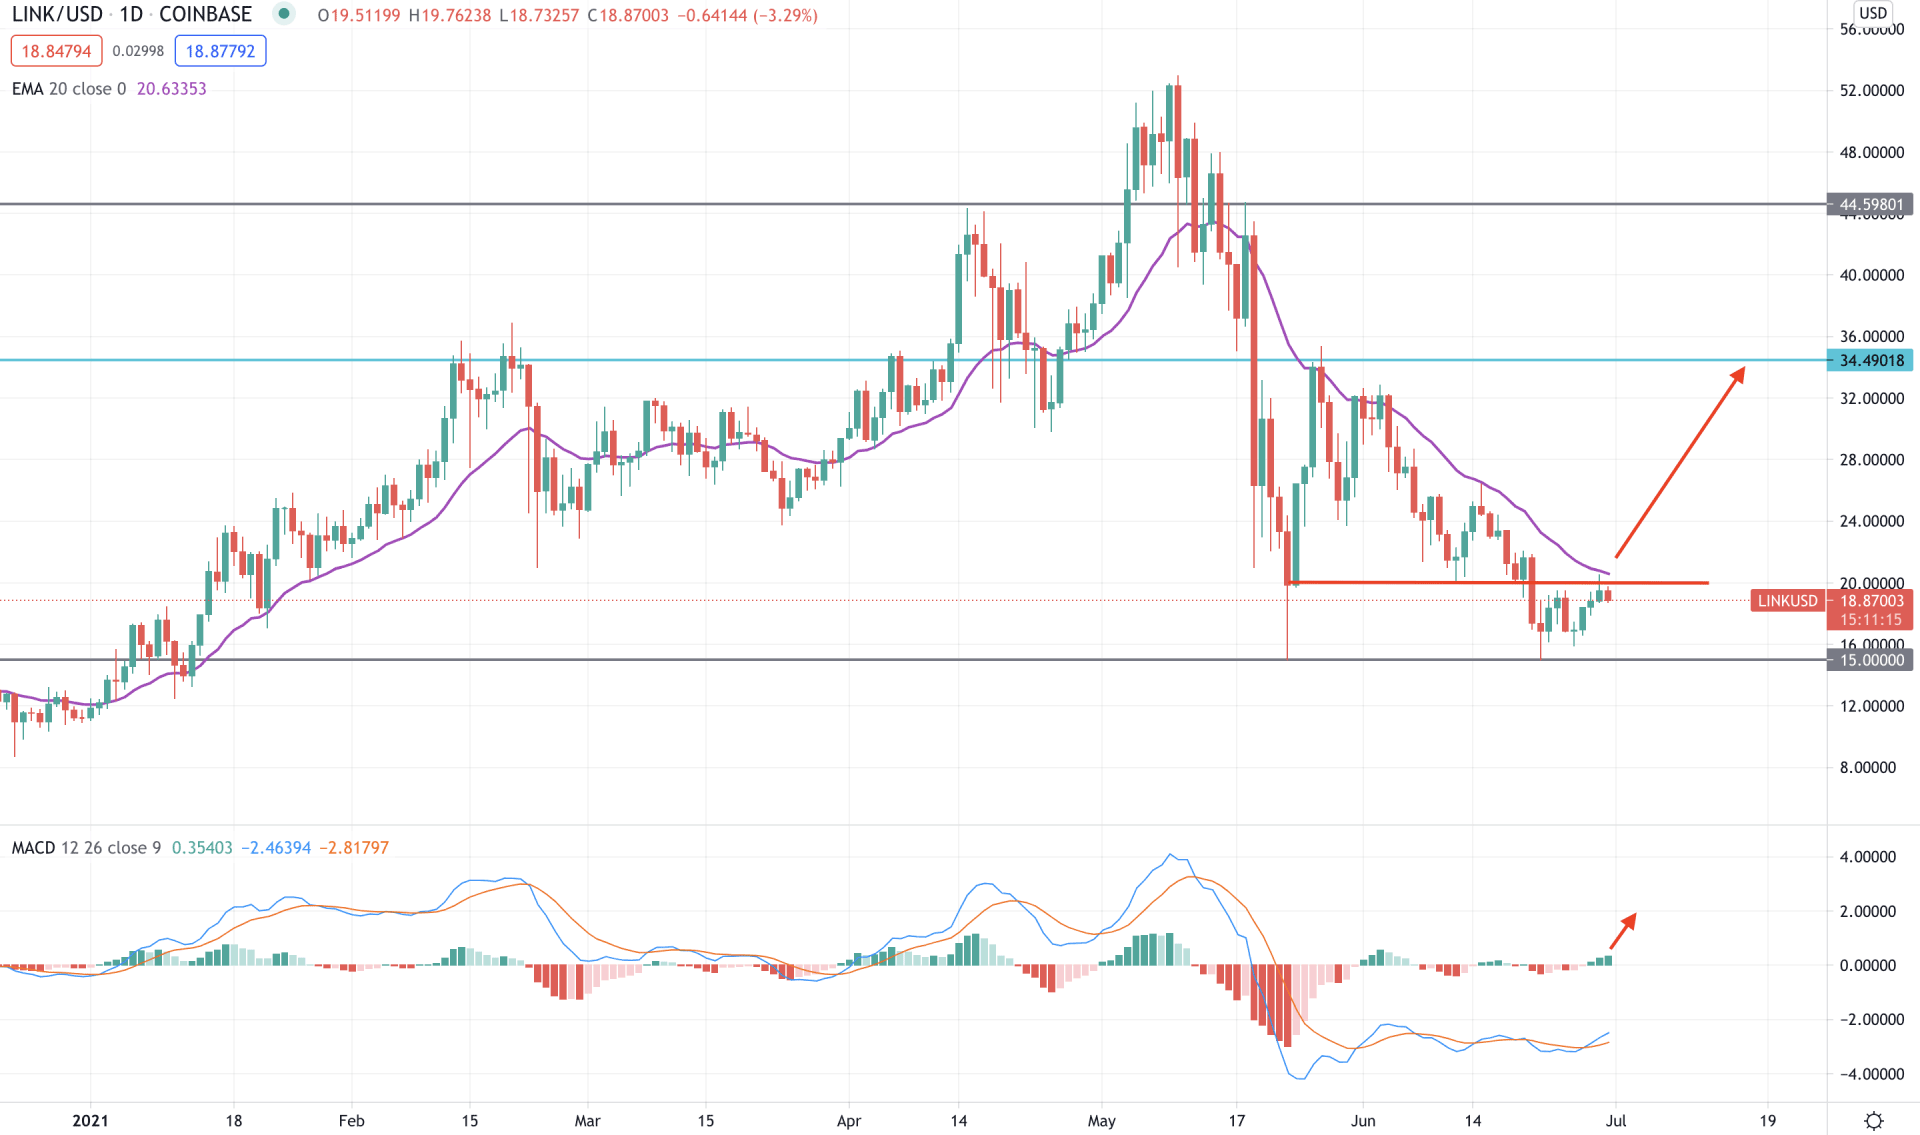
Chainlink price moved down from $53.00 to $15.00 level in a month with more than 70% loss in the price. Later on, the price corrected higher and aimed below the 15.00 support level but failed. As the current price is trading above the 15.00 support level, it has a higher possibility of continuing the bullish pressure in the coming days.
The above image shows the daily chart of Chainlink, where the price is trading above the 15.00 support level. However, the price is still below the 20.00 intraday event level along with the dynamic 20 EMA. Therefore, a strong bullish daily close above the dynamic 20 EMA would create a bullish pressure on the price. Besides, in the Indicator window, the MACD histogram moved to the positive zone and aiming higher, indicating an upcoming bullish pressure on the price.
However, a solid bearish daily close below the 15.00 support level would be an alarming sign for sellers that may take the price lower towards the 8.00 support level.
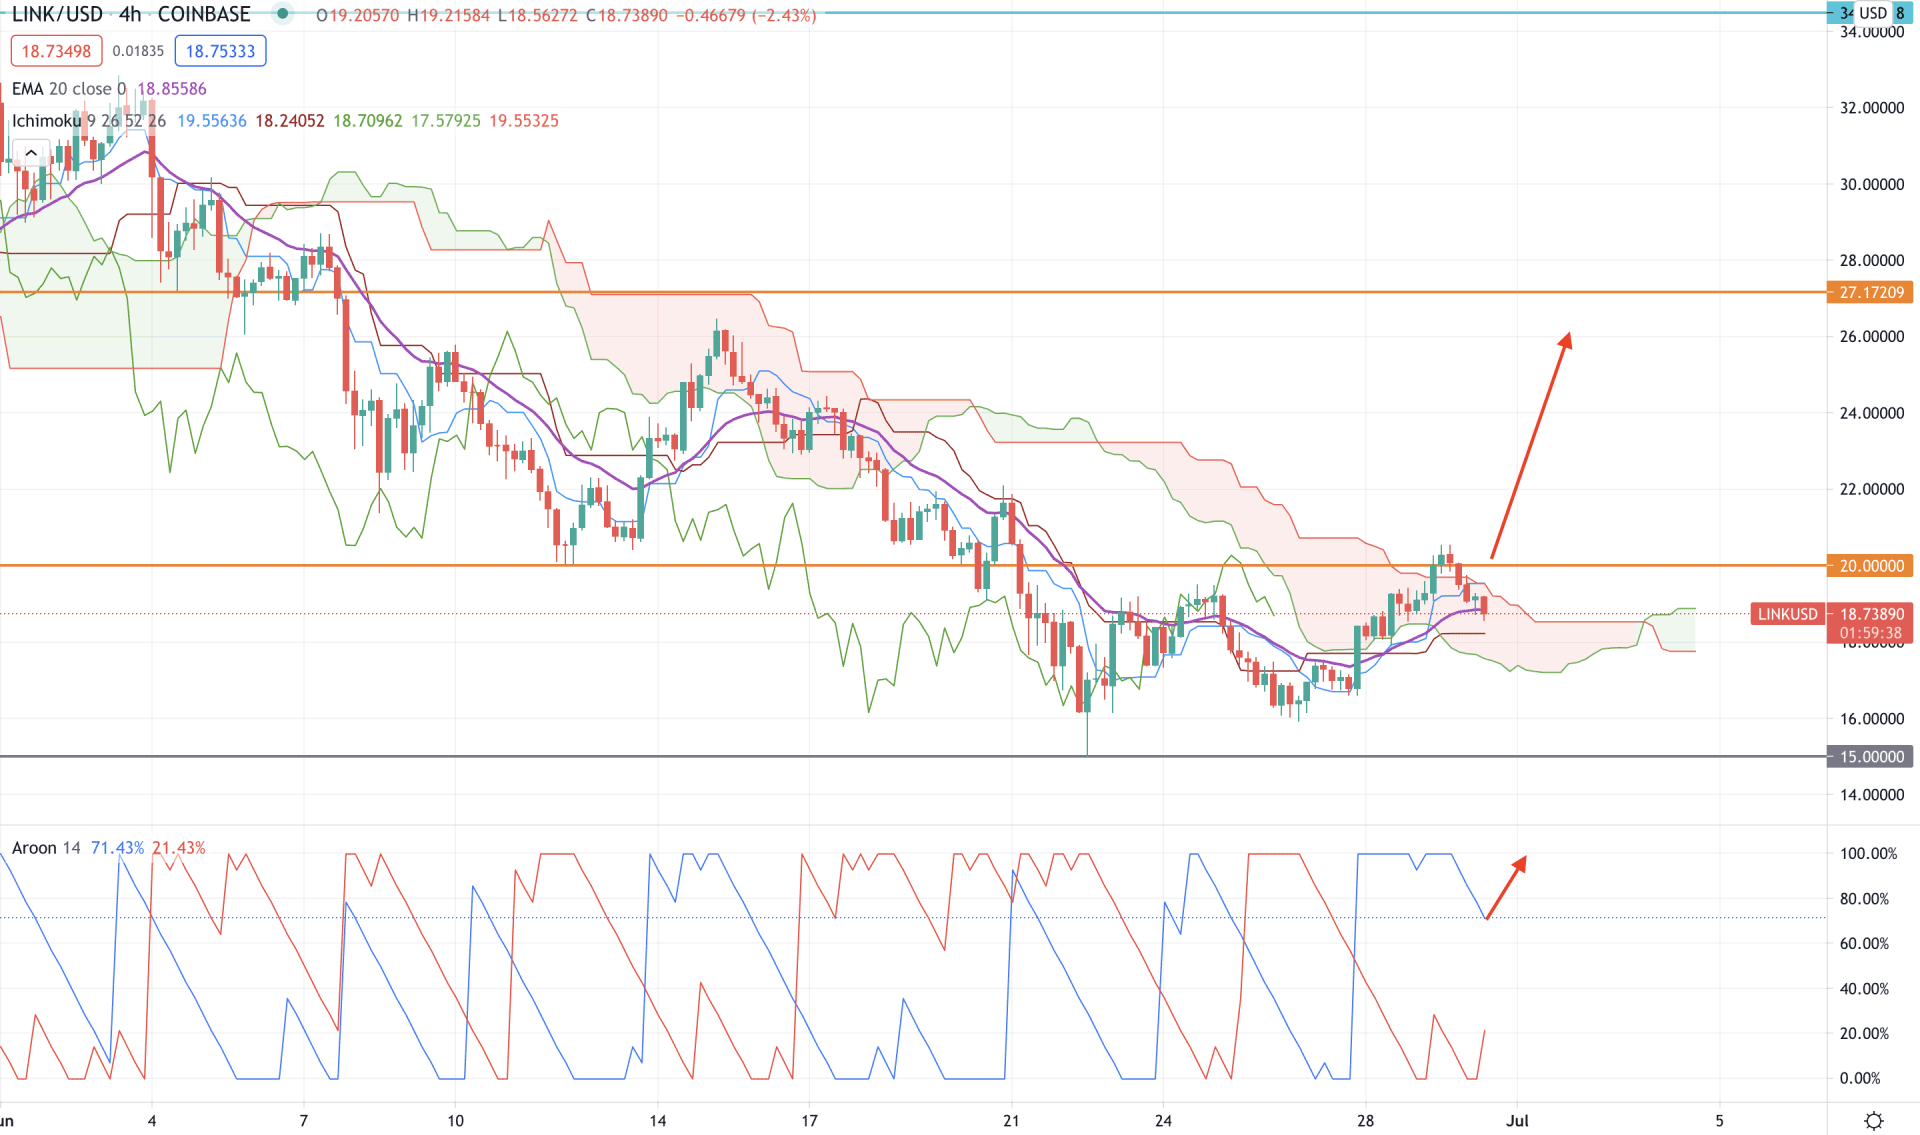
According to the Ichimoku Kinko Hyo on the H4 chart, the Chainlink price goes through a possible shift of trends as the price failed to remain below the Kumo Cloud. As a result, the price moved up above the Kumo resistance and corrected lower. Moreover, Senkou Span A is above Senkou Span B in the future cloud while the Chikou Span is above the current market price.
In the above image, we can see the H4 chart of Chainlink, where the price is above the dynamic Tenkan Sen and Kijun Sen. However, the bullish pressure is not stable as the price failed to hold the momentum above the 20.00 resistance level.
Aroon Up (blue line) is above the Aroon Down (red line) and correcting lower at 80% level in the indicator window. In this price context, a bullish H4 close above the Kumo resistance with the Aroon Up line at 100% level may begin a solid bullish trend towards 27.17 resistance level.
On the other hand, a strong bearish H4 close below the dynamic Kijun Sen and Kumo Support level may take the price lower towards 15.00 level.
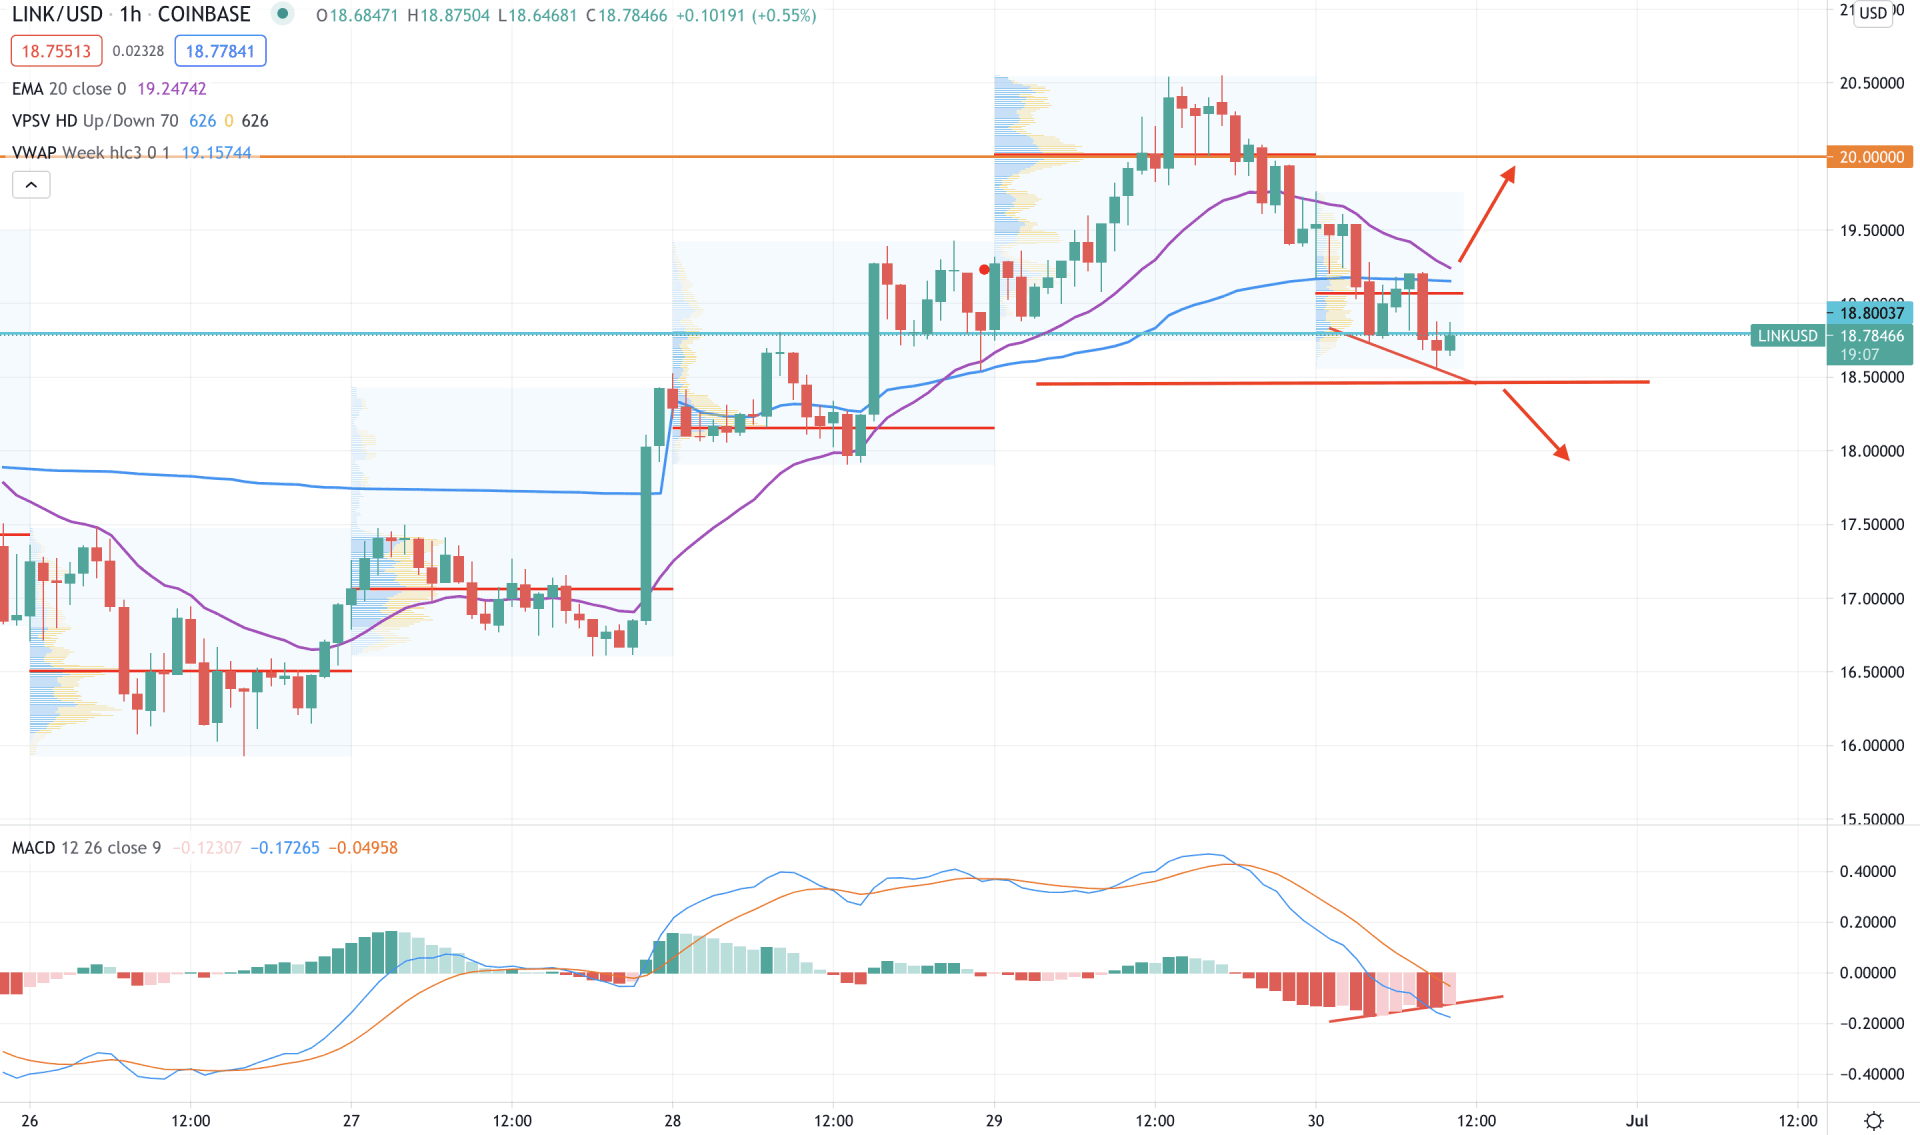
In the intraday price chart, Chainlink is trading below the intraday high volume level of 19.08. Moreover, the price failed to sustain above the 20.00 event level and moved down below the dynamic 20 EMA and vwap. Therefore, as long as the price is trading below the dynamic vwap level, it may move lower in the coming session.
The above image shows the H1 chart of LINK, where the price is trading at the intraday event level 18.78 level. However, buyers need to take the price higher above the dynamic vwap level, which may be higher above the 20.00 level. Moreover, there is a hidden divergence in MACD that may increase the correction to the price.
On the other hand, a strong bearish H1 close below the 18.50 level may take the price lower towards the 15.00 level.
As of the above discussion, we can say that the intraday Price action is still bearish for Chainlink, where a robust H1 close below 18.50 may increase the correction towards the 15.00 level.
On the other hand, investors should find a strong H4 close above the 20.00 level to consider the upcoming trend as bullish.


